

The intention of the below graphs are not to use to say "my price should be X based on this graph". These prices are derived from an FOB price point average. The intent is to show major global price movement trends. Your values will likely have significant basis difference (similar to your local grain price being different than the traded market price).
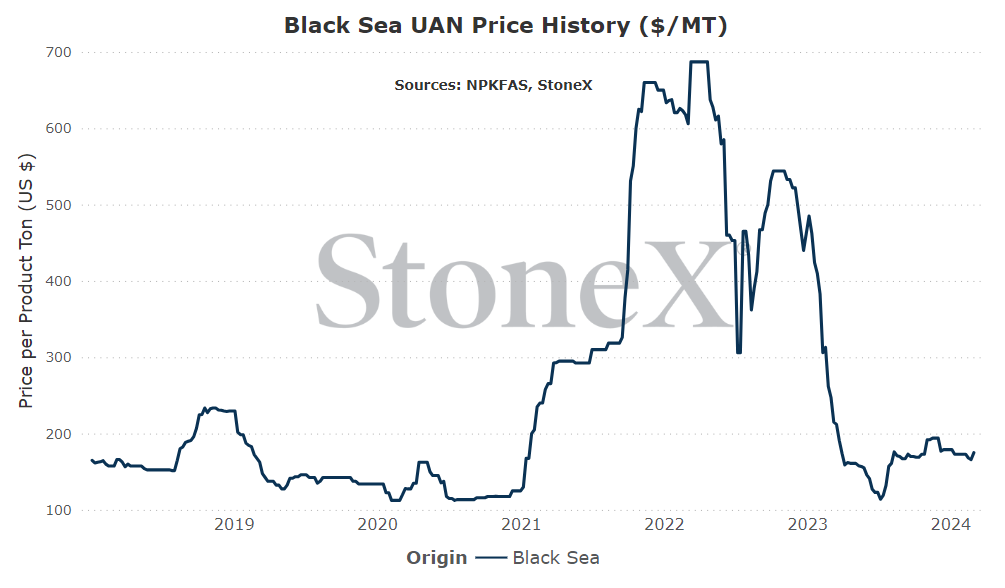
This graph is labeled as MT in USD currency.
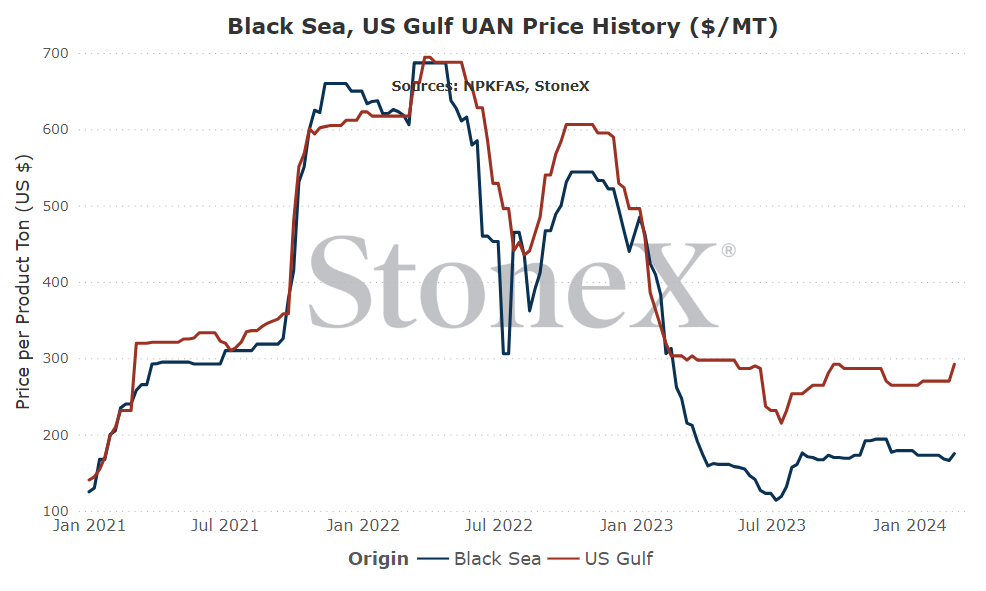
For the short term, seems the world of UAN is going to follow urea. As urea moves higher, UAN should follow. Then, we get into the weeds of the rest of the world vs Russia as the international price point. Russia, given their inability to go many places around the world (U.S. is one of the few, major demand destinations remaining), Russia fob values should closely mirror NOLA moves.
For the short term, it appears that global UAN values will remain flat to bullish. Once spring demand comes closer to an end (couple months), expect to see price ideas fall into typical summer resets.
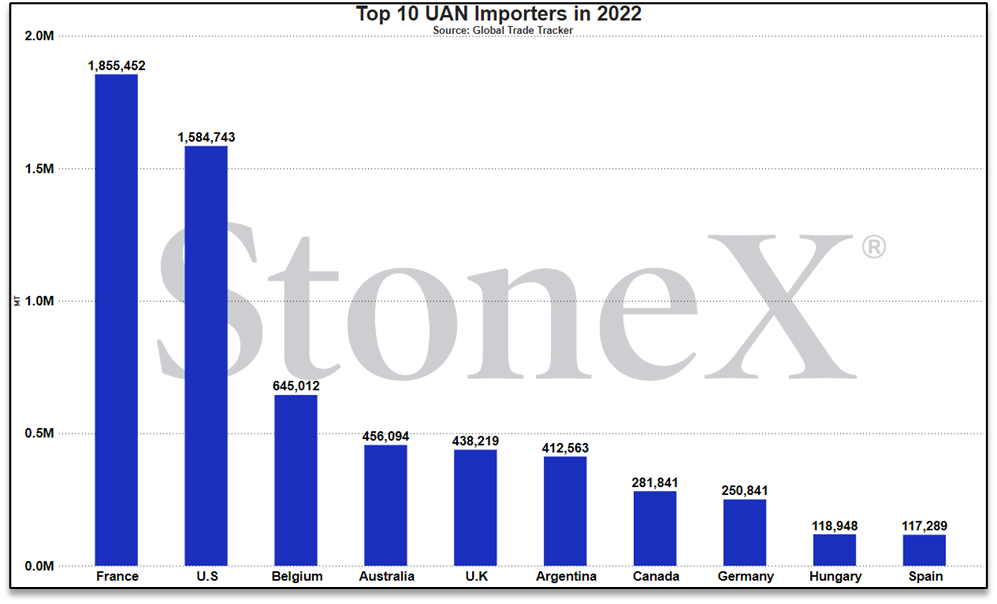
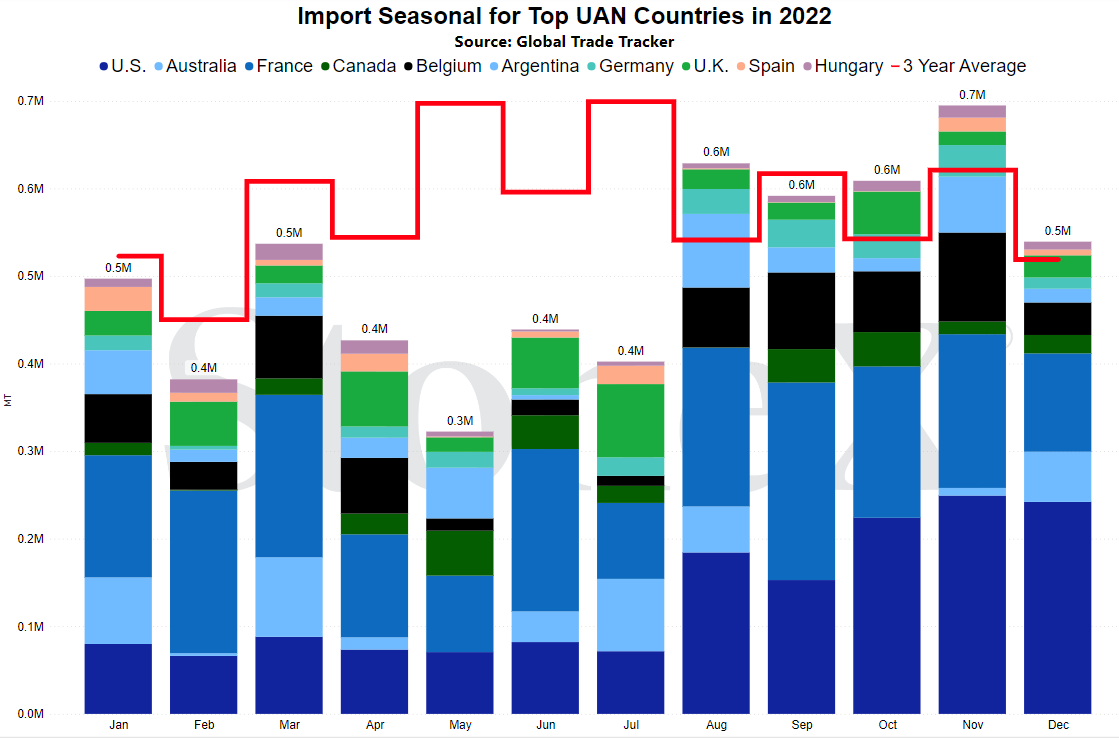
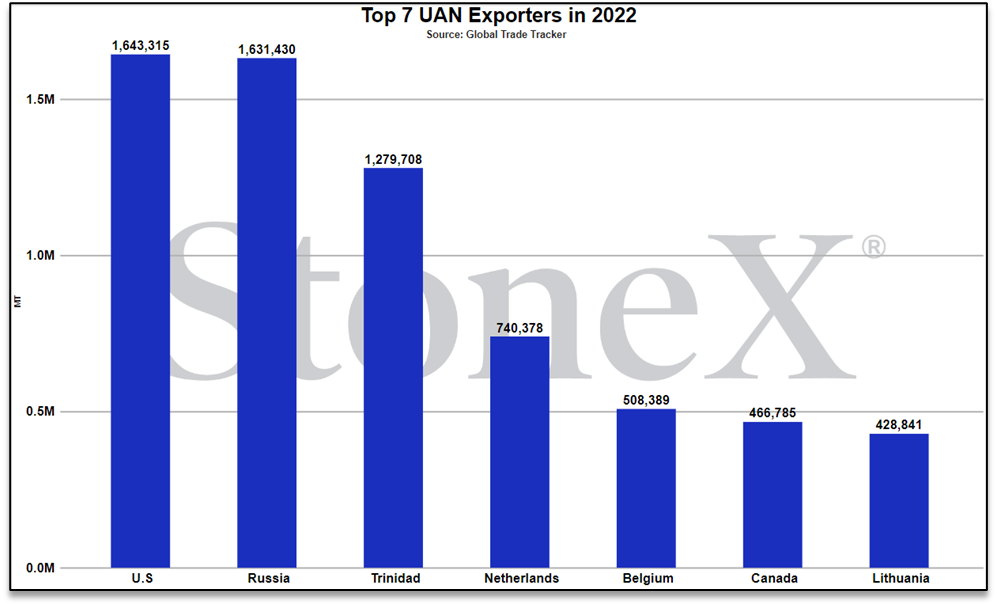
European outlook improving...but will it matter?
As we have discussed so...sooo many times over the last several months, the European outlook continues to improve. This month, I'm thrilled to say that Dutch TTF values have fallen into single digits with nearby months trading in the $7 - $8MMbtu range! That is fantastic for cost of production and should mean that more nitrogen production is coming online, right?
Not so fast.
Unfortunately, there are still a couple sticking points.
First, the political tension in Europe continues to rise as governments try to tell farmers what they can/cannot do. In response, farmers are protesting in a very big way. None of this builds the confidence of an offline nitrogen production facility to trust what is coming.
Second, the remaining offline plants are likely very old. This does not mean that they cannot come back online. It merely means that it is much tougher to do and if you are going to proceed, then you better have strong conviction that the plant isn't going to be taken offline again in the near future.
Sadly for buyers, we are still forced to sit and wait for news which may or may not come. In fact, even if a plant restarts, it would be in the best interest of the owner to be quiet about it. If you are vocal and tell the world, you are basically saying "I'm creating a lot more supply for the world". Doesn't exactly sound bullish, does it?
Hopefully one of these months in the near term we can report that the remaining plants are online. Today just isn't that day.
Why does this impact Australian farmers?
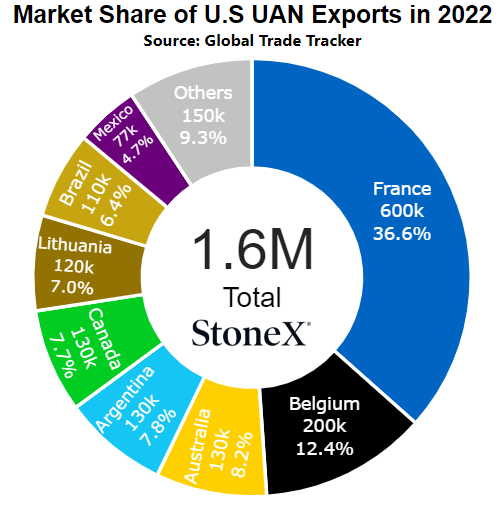
If Europe were to return to 100% production for UAN, that means the U.S. will not export product there. Those tons will then sit at "home" in direct competition with Russian imports. That should mean lower prices...and more of a focus on locking up any export opportunities available. Australia becomes that much more attractive as a result.
Early start to North American spring testing UAN
I'm copying this over from the U.S. version since the U.S. has been supplying most of the Australian imports. What happens in the U.S. happens to Australia right now.
Whoever had "spring for most of the Midwest will start mid-February" on their bingo card, please step forward!!!
The much earlier than normal start to spring has caught the industry off guard and has caused values to jump as a result. Nitrogen has been interesting from my POV. I understand why phosphate and potash would rally. Those are early application products that have no problem sitting there until they are needed. Even NH3 I can understand if stabilizers are applied to hold it in place until spring. However, UAN doesn't seem as though it will be any earlier.
That said, it doesn't mean the demand isn't there. We continue to see/hear that moisture conditions are exceptional compared to recent years in the south so many believe that demand will be solid. Then, we are seeing NOLA urea values rising in an attempt to move to parity/higher than world replacement to get imports flowing. If urea is moving higher, why wouldn't UAN follow?
In the end, UAN is moving higher. We are not only seeing that but also hearing that price programs are being pulled from time to time to "recalculate". That is a fancy way of saying "we have sold a lot of product and need to make sure we cover the sales and then push higher". Inventories are tighter than expected by many in the industry so do not be surprised if this story continues to be discussed next month.
Why does this impact Australian farmers?
Right now, what happens in North America happens to Australia as well given the reliance on product flow. Sometimes, things halfway around the world impact your farm.
In recent weeks, Russia has once again made international headlines. A political opponent was reportedly assassinated and the world took notice. Quickly, rebukes from nations around the globe and the threat of further sanctions were discussed.
Some in the fertilizer industry theorized that they thought fertilizer might be on the table. On the surface, I understand where they are coming from. The Russian economy has weathered the storm since their invasion of Ukraine due to their reliance on natural resource sales. Not hard to figure out that is where the pain point would be if desired.
However, at what cost? Russia is a major exporter of all types of fertilizers. A large part of the early 2022 price spikes was the feared loss of Russian exports. No one wants to relieve that storyline again.
From my vantage point, this is an extremely lower probability situation...but a large impact. Because of that, we need to continue to watch. Not only would sanctions hurt the UAN market, it would impact almost every fertilizer out there.
Why does this impact Australian farmers?
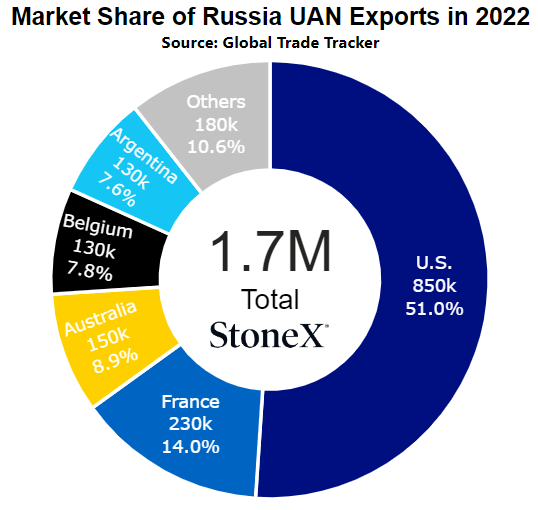
This would be huge. Right now, one of the last large demand spots for Russian UAN is the U.S. If the U.S. sanctions Russian UAN, there is very little demand left in the world and Russia chokes on its supplies. In turn, global supplies drop while demand remains constant. That is a bullish outlook.
NOLA/New Orleans, Louisiana
Number 2 global importer in 2022
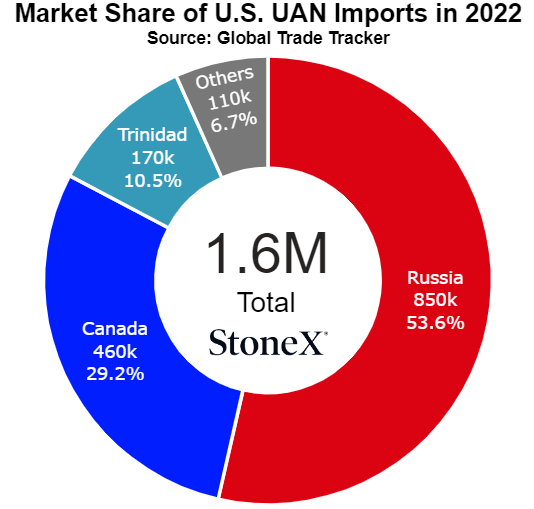
Number 1 global exporter in 2022
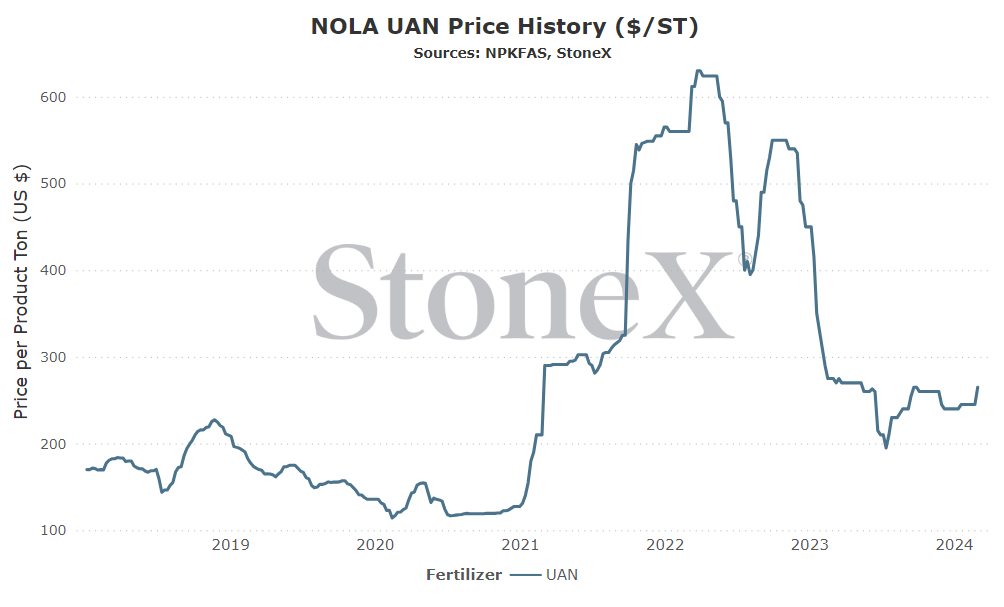
Price comparisons
Vs 30 days ago - +8% or approximately $20 higher
Vs 90 days ago - +2% or approximately $5 higher
Vs 6 months ago - +10% or approximately $25 higher
Vs 1 year ago - -4% or approximately $10 lower
Black Sea (Russia)
Number 2 global exporter in 2022
Price comparisons:
Vs 30 days ago - +1% or approximately $2 higher
Vs 90 days ago - -10% or approximately $19 lower
Vs 6 months ago - +3% or approximately $5 higher
Vs 1 year ago - -29% or approximately $72 lower
- Russian actions cause the world to sanction their fertilizer exports - while not likely, the chance is not zero so we need to watch for it. If we see these assassinations continue or they take further steps in Ukraine, we could see the world cut them off. That would very quickly tighten the global S&D for UAN.
- Urea being bullish – for the time being, UAN is playing catch up to urea strength. While manufacturers want to stay engaged in the UAN marketplace, they will also look for opportunities to follow other products higher. Urea is currently on a tear higher so makes sense that UAN follows.
- North America tight starting inventories/production issues – we knew at the start of the fertilizer year that inventories were low. We also figured that exports would remain strong and some production issues would occur. However, we didn't anticipate imports being slightly lower and production issues bigger than forecasted. Inventories are tight and that is generally reflected in values.
- Europe restarting – while it still doesn't seem largely likely, there is still a chance. If we see the remainder of Europe restart, that means it no longer needs imports. North America has been a big provider of product. If that avenue gets shut off, those tons get shoved back into the market. That is a great recipe for lower values.
- The point when fear of carryover outweighs nearby tight supplies - at some point (not likely nearby), the market will care more about selling any remaining long positions rather than holding out for the in season premium. Today is not likely going to be that day given how tight inventories are and global issues. But the day is likely coming.
- Lower grain values could hurt fertilizer demand - none of the below ratios are incredibly out of line like years past, but they are rising. If this continues, there might be a low enough grain value where some demand says no thank you or goes to another form of N.
We believe that only looking at the flat price of either grains or fertilizer can be misleading:
-
Only selling grain can hurt you if fertilizer prices rise substantially
-
Only buying fertilizer can hurt you if grain prices fall
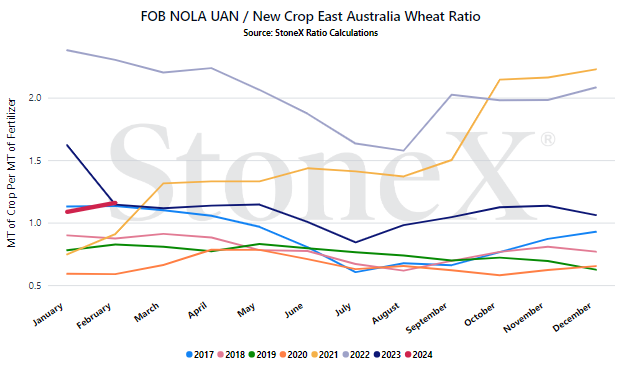
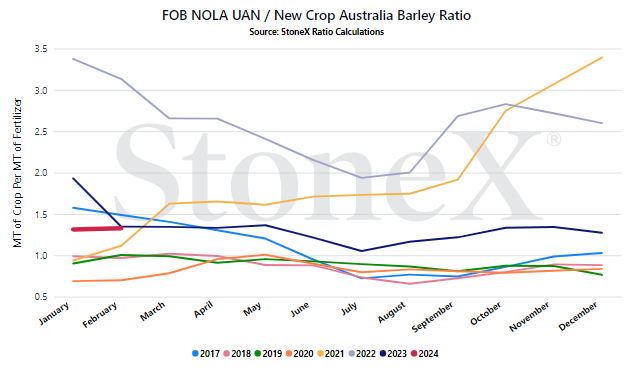
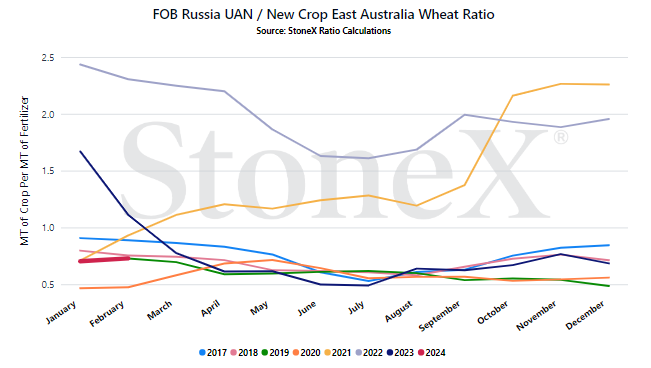
We look at the ratio "value" to get a better indication of where we are or how many bushels of X does it take to pay for 1 ton of fertilizer.
Would you rather:
-
Spend 100 bushels to pay for 1 ton of UAN
-
Spend 60 bushels to pay for 1 ton of UAN
When we compare the current ratio value against recent years, we start to see if we are high or low.
YOUR VALUES MAY LOOK DIFFERENT
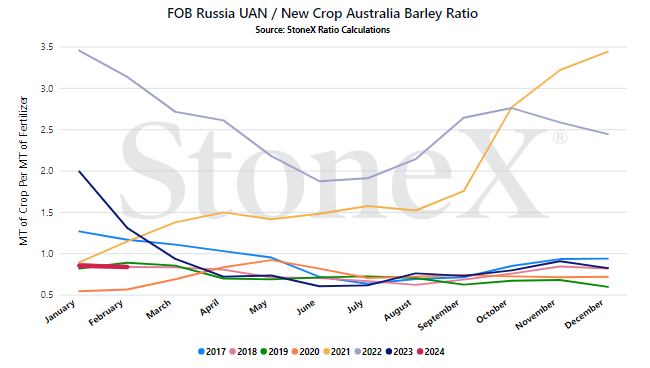
This graph looks at the NOLA UAN price vs the flat grain price. There are no logistics on either product. Your location will look different due to fertilizer logistical costs, grain basis, etc.
- Urea values - if urea continues to push higher, it makes sense that UAN would follow. If it doesn't, then a huge amount of demand will switch from urea to UAN and cause inventories to shrink. Unfortunately, that is how free markets work. With urea being the more and widely produced nitrogen, it largely sets the pace for all nitrogen products.
- European production - if Europe were to restart their offline plants, it would mean they no longer need imports from North America. What happens if North America suddenly gets a lot of UAN pushed back into its lap? That's right, they have to compete to make it disappear. That is good for the buyer.
StoneX Ratio Calculation
The ratio calculation is derived from Bloomberg historical grains values as well as fertilizer values from StoneX, NPKFAS, and Argus.
The calculation is simply dividing the fertilizer price by each grain price.
All data was sourced from StoneX unless otherwise noted.




