

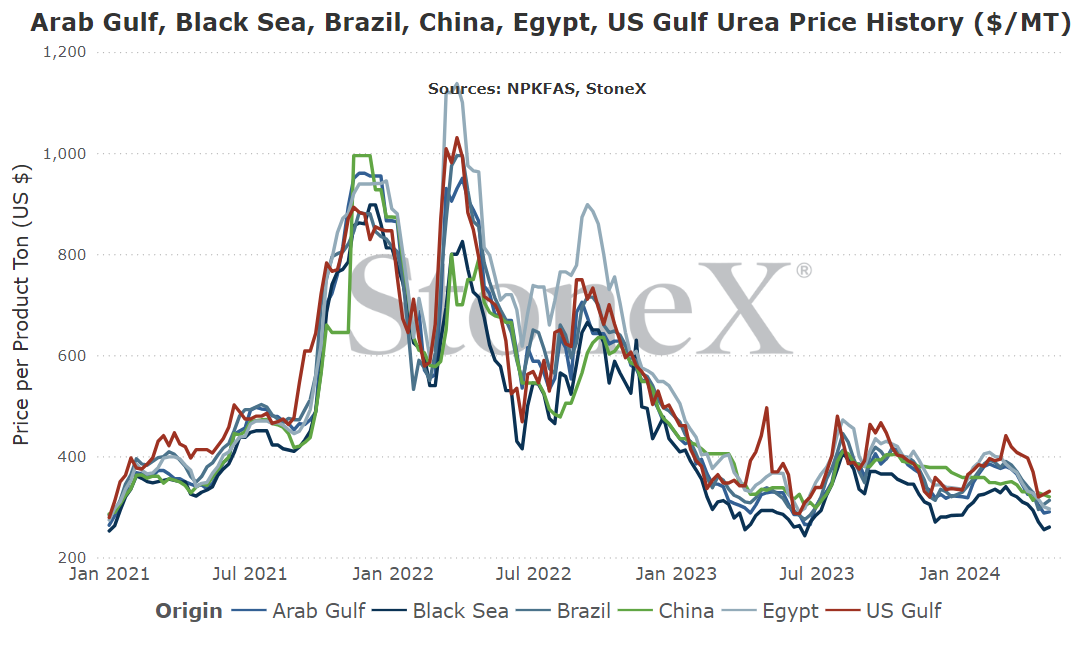
The intention of the below graphs are not to use to say "my price should be X based on this graph". These prices are derived from an FOB price point average. The intent is to show major global price movement trends. Your values will likely have significant basis difference (similar to your local grain price being different than the traded market price).
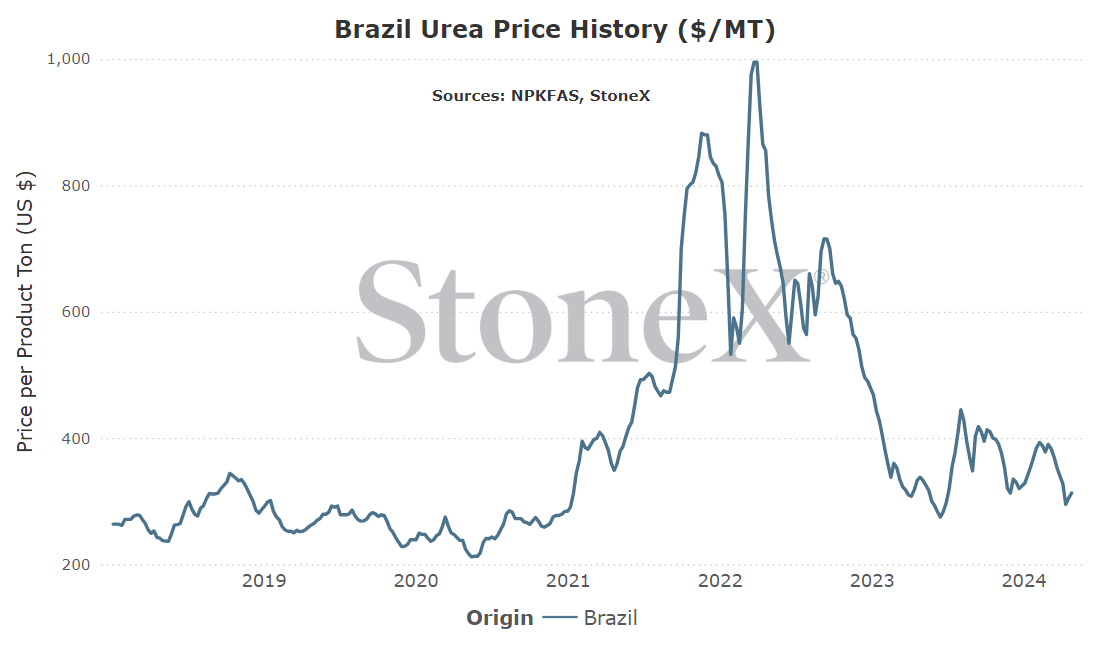
This graph is labeled as MT in USD currency.
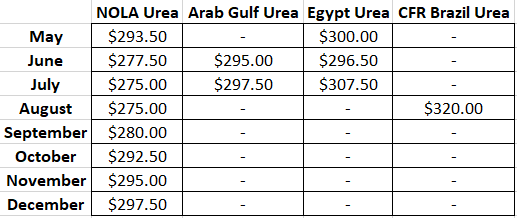
While the fertilizer futures market is far from as liquid as its grain counterparts, it is still active and gives us an insight into what the market is thinking.
Please note that the values below can and will change daily. This is merely a look at where they are as of writing:

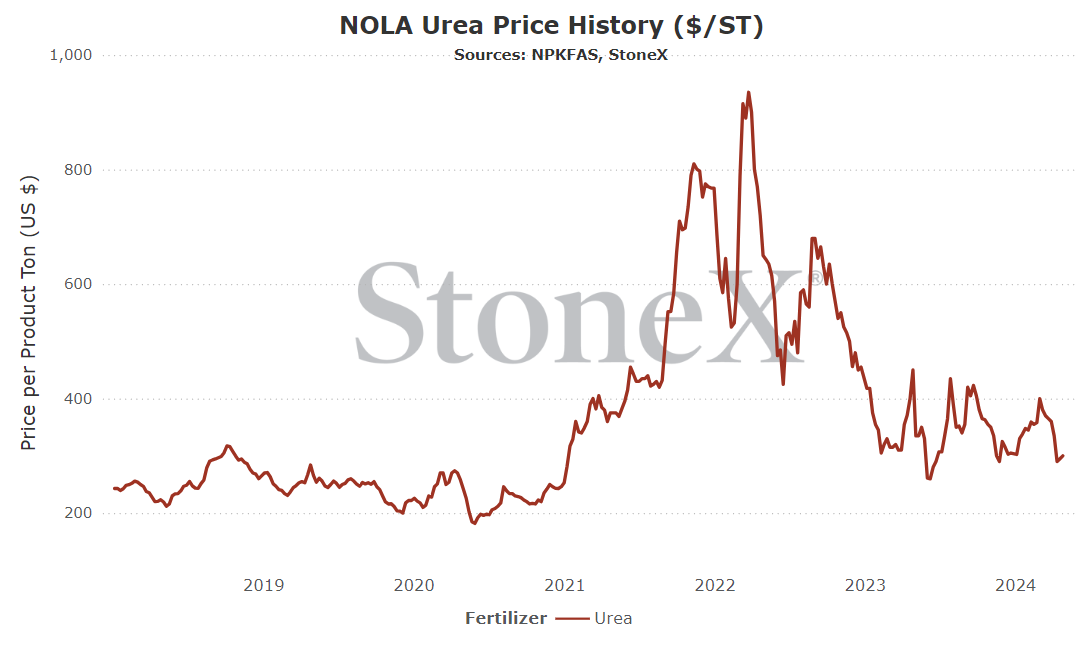
NOLA/New Orleans, Louisiana
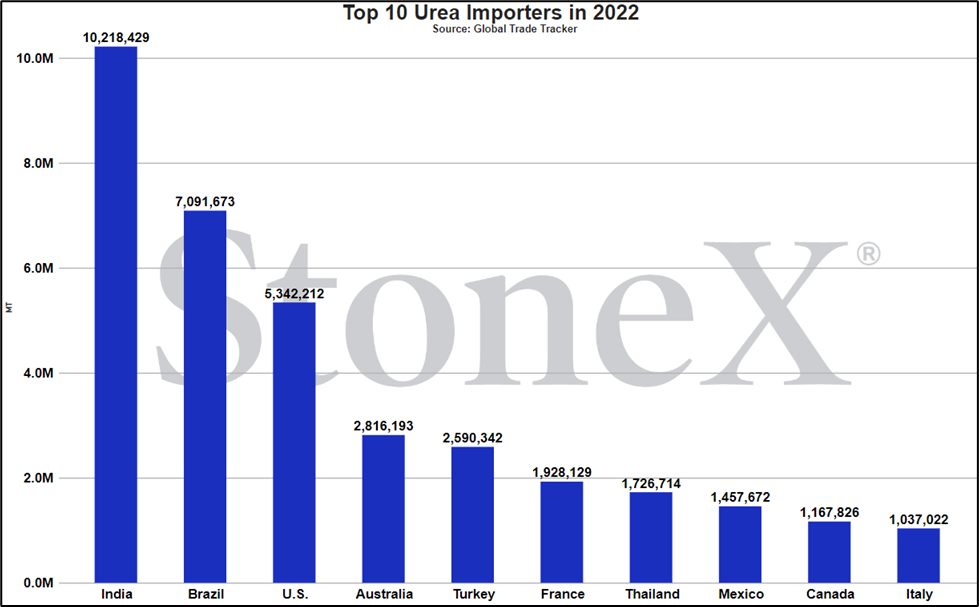
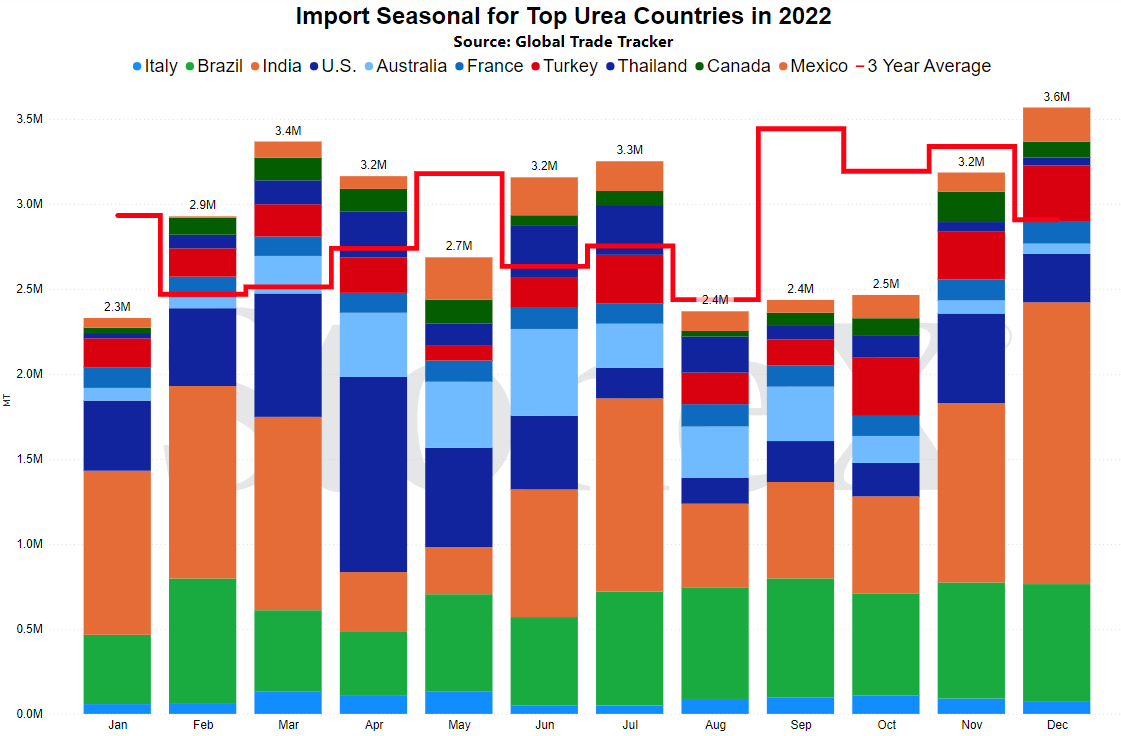
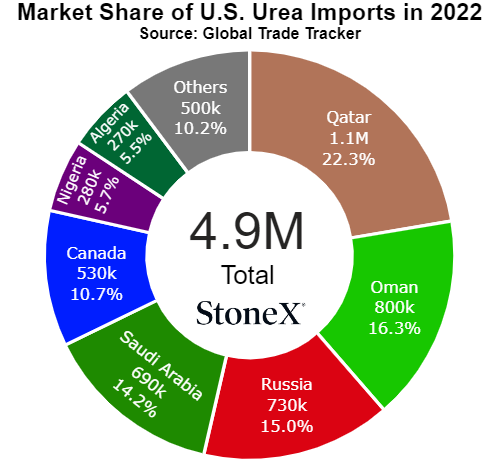
Number 3 global importer in 2022
Price comparisons
Vs 30 days ago - -17% or approximately $60 lower
Vs 90 days ago - -14% or approximately $48 lower
Vs 6 months ago - -17% or approximately $63 lower
Vs 1 year ago - -33% or approximately $150 lower
U.S. Midwest Average
Vs 30 days ago - -16% or approximately $74 lower
Vs 90 days ago - +4% or approximately $14 higher
Vs 6 months ago - -15% or approximately $68 lower
Vs 1 year ago - -19% or approximately $94 lower
U.S. Southern Plains Average
Vs 30 days ago - -15% or approximately $75 lower
Vs 90 days ago - +4% or approximately $15 higher
Vs 6 months ago - -8% or approximately $35 lower
Vs 1 year ago - -14% or approximately $65 lower
U.S. Northern Plains Average
Vs 30 days ago - -13% or approximately $60 lower
Vs 90 days ago - +4% or approximately $15 higher
Vs 6 months ago - -10% or approximately $48 lower
Vs 1 year ago - -17% or approximately $85 lower
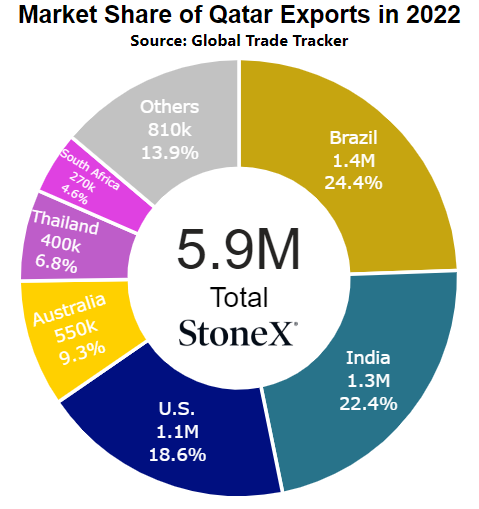
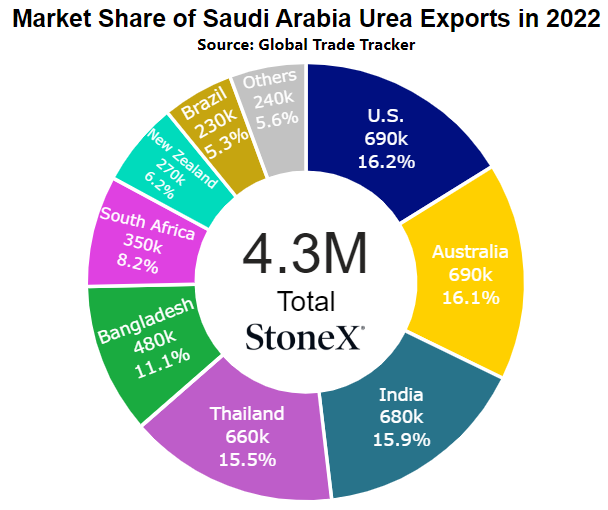
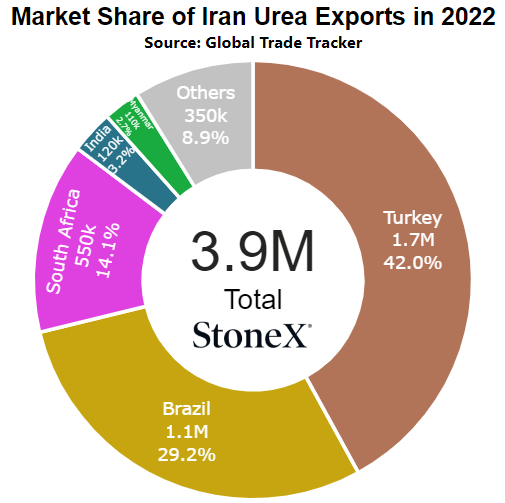
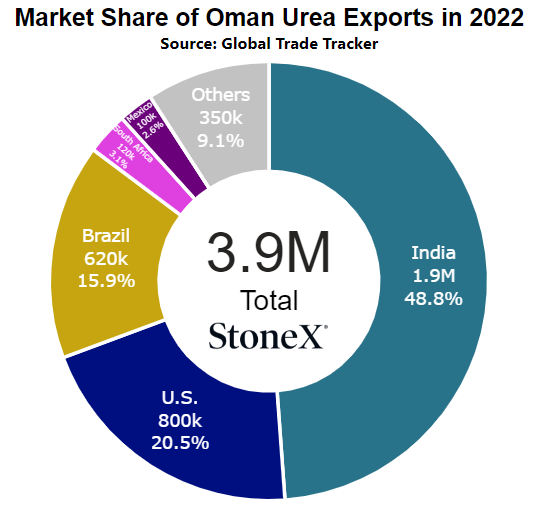
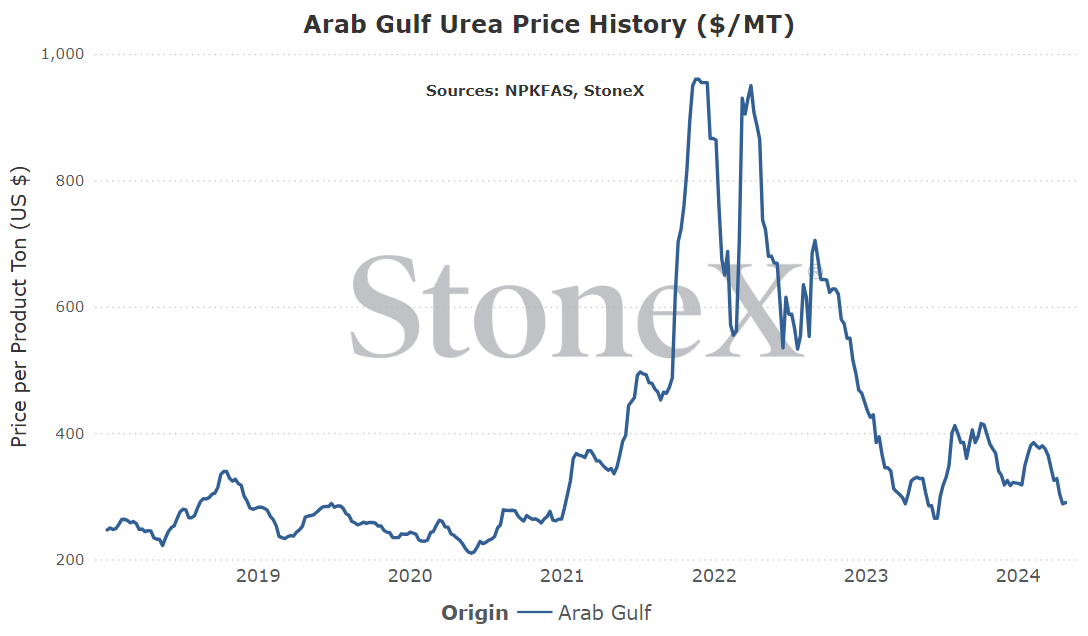
Middle East
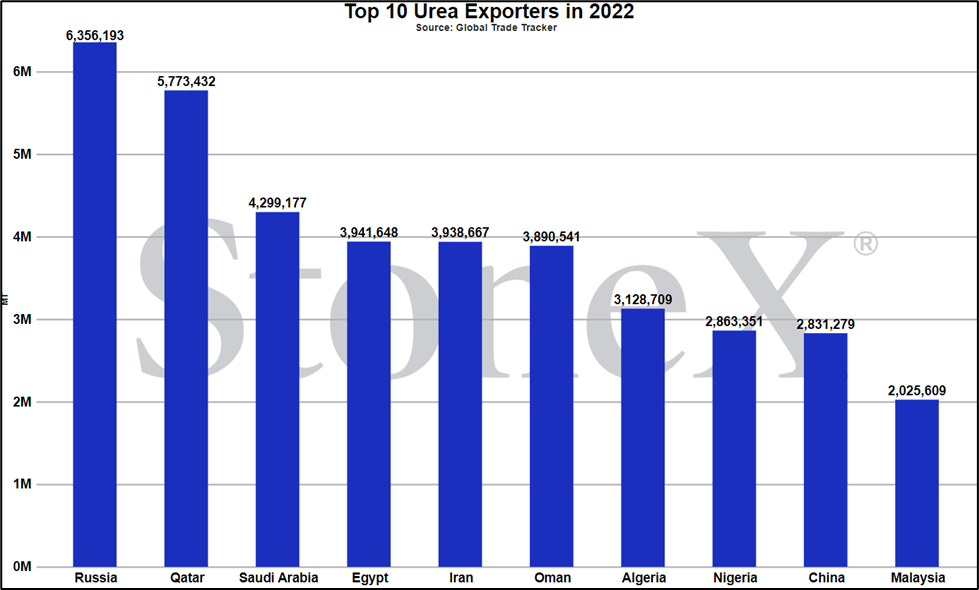
Number 1 exporter (as a region, not as individual nations)
Vs 30 days ago - -11% or approximately $35 lower
Vs 90 days ago - -21% or approximately $75 lower
Vs 6 months ago - -27% or approximately $108 lower
Vs 1 year ago - -11% or approximately $38 lower
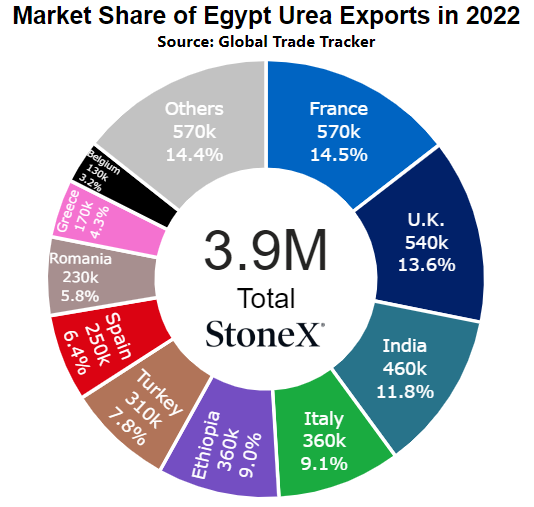
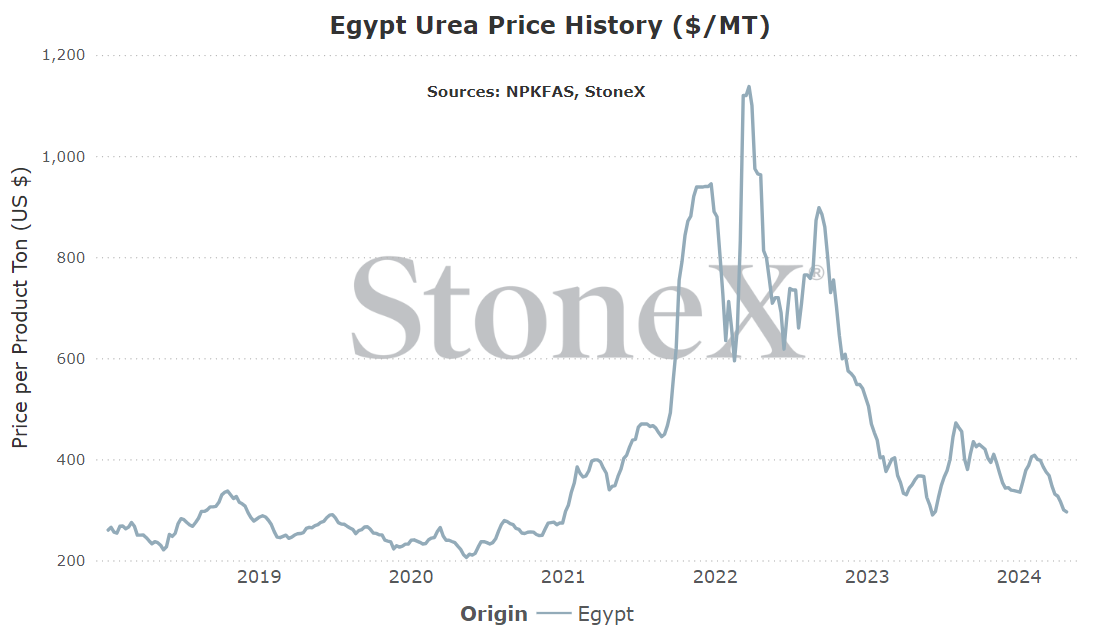
Egypt
Number 4 global exporter in 2022
Price comparisons
Vs 30 days ago - -11% or approximately $35 lower
Vs 90 days ago - -24% or approximately $92 lower
Vs 6 months ago - -26% or approximately $106 lower
Vs 1 year ago - -18% or approximately $64 lower
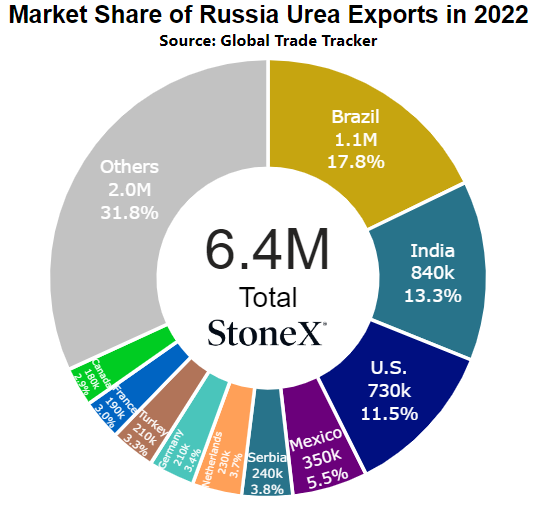
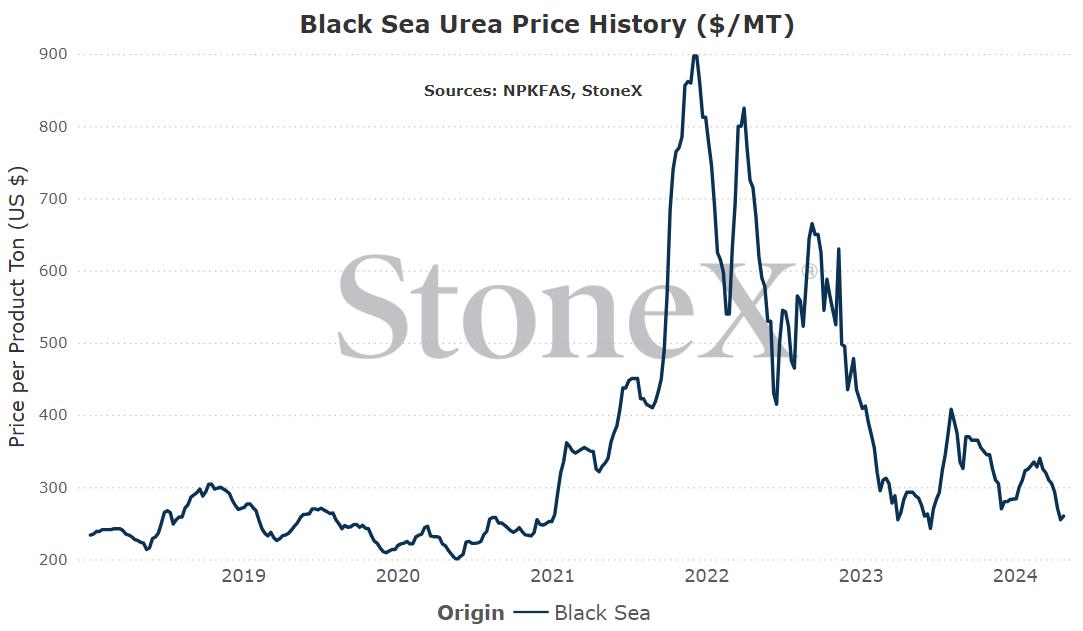
Black Sea
Number 1 global exporter in 2022
Price comparisons
Vs 30 days ago - -15% or approximately $45 lower
Vs 90 days ago - -19% or approximately $63 lower
Vs 6 months ago - -26% or approximately $90 lower
Vs 1 year ago - -11% or approximately $33 lower
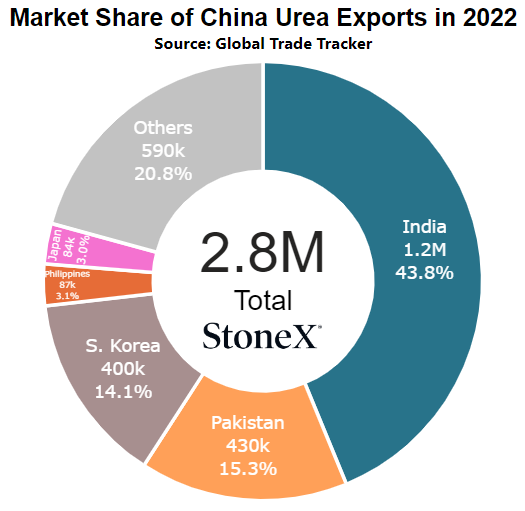
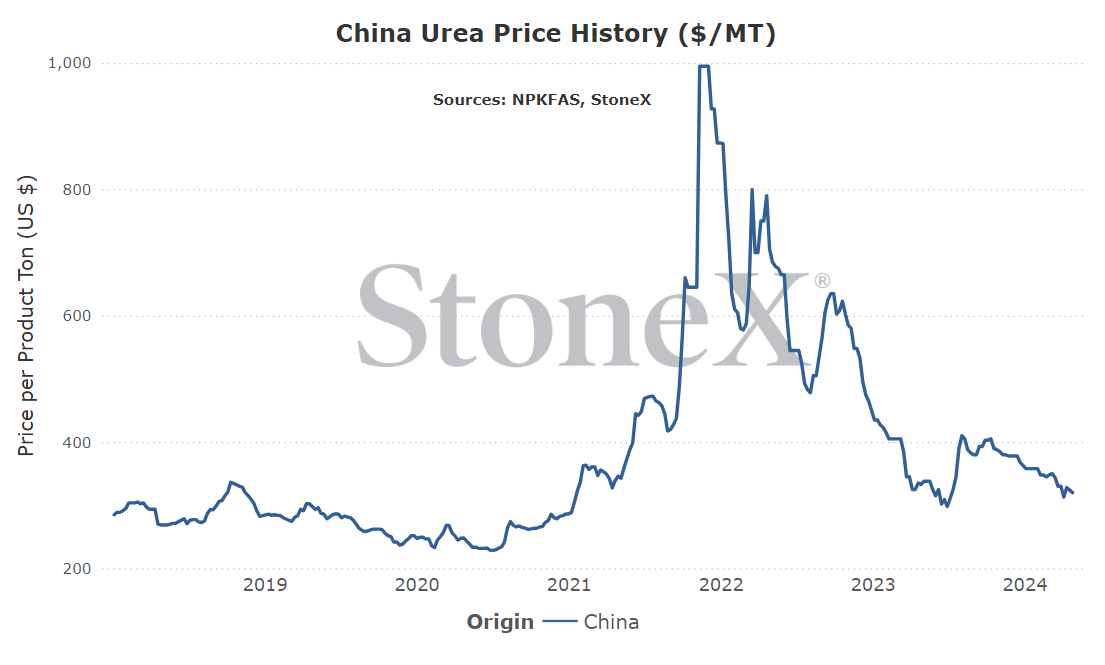
China
Number 9 global exporter in 2022
Price comparisons
Vs 30 days ago - -3% or approximately $10 lower
Vs 90 days ago - -10% or approximately $38 lower
Vs 6 months ago - -18% or approximately $70 lower
Vs 1 year ago - -4% or approximately $13 lower
Brazil
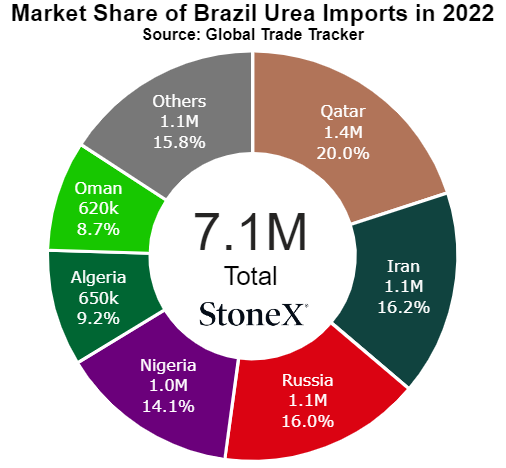
Number 2 global importer in 2022
Price comparisons
Vs 30 days ago - -8% or approximately $28 lower
Vs 90 days ago - -16% or approximately $58 lower
Vs 6 months ago - -22% or approximately $87 lower
Vs 1 year ago - -7% or approximately $25 lower
- China limits exports - Chinese exports are typically seen as the urea boogeyman...at least to me they are. When exports return to the market, I see it as the return of a very motivated seller which means other sellers need to get price aggressive. However, if we see the Chinese government clamp down on exports, as rumors have swirled, the opposite happens. While we still expect China to return, it is not out of the question that the government could slow them once again to help lower domestic price ideas.
- Global manufacturers shut down production for repairs during low price timeline - the coming weeks/months could provide a perfect time to shut down a plant for repairs. Given recent market values/margins, manufacturing plants should have been running as hard as possible. That breakneck pace creates a lot of wear and tear on equipment. So if the plant needs repairs and the looming market is low priced and low demand, why not pull forward that shut down date if possible. Better to not be producing product when demand and prices are low vs when there is ample demand and high prices/margins. Enough production goes down and it could certainly tighten global supplies. It wouldn't be the first time this has happened.
- Buyers come out of the woodwork to take advantage of low price opportunities - prices cannot go down forever. Pretty sure we are not going to see manufacturers paying parties to take their urea. What is this, oil?!! In all seriousness, at some price point, we could pull a lot of demand forward. If demand starts to step forward early, it could provide some excitement that could boost price ideas. Eventually, we would need to worry about how quiet it will be when those buyers would normally return but for that period where buying happens, prices could reflect higher.
- China returns to their export plans - if/when Chinese exports return to the global marketplace, that will mean the return of aggressive competition. Chinese exporters have been removed from the world stage for some time. Many will be looking to get a foothold back in the market which should spook other sellers. That competition should breed lower values.
- Global buyers pull back further on weak markets - prices are already down much earlier than expected. If prices are already down to this level, what will be possible in the weeks/months to come? Desperation typically results in more desperation and many buyers around the world have been taught over and over again to not be the first to stick their hand out. Wait for a bounce before committing. If buyers stay away, it just makes for an even more bearish outlook.
- Europe/Brazilian production resumes full capacity - today, the biggest shortfalls on production of urea are Europe and Brazil. Brazil is fighting high domestic natural gas values...but it is not out of the question that the government could step in as they understand the importance of domestic production. Europe could also improve. While profitability has not improved, warmer temps will make it easier to restart old plants and manufacturers will want to jump ahead of importers. If both return, the global supplies could be back to normal levels...which should drop global price ideas.
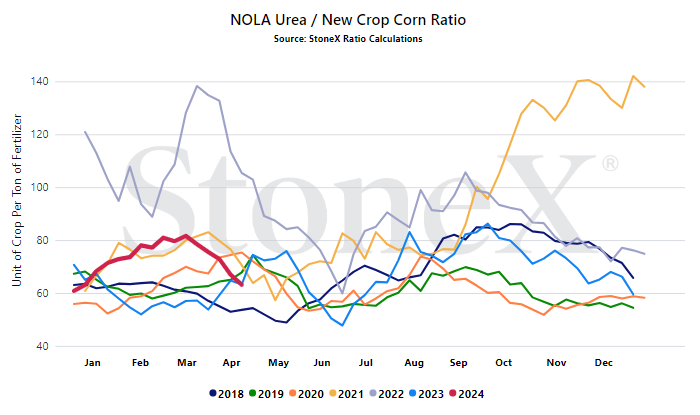
We believe that only looking at the flat price of either grains or fertilizer can be misleading:
- Only selling grain can hurt you if fertilizer prices rise substantially
- Only buying fertilizer can hurt you if grain prices fall
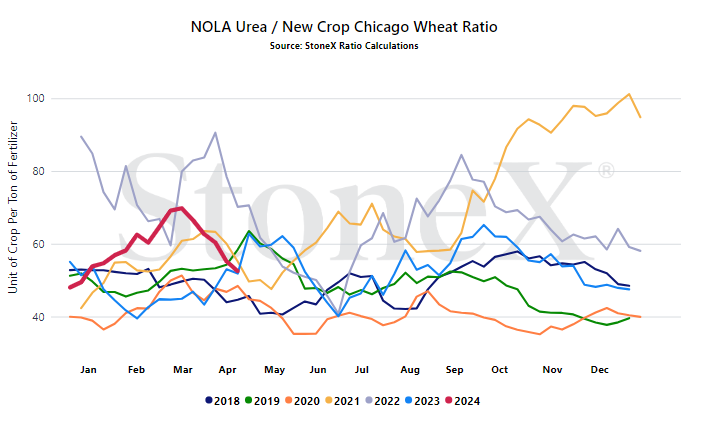
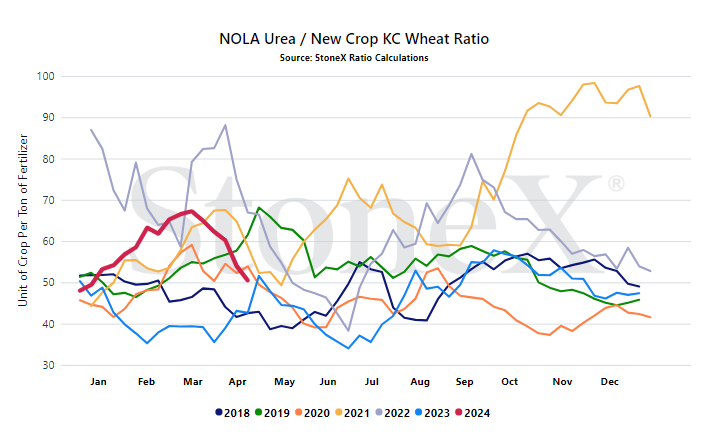
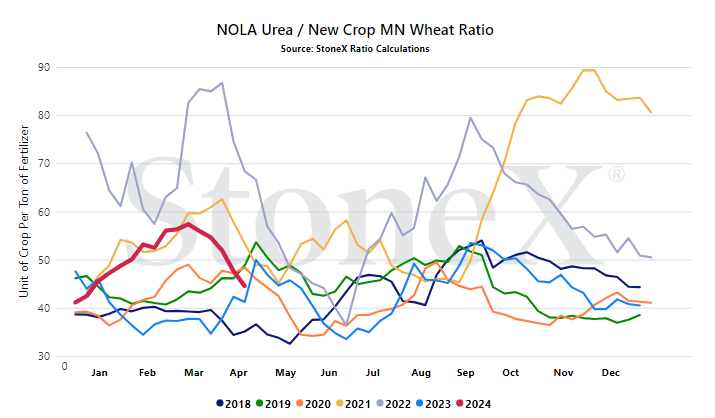
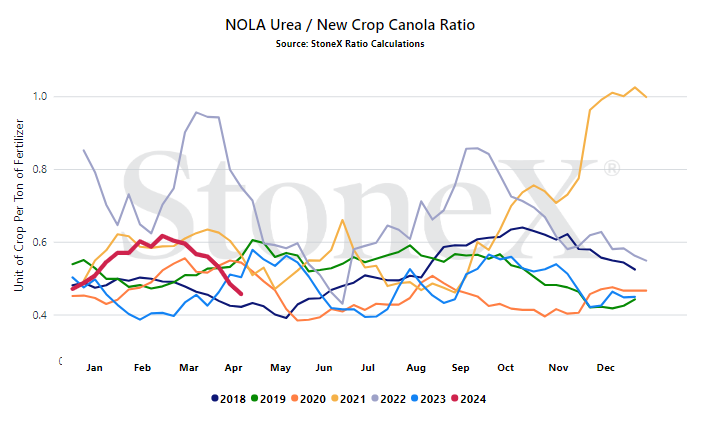
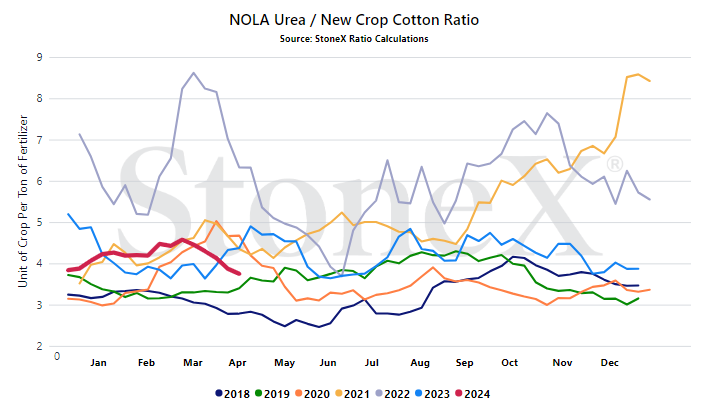
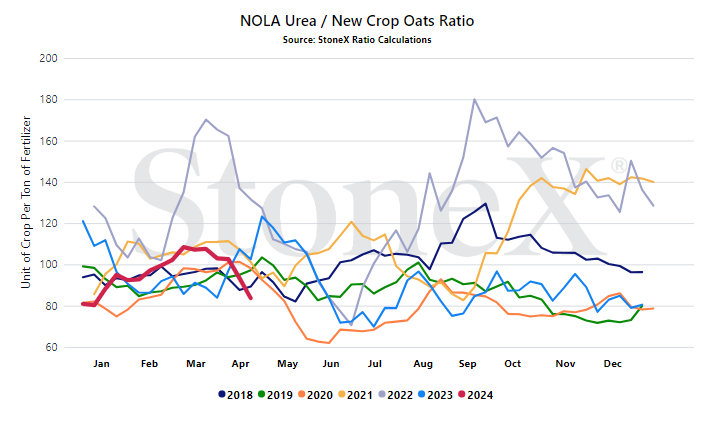
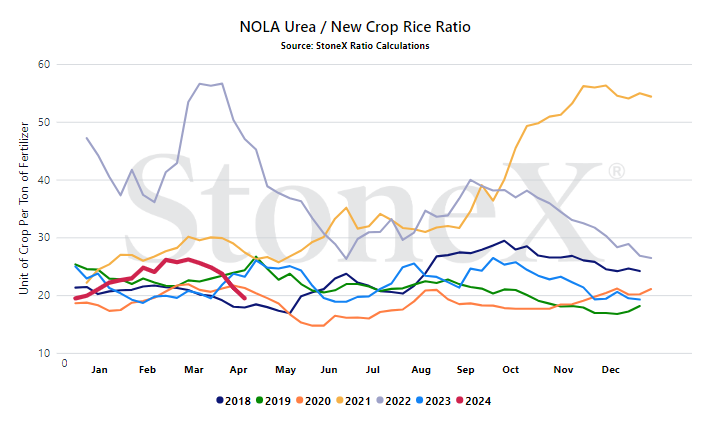
We look at the ratio "value" to get a better indication of where we are or how many bushels of X does it take to pay for 1 ton of fertilizer.
Would you rather:
- Spend 135 bushels to pay for 1 ton of urea
- Spend 55 bushels to pay for 1 ton of urea
When we compare the current ratio value against recent years, we start to see if we are high or low.
YOUR VALUES WILL LOOK DIFFERENT
This graph looks at the NOLA urea price vs the flat grain price. There are no logistics on either product. Your location will look different due to fertilizer logistical costs, grain basis, etc.
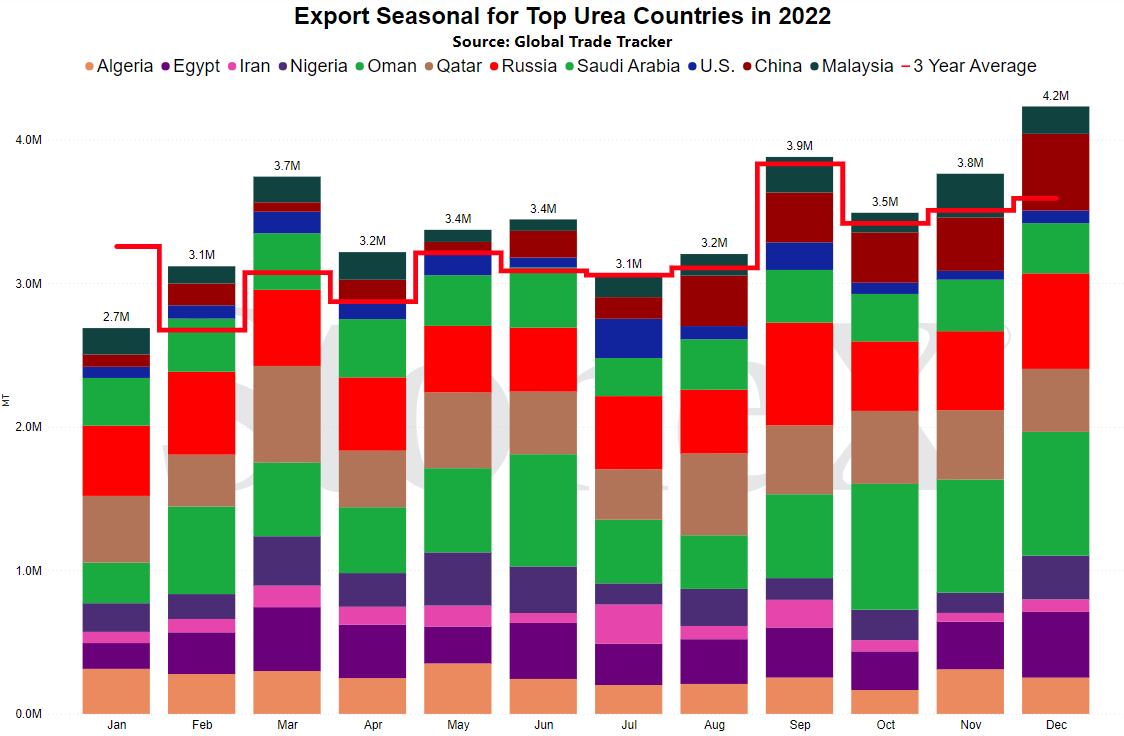
- Chinese export programs - what China does or does not do with urea export programs will go a long way in dictating global price directions. Historically, China accounts for approximately 10% of the global export market so when they are absent, values are supported. Opposite holds true. We must continue to watch China, a nation notorious for not sharing info, for signs of where the world will go.
- Price of urea vs the price of grains - it isn't always just about the flat price. Some of the summer values already being discussed are higher than our summer reset low expectations. That means they should be ignored, right? Wrong. The problem is that we could be right that urea drops another $25+ from where it is today (theoretically). However, if corn values come under pressure due to higher acres and solid growing conditions, ultimately our value could be worse. We need to start watching for opportunities to lock in both sides of the farm equation.
- Looming bearish markets vs current tight regional S&D - this was a tough month to write. As I look around the world, I see a lot of bearish values. However, I'm waiting for the responses of "well, my prices have not moved". I wish that were not reality...but it is. Unfortunately, it still takes 30 days for a vessel to depart the Middle East and arrive to a N.A. shore. Then, it takes a further 30 days to get that product to a location available to you. This is one of those times of the year where the local market means more than the global market.
- Middle East tensions - with a lot of the Middle Eastern tensions appearing to have lowered, I didn't want to spend a lot of time covering it...but do not make the mistake of thinking that situation is gone. It would take very little for that situation to erupt once again. We nearly saw it with the tit for tat issue with Israel/Iran. Know that today we are never far away from this becoming a regional crisis...which would mean a crisis of urea if the Persian Gulf is shut down...
StoneX Ratio Calculation
The ratio calculation is derived from Bloomberg historical grains values as well as fertilizer values from StoneX, NPKFAS, and Argus.
The calculation is simply dividing the fertilizer price by each grain price.
All data was sourced from StoneX unless otherwise noted.




