North American Currencies Q4 2025: Can the Canadian Dollar and Mexican Peso Hold Their Strength?
In the North American economic bloc, the currencies of the United States, Mexico, and Canada remain essential for regional financial stability and trade flows. By the end of 2025, the USD/CAD and USD/MXN pairs face a scenario shaped by low interest rates, trade tensions from the first half of the year, and ongoing uncertainty around economic growth. Within this context, it is worth noting that both the Canadian dollar and the Mexican peso have managed to maintain strength throughout 2025, in contrast to the persistent weakness of the U.S. dollar.
What is the new role of central banks?
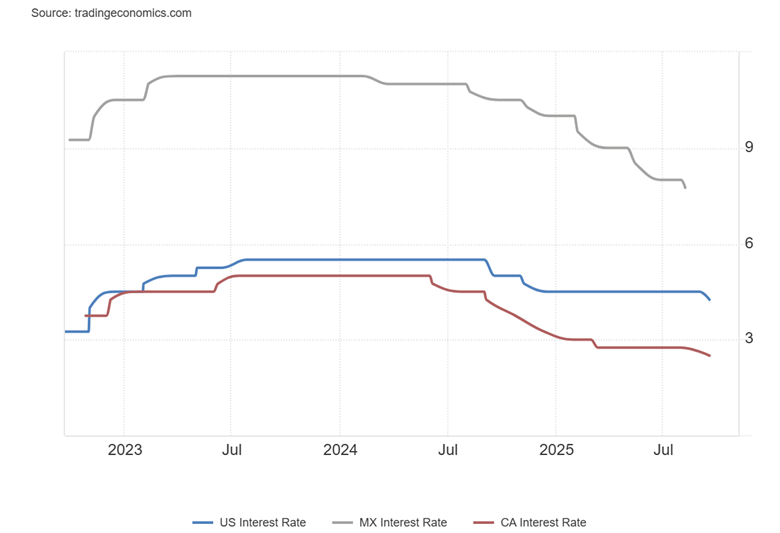
At the time of writing, the North American central banks collectively show a dovish stance, with rate cuts already embedded in their agendas. Standing out is the Bank of Mexico, which since June 2024 has lowered its benchmark rate from 11.00% to the current 7.75%, making it the only one to maintain a sustained easing cycle and positioning it as the region’s most flexible monetary authority in recent months.
The Bank of Canada has followed a similar path, alternating between rate cuts and periods of neutrality. Since June 2024, the policy rate has fallen from 4.75% to the most recent 2.5%, with the outlook shifting once again toward lower rates, in contrast to the neutral stance maintained during the first half of the year.
The Federal Reserve surprised markets with its September decision. For most of 2025, it maintained a neutral stance with rates at 4.5%, making it the only central bank in the region that had not adjusted policy since the December 2024 cut. Now, expectations point to a cycle of steady reductions, bringing the rate down to the new level of 4.25%.
Chart: North American Interest Rates 2024–2025
Source: Tradingeconomics
Given this context, the key question is whether this new lower-rate outlook among North American central banks will hold in the coming months, as this factor could prove decisive for the long-term performance of North American currencies:
- During its September 17 meeting, the Bank of Canada cut the interest rate by 25 basis points, justifying the move on economic weakness, marked by a 1.6% contraction in GDP during the first half of the year and a decline in employment. The bank considers it necessary to maintain short-term economic relief, though it cautioned that future actions will depend on the evolution of inflation in the coming months.
- In its August 8 statement, the Bank of Mexico indicated that future rate cuts would depend on inflation showing lower figures in the short term. It also highlighted that the Mexican economy has not experienced the slowdown projected in early-year forecasts.
- Also, on September 17, the Federal Reserve cut the interest rate by 25 basis points, marking the first reduction of 2025. The move was driven by labor market weakness, leading to the prospect of a cycle of steady cuts. Although inflation remains above the 2% target, the Fed views this as a temporary effect and not an immediate concern.
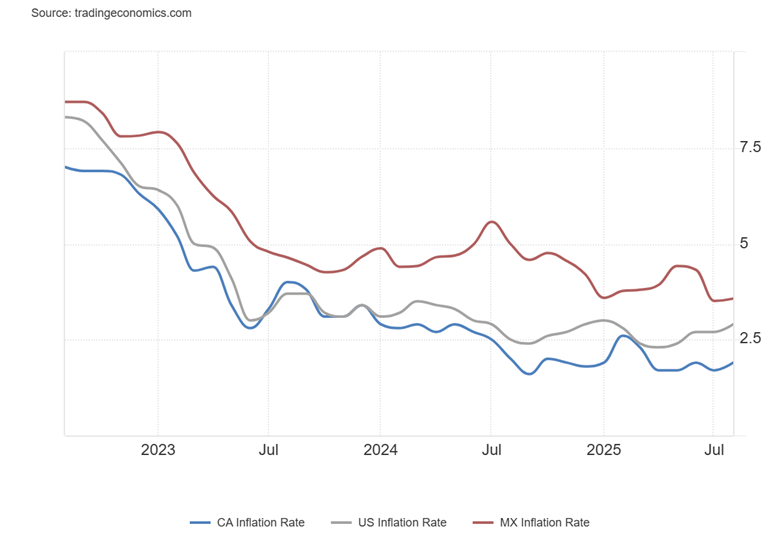
Building on this, it is important to assess how recent inflation data may influence the future dynamics of these central banks. In Canada, inflation rose to 1.9% in August from 1.7% in July, still within the 2% target. In Mexico, it reached 3.57%, exceeding both the 3.51% in July and the 3% target. In the United States, inflation stood at 2.9% in August versus 2.7% in July, still falling short of the 2% goal.
Inflation Trends in North American Countries 2024–2025
Source: Tradingeconomics
Inflation data show steady increases, moving central banks further away from their stated targets. For both the Bank of Mexico and the Bank of Canada, this scenario could weigh on upcoming policy decisions, as both have reiterated the importance of inflation control in the short term. If the consumer price index continues to rise, the outlook for lower rates could become increasingly limited.
In the United States, the outlook differs, as in its latest decision the Fed emphasized employment as the cornerstone of its objectives. Although inflation continues to rise, it is likely that a low interest rate policy will prevail through year-end, unless price increases become significantly more pronounced.
To conclude, shifts in central bank policy could reshape the strength of North American currencies in the long term. The Bank of Mexico, with the region’s highest rate (above 7%), continues to attract interest in the peso as local fixed-income assets remain appealing. For the Bank of Canada, inflation concerns reduce the likelihood of a deep rate-cutting cycle, supporting the Canadian dollar. In contrast, the United States appears most exposed: by not prioritizing inflation, the Fed keeps the door open to further rate cuts, weakening demand for U.S. bonds and the dollar’s attractiveness. This reinforces the view that, unlike Mexico and Canada, the Fed’s dovish stance could keep extending the downward pressure on USD/CAD and USD/MXN through the year.
U.S. Dollar Weakness
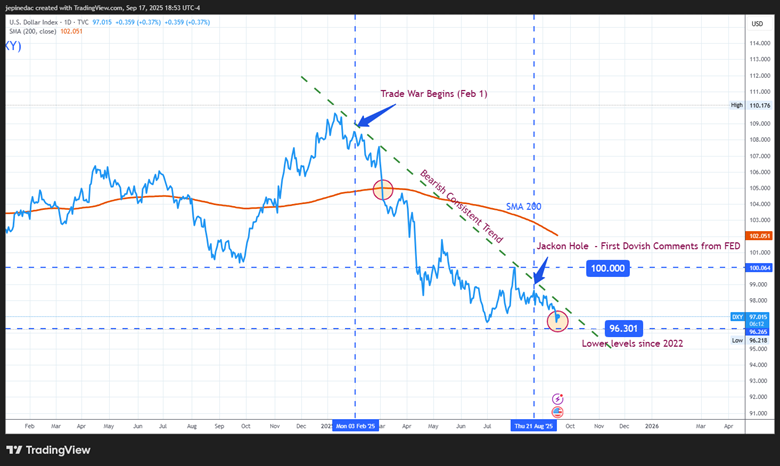
It is important to highlight that U.S. dollar weakness has been a constant throughout much of the year, initially driven by economic uncertainty and the trade war, and more recently by the rate-cut announcements since August. The DXY index reflects this dynamic with a downward trend, falling below 100 points and even reaching 96.5 points, a level not seen since 2022.
Source: TVC, Tradingview
As the dollar’s weakness, driven by the new low-rate policy in the U.S., continues to be reflected in DXY fluctuations, room may open for both the Mexican peso and the Canadian dollar to sustain a steady recovery, reinforcing the dominant selling pressure seen in the USD/MXN and USD/CAD pairs for much of the year. However, the sharp loss of confidence in the US dollar throughout 2025 also suggests that there is less room for prolonged weakness, which could lead to short-term bullish corrections in the movements of both pairs.
Shifts in Trade Policies
Since the beginning of the year, the trade war driven by the United States has forced Mexico and Canada to adopt contingency measures in the absence of favorable agreements. Although negotiations are ongoing, the dispute over the additional tariffs introduced earlier in the year remains unresolved. In this context, Mexico launched a public consultation process to evaluate the free trade agreement with the U.S. and Canada ahead of the 2026 review, with the possibility of considering new trade partners. At the same time, it has proposed raising tariffs on more than 1,400 products from countries without free trade agreements, such as China, in an effort to boost domestic production and local consumption.
Canada is also advancing its trade policies with the “Buy Canadian” initiative launched in September by the prime minister. The measure aims to strengthen domestic production and local consumption amid the risk of declining exports to the U.S. market. In addition, Canada is considering new trade agreements with partners in Asia to help sustain economic activity in the short term.
In addition to these measures, both countries agreed to strengthen their trade ties following the Canadian prime minister’s visit to Mexico on September 18. The discussions highlighted the need for more direct trade relations as a strategy to confront the tariffs stemming from the ongoing conflict. It was also noted that bilateral trade is already showing a growing trend, with $56 billion recorded in 2024, and the central goal is to significantly increase that figure by 2026.
If effective, the economic diversification measures in Mexico and Canada could reduce their dependence on the U.S. and build greater confidence in their currencies over the long term. Currently, the main perceived risk is the potential loss of economic growth stemming from ongoing trade disputes. As protectionist policies and new trade agreements materialize, the perception of economic weakness could ease, strengthening currency confidence. In this scenario, a stronger selling pressure on the USD/CAD and USD/MXN pairs could take hold, provided these measures prove effective.
USD/CAD Outlook
Source: StoneX, Tradingview
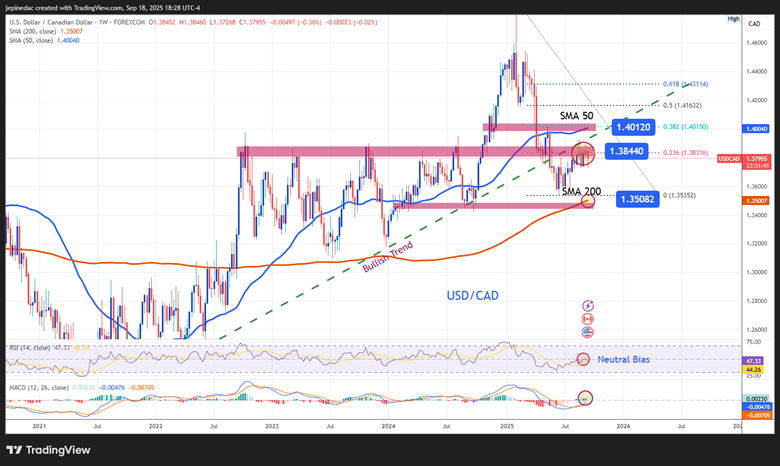
- Long-Term Uptrend Breaks: Since May 2021, the USD/CAD had maintained an upward trend, but in recent months it has started to weaken due to the bearish momentum that has dominated throughout the year. This pressure led to a break of the bullish structure in late May, which had previously remained in steady formation. The subsequent upward correction following that break has not been strong enough to revive the prior trend; therefore, in the broader picture, a potential downward move remains the dominant scenario, laying the groundwork for a more significant bearish trend. As selling pressure continues to build through the rest of the year, this could become the key technical formation to watch.
-
- RSI: The RSI line continues to show slight oscillations below the neutral 50 level, indicating that the balance between buying and selling momentum in the market remains relatively stable. If this behavior persists, directional moves are unlikely to be strong enough to establish a clear short-term trend.
-
- MACD: A similar picture is seen in the MACD indicator, where oscillations remain slightly above the zero line, suggesting that no dominant momentum has yet emerged in the moving averages. If this behavior continues, the price is likely to maintain a neutral pattern before establishing a more significant directional move.
-
- 1.40120: Key resistance lies in the area marked by the 38.2% Fibonacci retracement, which coincides with the 50-period moving average. A potential bullish move that manages to reach this level could reignite the long-term buying trend, which for now has taken a back seat.
-
- 1.38440: The current barrier is located near the 23.6% Fibonacci retracement level. As long as price oscillations remain below this area, a persistent bearish bias could be reinforced, gaining greater significance in the long term.
-
- 1.35082: The key support is located at the area marked by the 200-period simple moving average. If price oscillations fall below this level, it would signal a structural shift that could confirm the development of a more sustained bearish trend on the chart.
USD/MXN Outlook
Source: StoneX, Tradingview
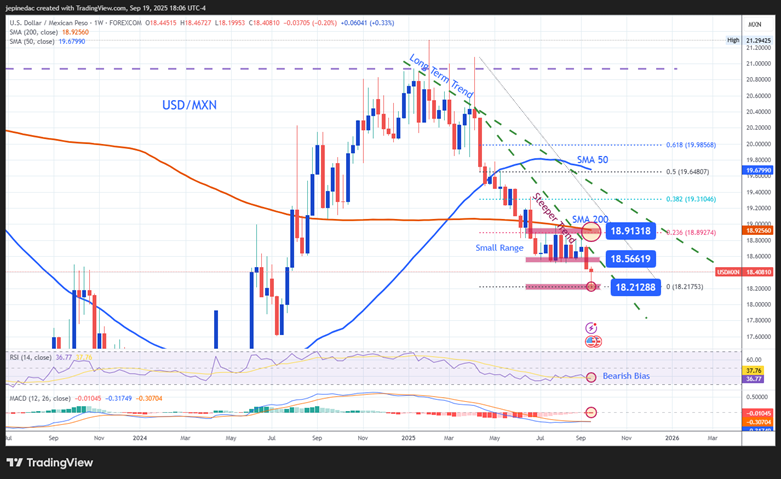
- Long-Term Downtrend: Since early January, the USD/MXN has shown a consistent downtrend, which intensified at the start of April, when the move became steeper and began registering increasingly lower lows, reflecting the Mexican peso’s dominance over the U.S. dollar. Although there have been recurring bullish corrections, no clear buying momentum has emerged, confirming that the long-term bearish trend remains the most relevant technical structure. In this scenario, if selling pressure persists, the downtrend is likely to continue consolidating a clear bearish path over the long term.
-
- RSI: The RSI line continues to oscillate consistently below the neutral 50 level, confirming the dominance of bearish momentum in the market. With no clear oversold signals indicating a potential price imbalance, the room for sustained bullish corrections remains limited.
-
- MACD: The MACD indicator, meanwhile, shows a histogram oscillating very close to the zero line, indicating that the average momentum of the moving averages has yet to establish a clear directional move. If this behavior continues, it could serve as a warning signal of potential persistent neutrality in long-term price movements.
-
- 18.91: The key resistance lies in the area where the 200-period moving average converges with the 23.6% Fibonacci retracement, making it the critical level for a potential sustained bullish push. If upward oscillations manage to break through this barrier, it would signal a shift in momentum within the technical structure, putting the prevailing steep downtrend at risk.
-
- 18.50: The nearby resistance corresponds to a neutral level observed in recent months, which may act as a consistent barrier to bullish moves in the short term. As long as the price remains consistently below this level, the current bearish bias is likely to remain dominant over the long term.
-
- 18.20: The final support zone corresponds to the year’s low and serves as the key barrier for downward moves. This level could act as a starting point for bullish corrections; however, if bearish oscillations fall below this price, it would confirm a more solid downtrend heading into the final months of the year, with a fully dominant bearish bias.
Written by Julian Pineda, CFA – Market Analyst
Follow Him: @julianpineda25