

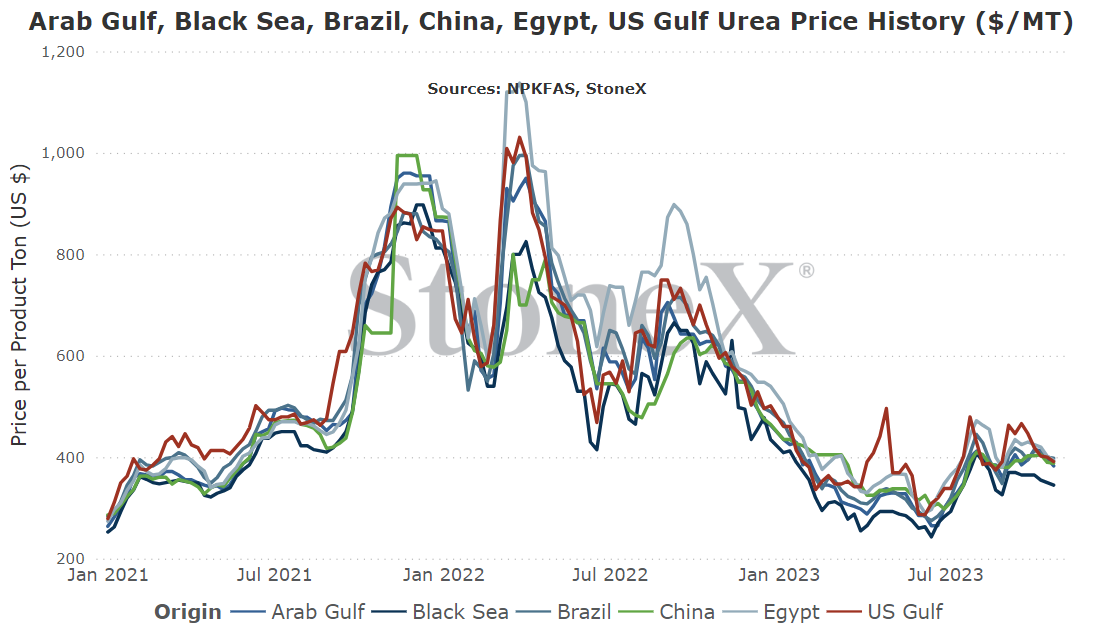
The intention of the below graphs are not to use to say "my price should be X based on this graph". These prices are derived from an FOB price point average. The intent is to show major global price movement trends. Your values will likely have significant basis difference (similar to your local grain price being different than the traded market price).
This graph is labeled as MT in USD currency.
While the fertilizer futures market is far from as liquid as its grain counterparts, it is still active and gives us an insight into what the market is thinking.
Please note that the values below can and will change daily. This is merely a look at where they are as of writing:
| NOLA Urea | Middle East Urea | CFR Brazil Urea | |
| November | $358 | $380 | $395 |
| December | $358 | $380 | $395 |
| January | $363 | - | $395 |
| February | $363 | - | - |
| March | $363 | - | - |
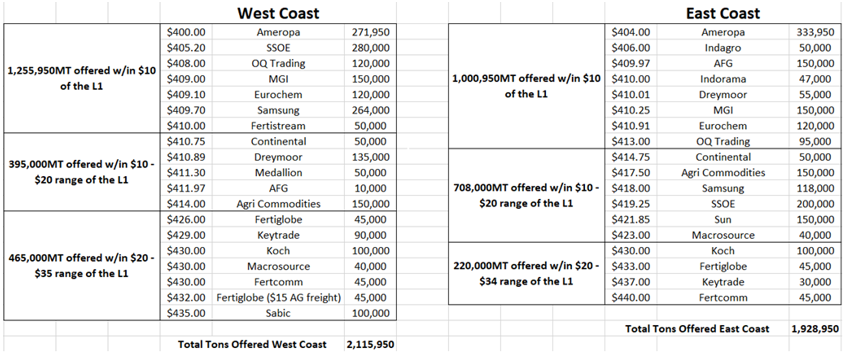
- Right around 4MMT were offered - this was a big quantity of tons offered. Quickly, many in the market started to theorize that India could end up with 1.8 - 2.0MMT secured in this tender.
- Price spreads were narrowed - in recent tenders, we have come to expect very wide price offers. Wide enough that it got tough to figure out where to do the "break out's" like is done below. This tender saw the price gap at only $35 and the east coast at $36. Again, this pushed the theory that India could/would get all they want and then some.
Just as the world got comfortable with the idea that they were going to lock up a lot of product, we found out that they "only" secured 1.15MMT in the first round of counterbids. It was surprising and the bull's tried to rally the market. In the end, it was premature. India counterbid all remaining offers and ended up at 1.65MMT. It was better than original expectations but less than revised/higher tonnage thoughts.
For those wondering, it does not appear that China is playing a large part as they have only been linked to around 4 - 5 vessels.
The global urea market has been VERY quiet following the conclusion. From my POV, I think folks are struggling with what happens next. This number of tons purchased should mean that India is content for much of 2023. There are still north of 2MMT that will be looking for homes and frankly, I struggle with any region really stepping up to buy before New Years (unless prices drop to attractive levels). For all the excitement and twists and turns of this tender, the result has been pretty mundane.
Given the last few years, that's a good thing!

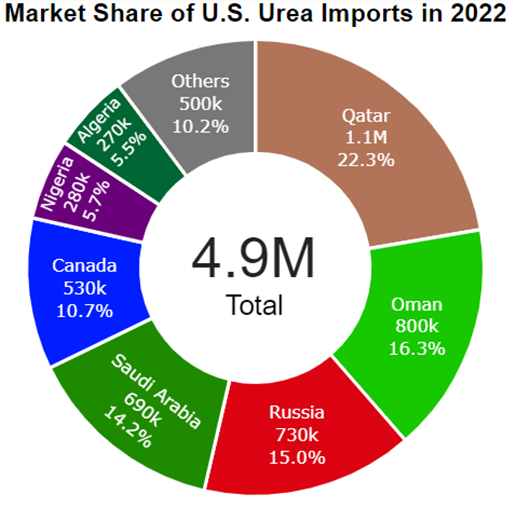
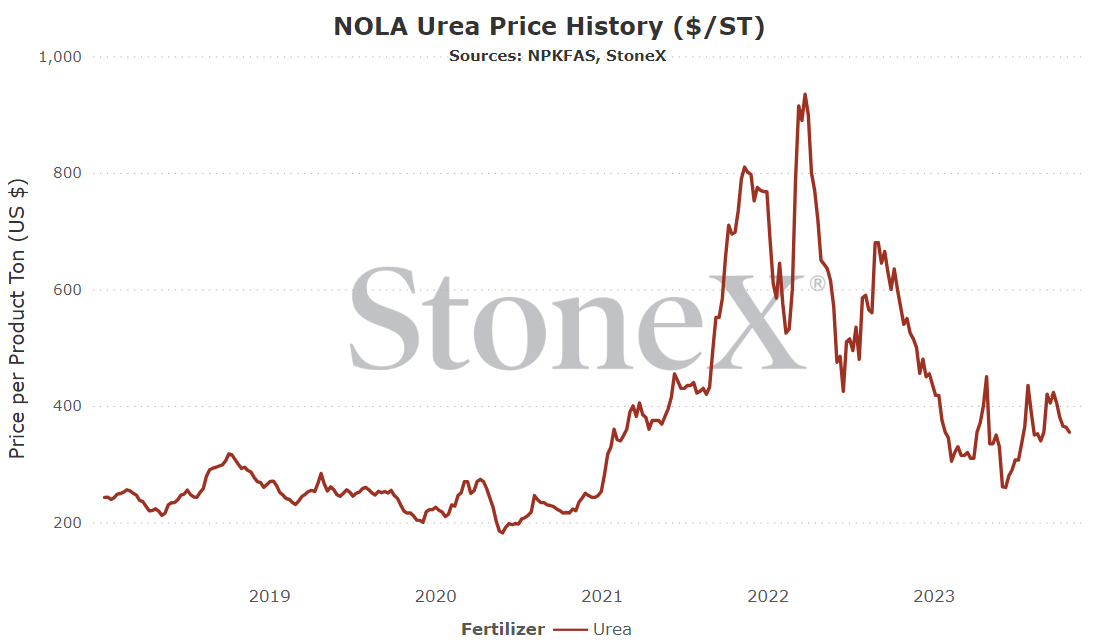
NOLA/New Orleans, Louisiana
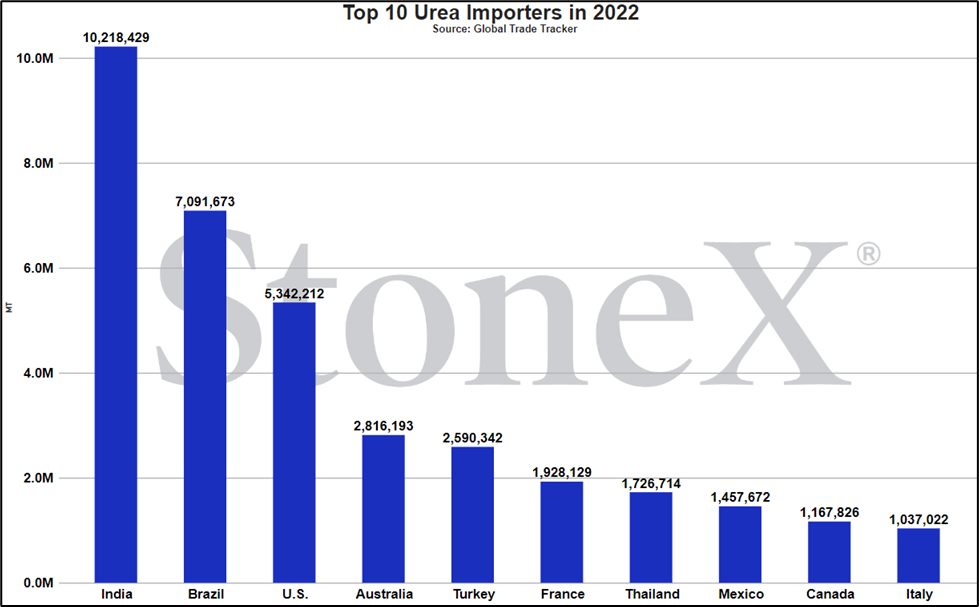
Number 3 global importer in 2022
Price comparisons
Vs 30 days ago - -12% or approximately $50 lower
Vs 90 days ago - -18% or approximately $80 lower
Vs 6 months ago - -21% or approximately $95 lower
Vs 1 year ago - -34% or approximately $185 lower
U.S. Midwest Average
Vs 30 days ago - -4% or approximately $21 lower
Vs 90 days ago - -5% or approximately $24 lower
Vs 6 months ago - -5% or approximately $26 lower
Vs 1 year ago - -27% or approximately $169 lower
U.S. Southern Plains Average
Vs 30 days ago - -8% or approximately $40 lower
Vs 90 days ago - -4% or approximately $20 lower
Vs 6 months ago - -6% or approximately $30 lower
Vs 1 year ago - -27% or approximately $170 lower
U.S. Northern Plains Average
Vs 30 days ago - -4% or approximately $18 lower
Vs 90 days ago - -4% or approximately $21 lower
Vs 6 months ago - -8% or approximately $39 lower
Vs 1 year ago - -32% or approximately $211 lower
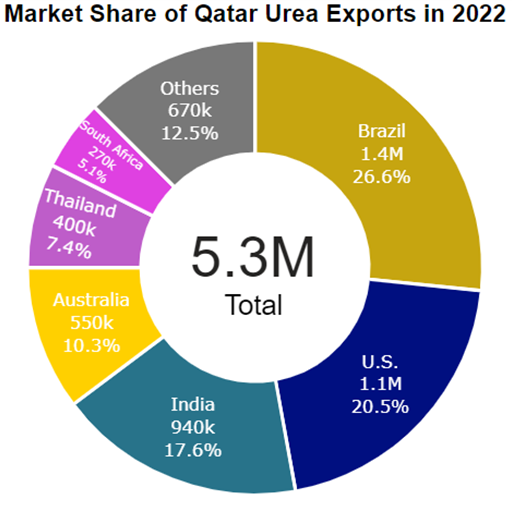
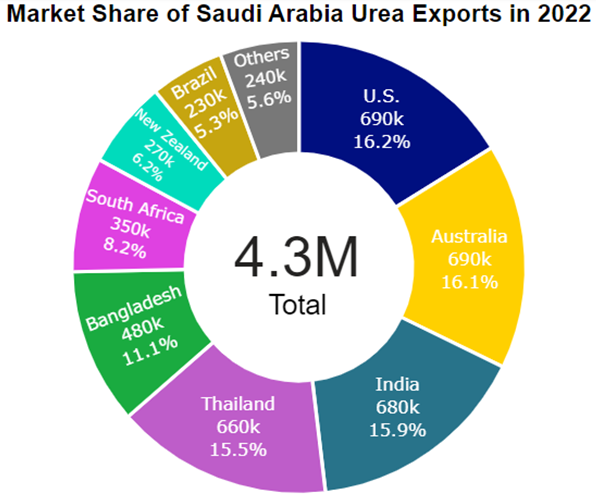
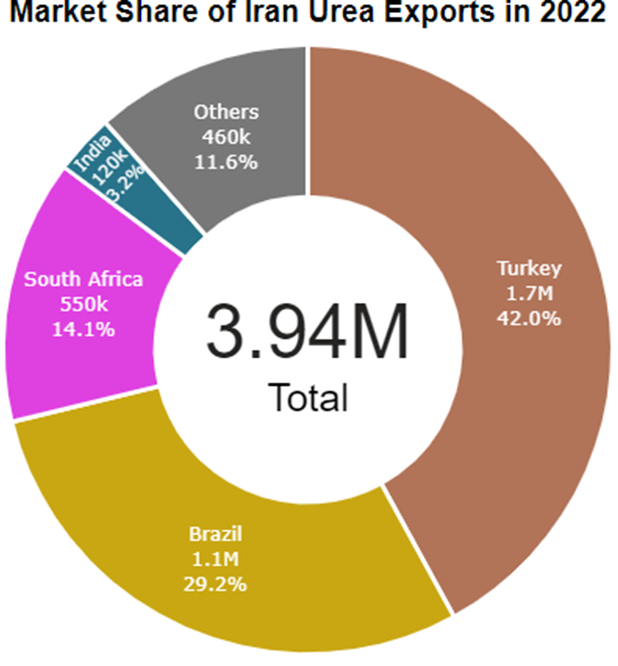
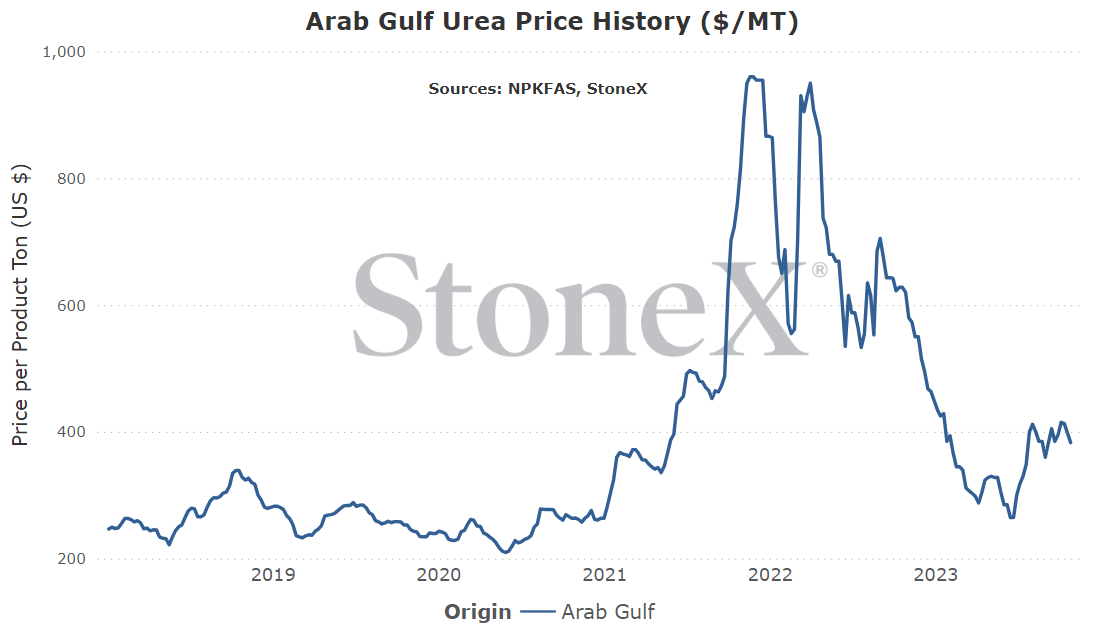
Middle East
Number 1 exporter (as a region, not as individual nations)
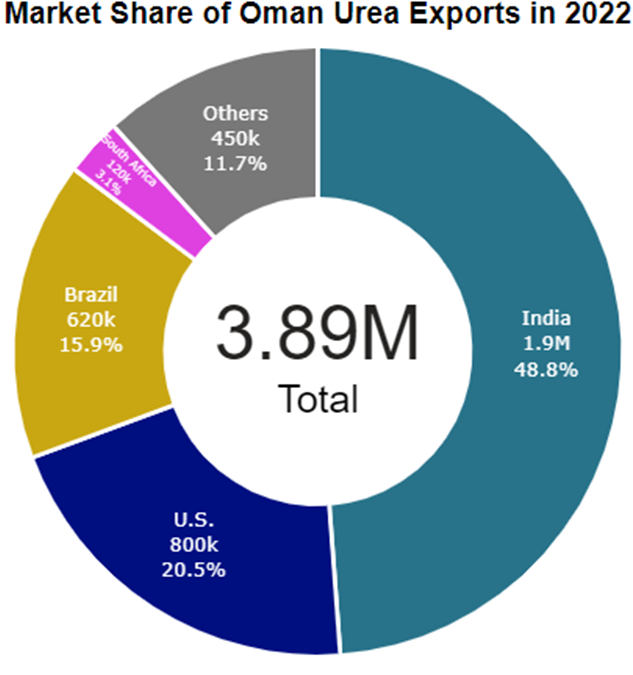
Vs 30 days ago - -3% or approximately $12 lower
Vs 90 days ago - -4% or approximately $17 lower
Vs 6 months ago - +17% or approximately $56 higher
Vs 1 year ago - -38% or approximately $237 lower
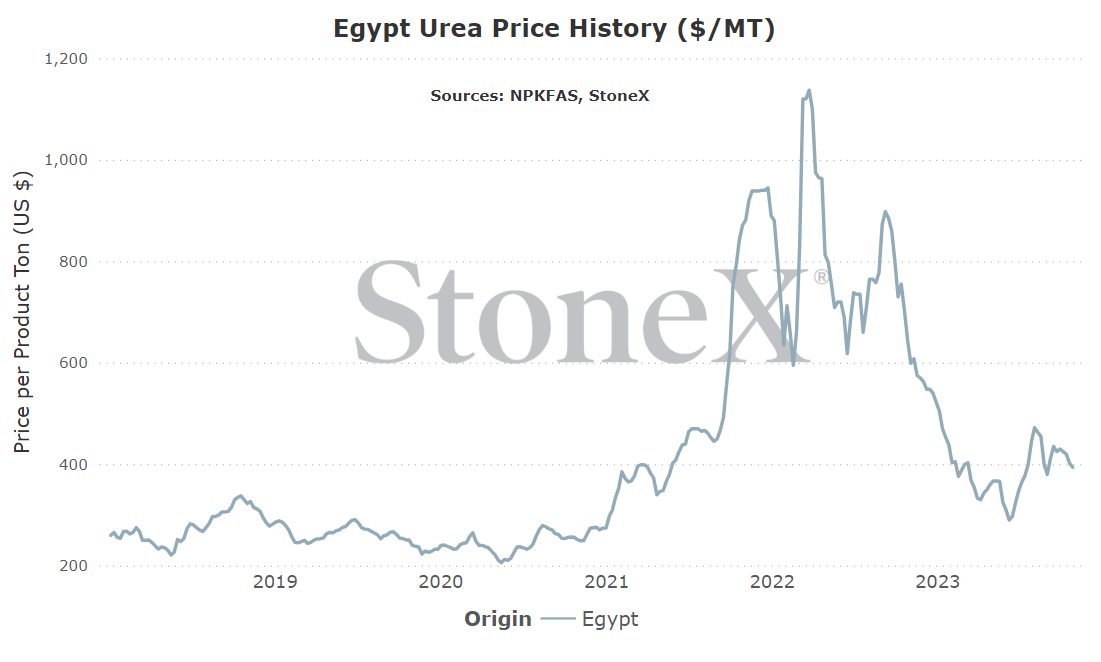
Egypt
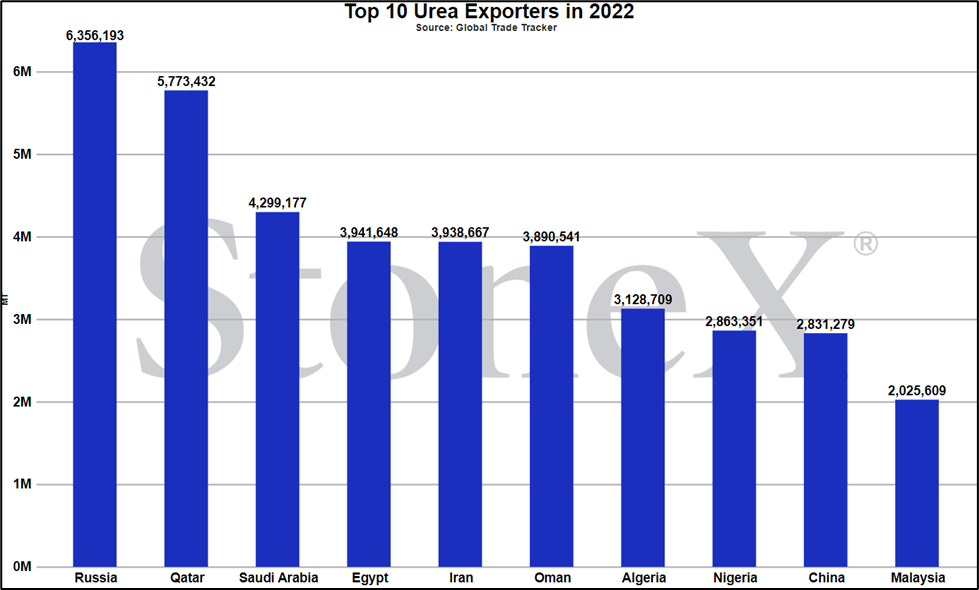
Number 4 global exporter in 2022
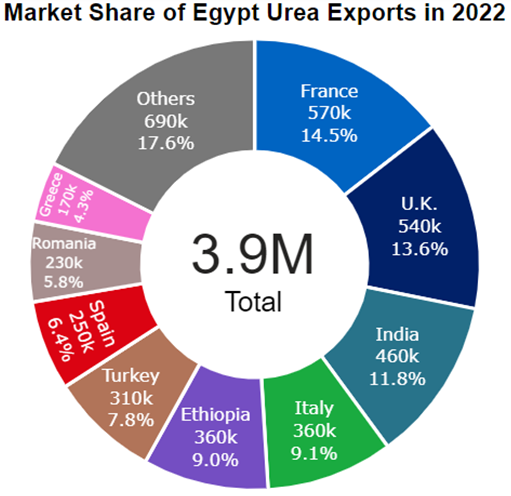
Price comparisons
Vs 30 days ago - -8% or approximately $36 lower
Vs 90 days ago - -11% or approximately $50 lower
Vs 6 months ago - +9% or approximately $34 higher
Vs 1 year ago - -39% or approximately $251 lower
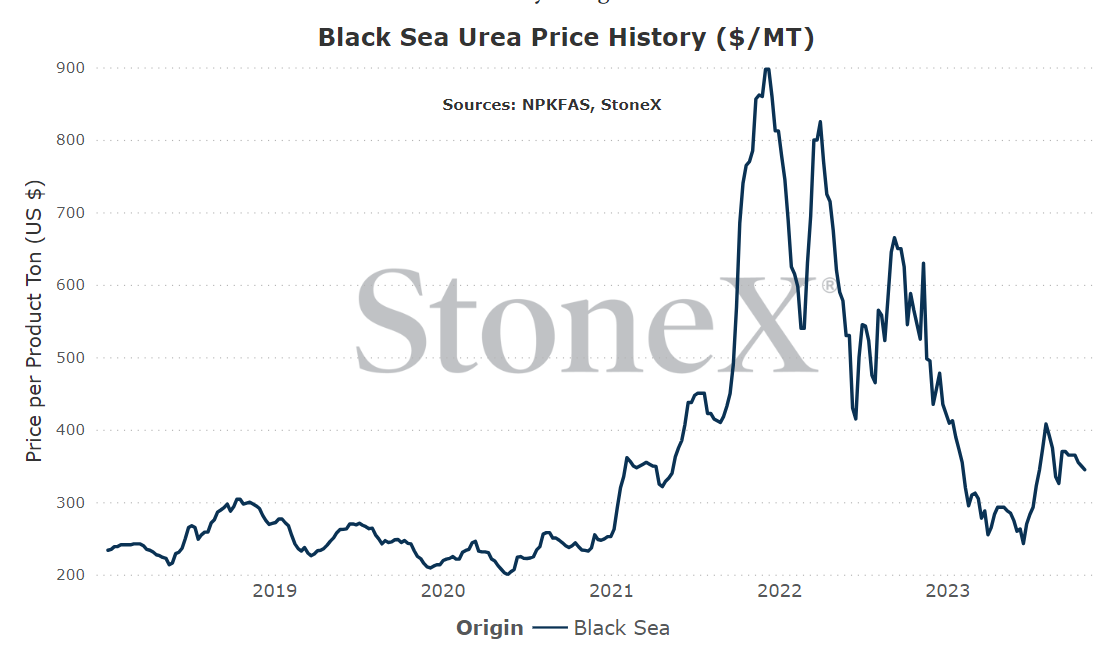
Black Sea
Number 1 global exporter in 2022
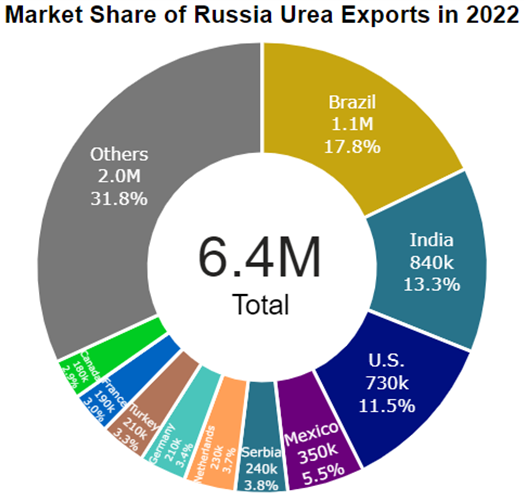
Price comparisons
Vs 30 days ago - -5% or approximately $20 lower
Vs 90 days ago - -8% or approximately $30 lower
Vs 6 months ago - +18% or approximately $53 higher
Vs 1 year ago - -37% or approximately $200 lower
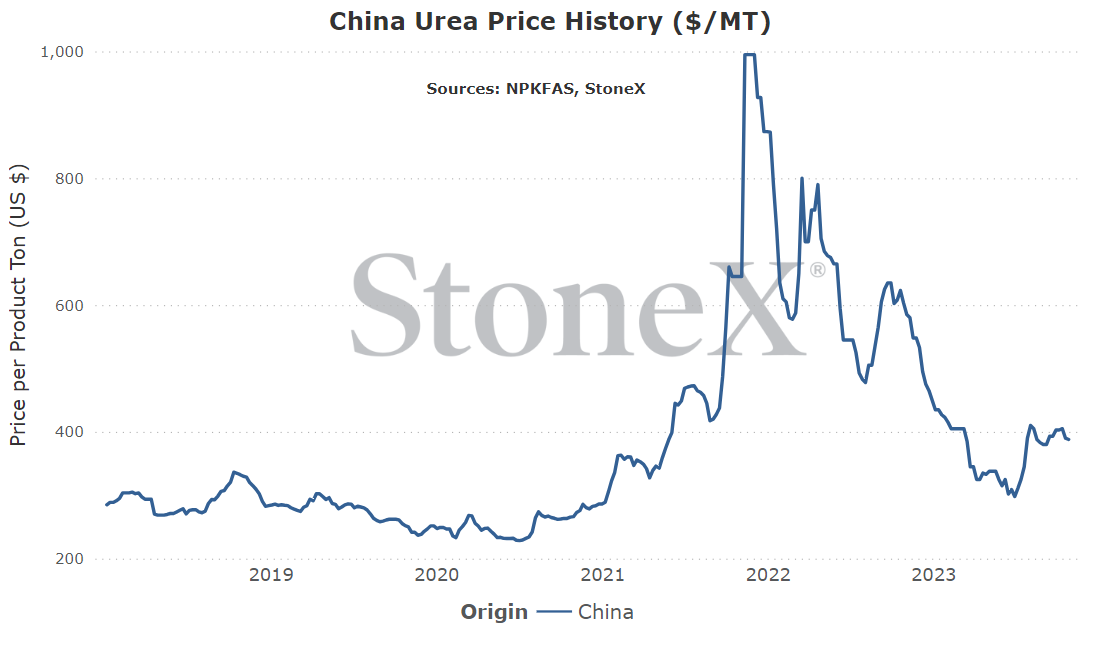
China
Number 9 global exporter in 2022
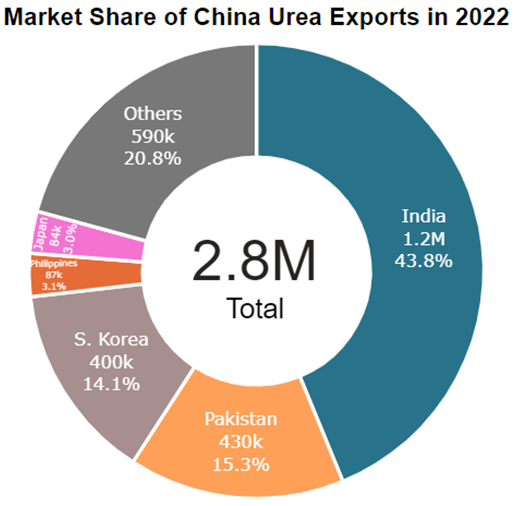
Price comparisons
Vs 30 days ago - -4% or approximately $15 lower
Vs 90 days ago - -1% or approximately $3 lower
Vs 6 months ago - +17% or approximately $55 higher
Vs 1 year ago - -36% or approximately $215 lower
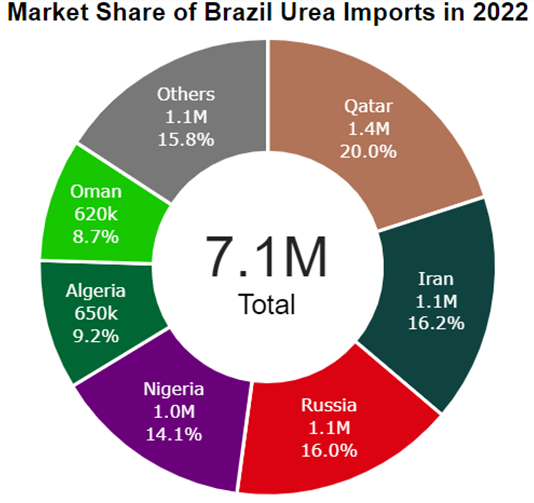
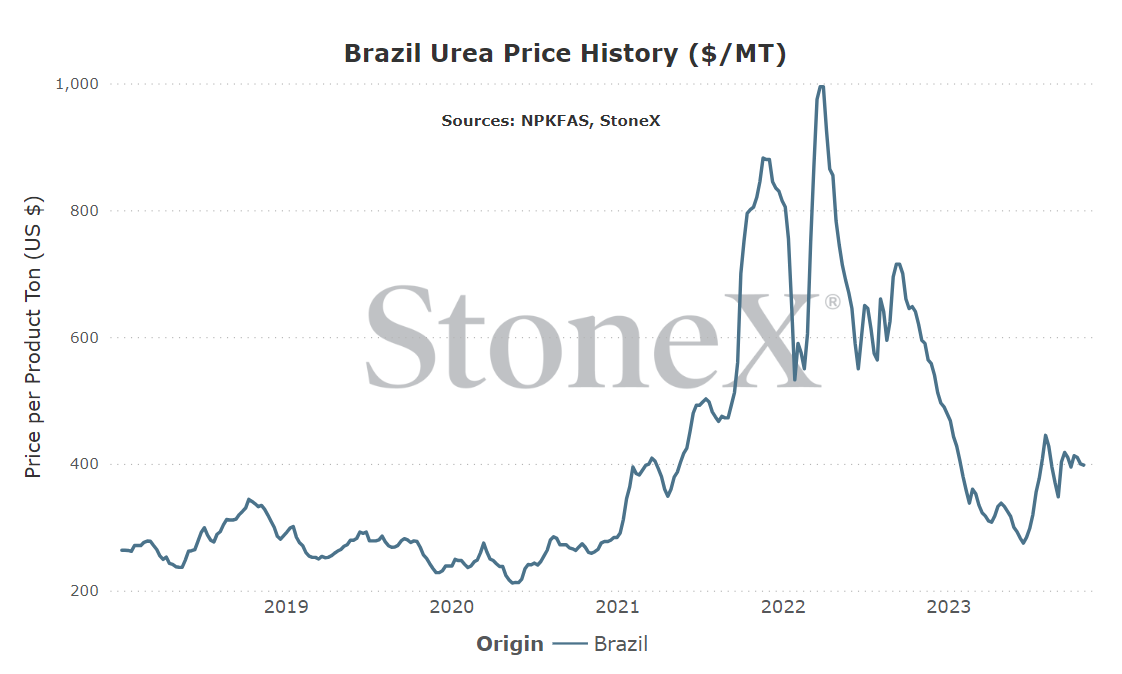
Brazil
Number 2 global importer in 2022
Price comparisons
Vs 30 days ago - +1% or approximately $3 higher
Vs 90 days ago - -2% or approximately $10 lower
Vs 6 months ago - +18% or approximately $60 higher
Vs 1 year ago --36% or approximately $223 lower
- Global energy markets are on edge with Israel/Palestine war - today's world seems to be on the brink of World War 3. Any entrance of any other country outside of Israel/Palestine could create a daisy chain of events that we would struggle to slow or stop. As long as this fear is felt, global energy prices are going to remain elevated which is going to impact nitrogen as a whole.
- Downside price potential seems limited before demand steps in - this is a weird one because I am still leaning bearish on the short term price outlook...but I am not expecting a ton of downside price risk. It sounds as though we are not far off from a significant part of the market stepping in to take a layer. If that happens, it will buoy price ideas quickly.
- India couldn't hit their 1.5MMT goal in the first round of counter bids - whether I am surprised by this or not (I am, by the way) does not matter. They failed to secure their needed volume on the first round of counterbids. That is likely to embolden price ideas of the remaining offers.
- After India wraps up purchases, who else in the world wants to buy? - if India is able to secure their needed tonnage, my immediate question becomes "who is the global leading buyer?". I could see buyers attempting to push product away by lowering their values. It could/would create a very quiet period where prices struggle to hold. Interest rates start chewing into price ideas. It would be a recipe for lower values.
- N.A. river logistic issues/high interest costs are keeping buyers at bay - adding to the "who in the world wants to buy following India", I give you N.A. who is struggling to move product. Low water levels on the Lower Mississippi River means a much higher chance that product sits in a barge incurring interest and demurrage costs. Yet another reason to stay away, so to speak.
- Chinese production rates remain high which means they either export now or export much more heavily later - on the recent India tender, it appears that China did not participate. That means a missed opportunity in selling a large block of tons in one move. At the same time that exports are not occurring, we continue to hear that production rates remain high. That comb would mean that if they remain disengaged from the export market, they will fill domestic storage rather quickly and then be forced to export at a denser pace than if they had started now.
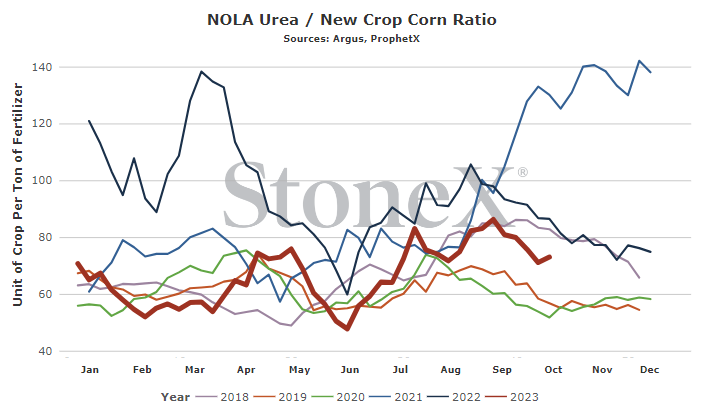
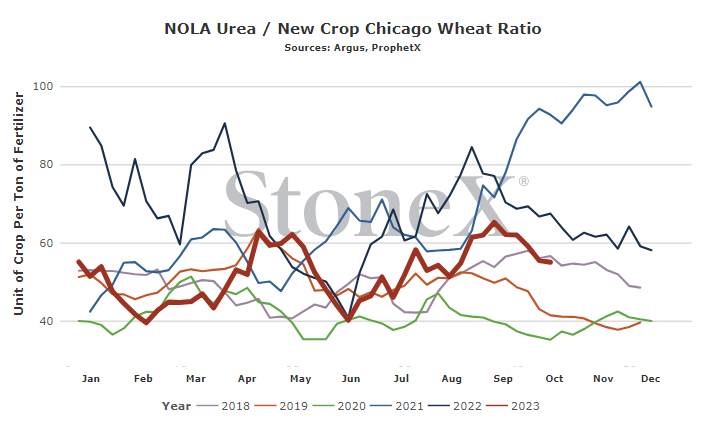
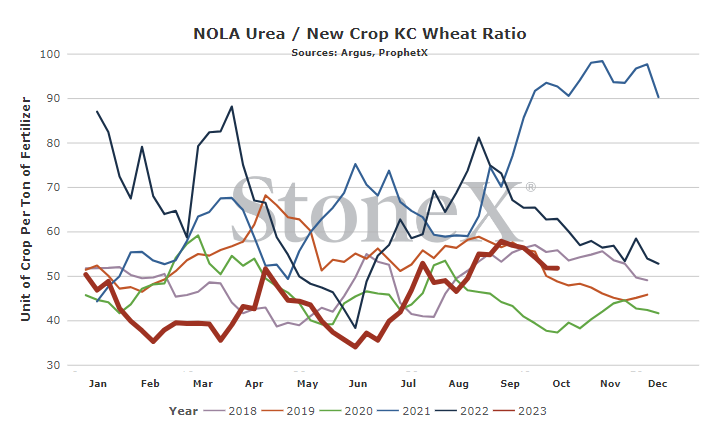
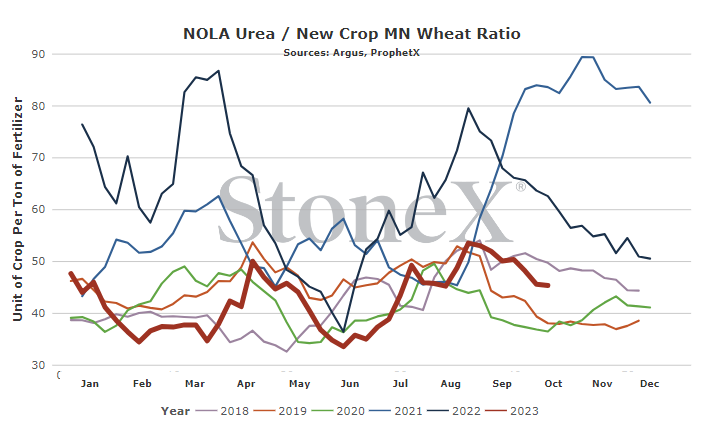
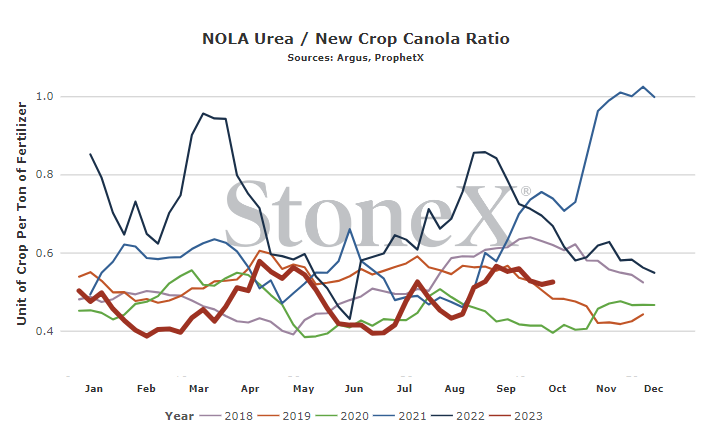
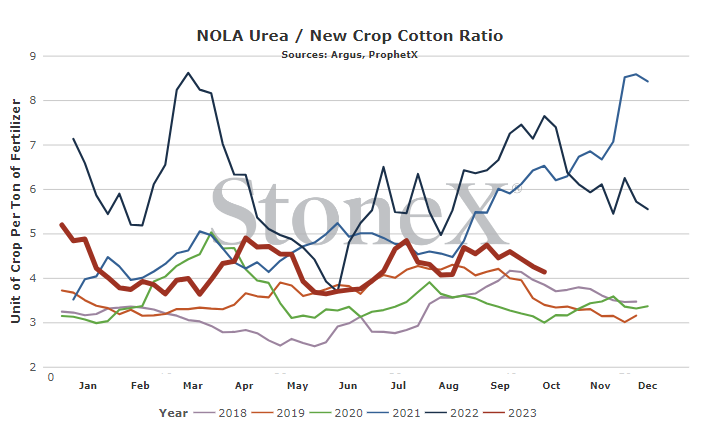
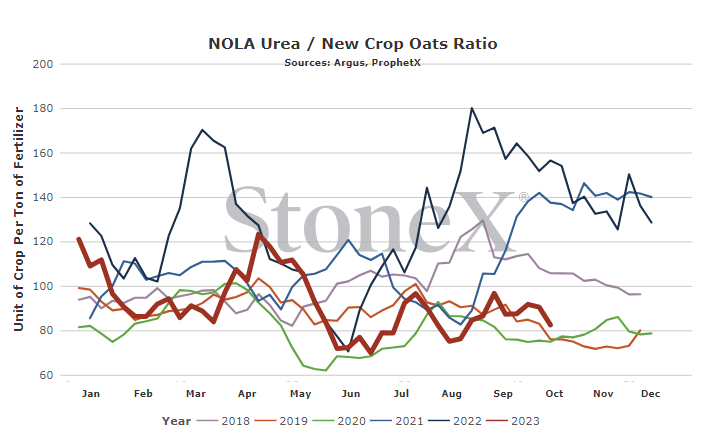
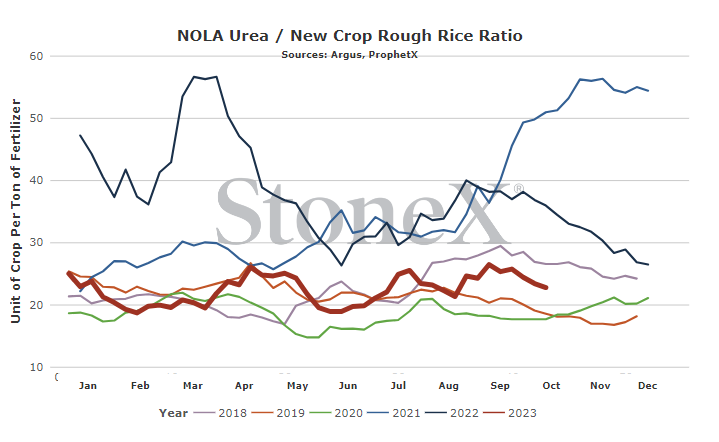
We believe that only looking at the flat price of either grains or fertilizer can be misleading:
- Only selling grain can hurt you if fertilizer prices rise substantially
- Only buying fertilizer can hurt you if grain prices fall
We look at the ratio "value" to get a better indication of where we are or how many bushels of X does it take to pay for 1 ton of fertilizer.
Would you rather:
- Spend 135 bushels to pay for 1 ton of urea
- Spend 55 bushels to pay for 1 ton of urea
When we compare the current ratio value against recent years, we start to see if we are high or low.
YOUR VALUES WILL LOOK DIFFERENT
This graph looks at the NOLA urea price vs the flat grain price. There are no logistics on either product. Your location will look different due to fertilizer logistical costs, grain basis, etc.
- Middle East region - the Middle East region continues to appear on the brink of a regionalized conflict...if not worse. If other countries start to enter the Israel/Palestine war, then a lot of global urea exports become a higher risk of being removed from the market. Consider this the current biggest "low probability/high impact" situation for the market.
- Chinese exports - will they export or will they not? For the short term, that answer can sway the market. However, eventually they may not have a choice. If production rates within China remain high and exports are not allowed, it means that Chinese storage facilities will be filled very quickly...turning China into an even larger/more potent exporter in the near future.
- European natural gas markets - there remains a much higher correlation between Dutch TTF values and global urea values. Today, Dutch TTF values have remained relatively stagnant. Not so high that anything is turning off but not so low that more production resumes. It remains in the middle ground...for now.
- N.A. logistics/basis - the Lower Mississippi River continues to struggle with low water levels which is hampering barge traffic. It slows down transit. It lowers the number of barges per tow. It lowers the number of tons per barge. Effectively, it drives the cost to move product up the river significantly higher. Just because NOLA values fall does not mean inland values need to fall as well. Hopefully, the river situation improves...but hope is not a strategy...
All data was sourced from StoneX unless otherwise noted.
This material should be construed as market commentary, merely observing economic, political and/or market conditions, and not intended to refer to any particular trading strategy, promotional element or quality of service provided by the FCM Division of StoneX Financial Inc. (“SFI”), StoneX Financial (Canada) Inc. (“SFFC”) or StoneX Markets LLC (“SXM”). SFI, SFFC and SXM are not responsible for any redistribution of this material by third parties, or any trading decisions taken by persons not intended to view this material. Information contained herein was obtained from sources believed to be reliable, but is not guaranteed as to its accuracy. Contact designated personnel from SFI, SFFC or SXM for specific trading advice to meet your trading preferences. These materials represent the opinions and viewpoints of the author, and do not necessarily reflect the viewpoints and trading strategies employed by SFI, SFFC or SXM. The FCM Division of StoneX Financial Inc., a subsidiary of StoneX Group Inc., is a member of the National Futures Association (“NFA”) and registered with the U.S. Commodity Futures Trading Commission (“CFTC”) as a futures commission merchant and commodity trading advisor. StoneX Financial (Canada) Inc. is currently registered as a Futures Commission Merchant or equivalent in all provinces of Canada and is a member of the Investment Industry Regulatory Organization of Canada.




