StoneX logo

November '24 Aussie Farmer Fertilizer Focus - UAN

By: Josh Linville, Vice President- Fertilizer

November '24 UAN (28% / 32%)
 
Josh Linville
Vice President - Fertilizer
StoneX Financial Inc. - FCM Division
Major global UAN export location price graph

The intention of the below graphs are not to use to say "my price should be X based on this graph".  These prices are derived from an FOB price point average.  The intent is to show major global price movement trends.  Your values will likely have significant basis difference (similar to your local grain price being different than the traded market price).

This graph is labeled as MT in USD currency.
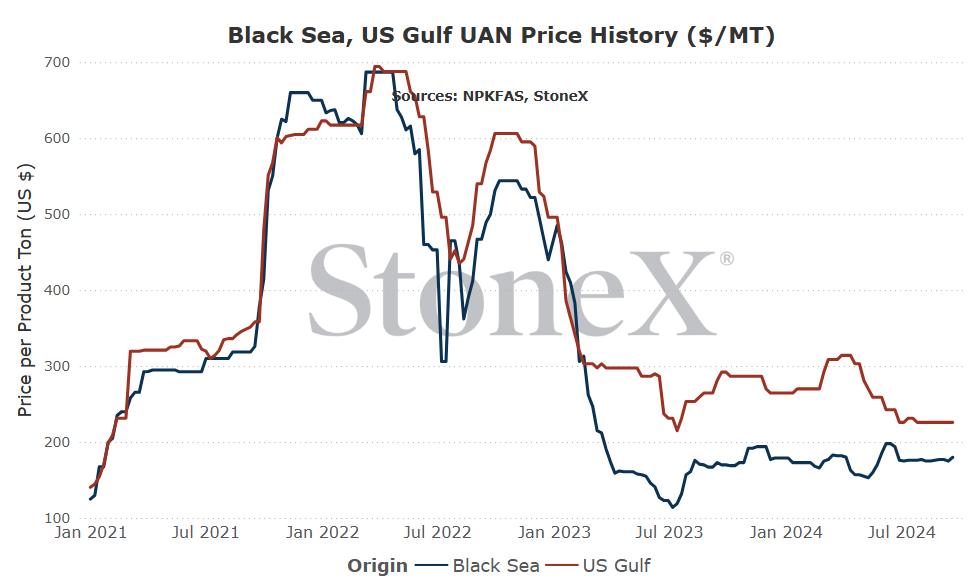
image-20241028221537-1

What everyone wants to know first, what do we think will happen going forward
GLOBAL

The world is still having to deal with production losses in Trinidad and in the EU.  While it looks like Trinidad production issues have been figured out short term, we also know how quickly they can come back.  The EU looks like it is going to be a very long term situation.  Enough so that we are starting to wonder if we ever see production back to its "normal" 100% rate.

However, there just isn't a lot of excitement in the UAN realm.  Spring is still a little ways away and most farmers are not looking at fantastic economics.

Short term, it feels like we are going to remain relatively flat...however, that should chance when spring demand starts to step forward.  Also, if we are right on urea and those values start moving higher, do not be surprised to see UAN follow.  

AUSTRALIA

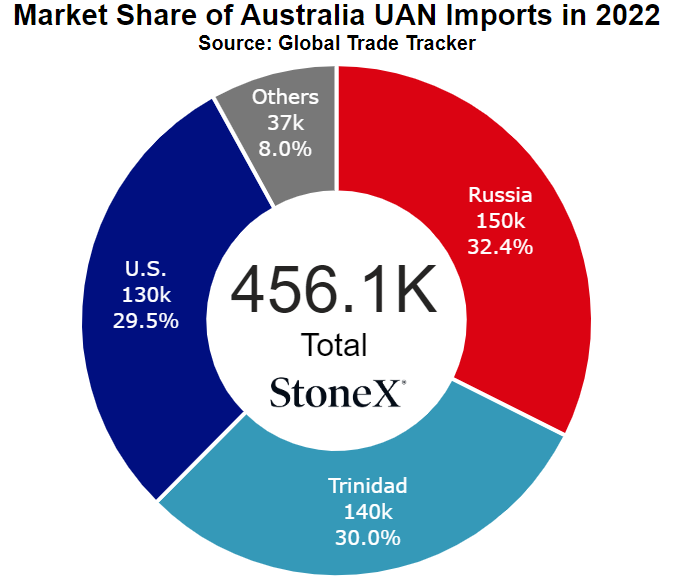
**given Australia's reliance on U.S. UAN supplies, it makes sense that what happens in the U.S. happens to Australia.  That said, I am copying the U.S. outlook and placing it here.  No need to reinvent the wheel**

N.A. UAN is in an interesting spot.  On the one hand, manufacturers seem very well sold with little need to make sales near term.  On the other hand, farmers/buyers could care less today.  Sure, a lot of reports are coming back that yields are better than expected and grain prices have improved from where they were...but that does not mean that farm economics are in a good place today.  Basically, the market is in a stalemate.  It is a stalemate that I think the sellers eventually win, but that doesn't change today.

We are leaning bullish on urea, we are bullish on overall nitrogen demand and the start of the fall NH3 season is not great (dry conditions).  Near term, prices should remain relatively flat but when they break, I think it will be to the higher side.
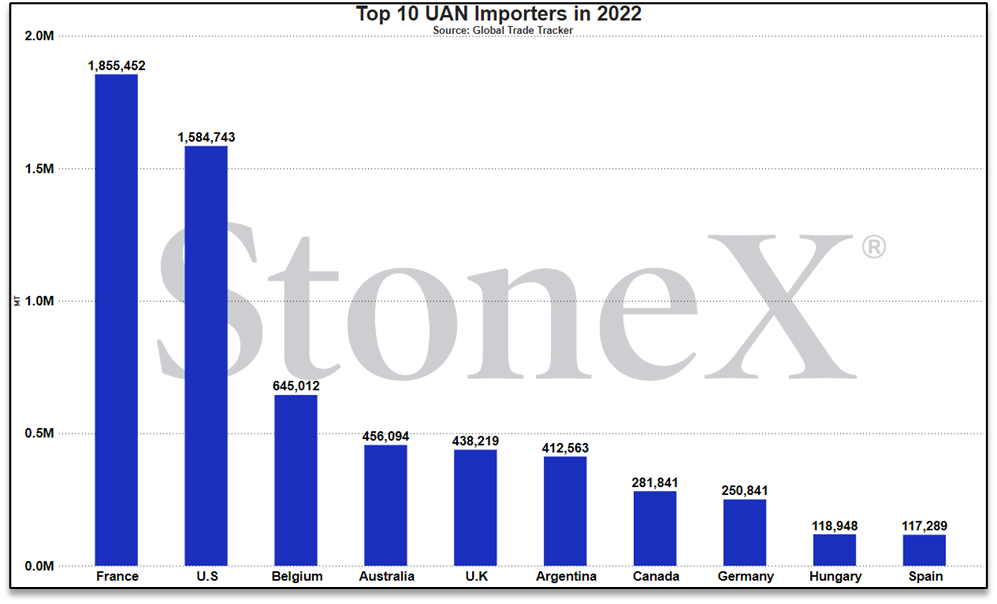
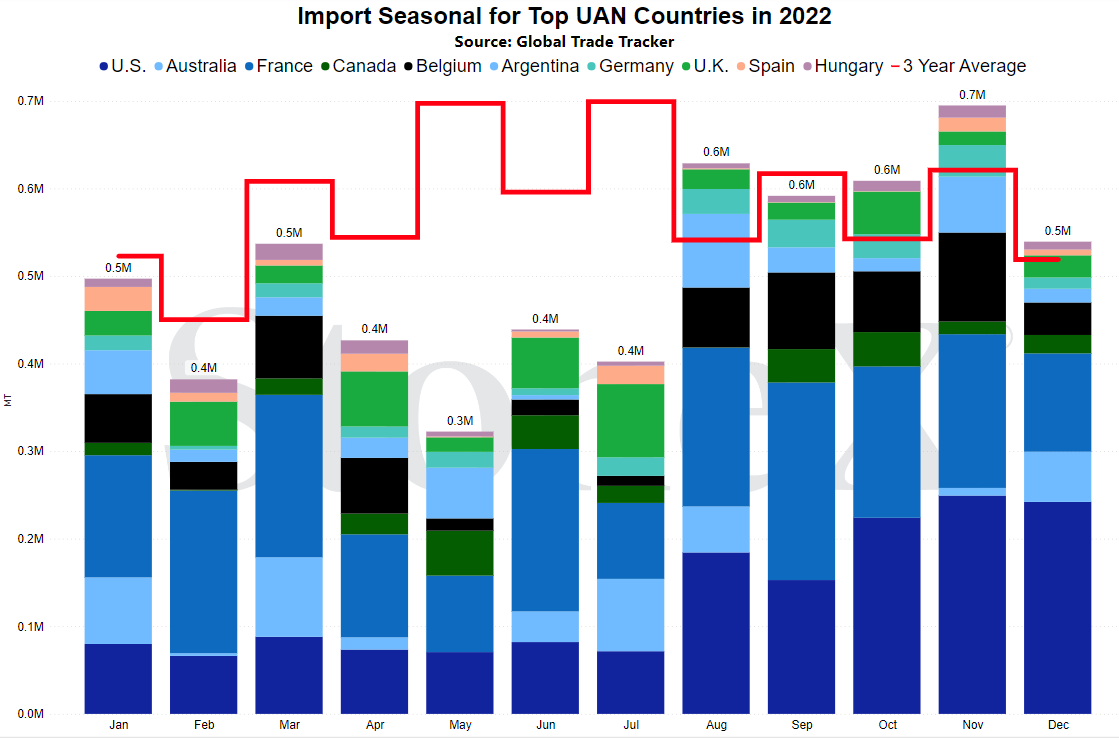
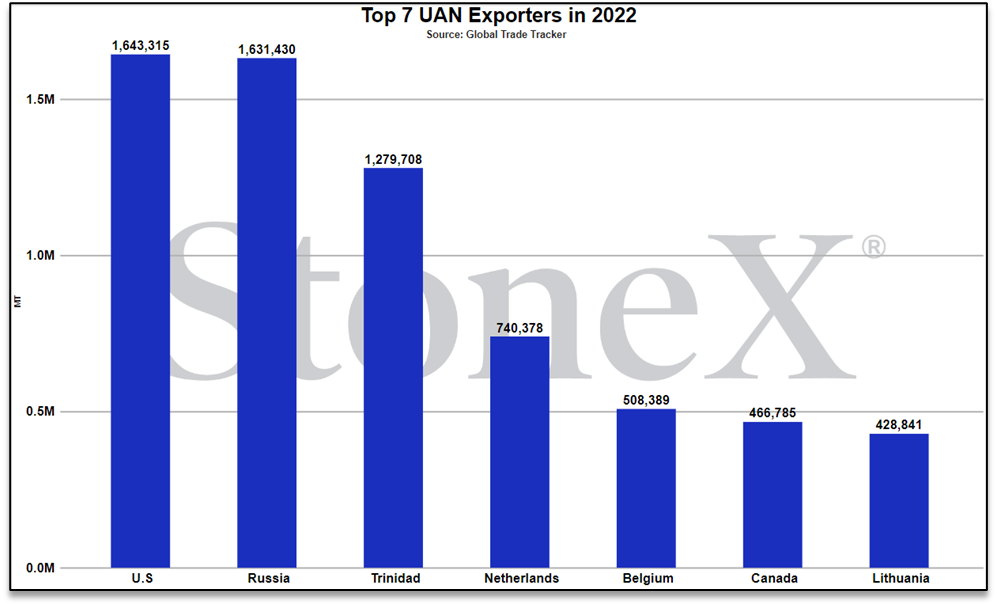
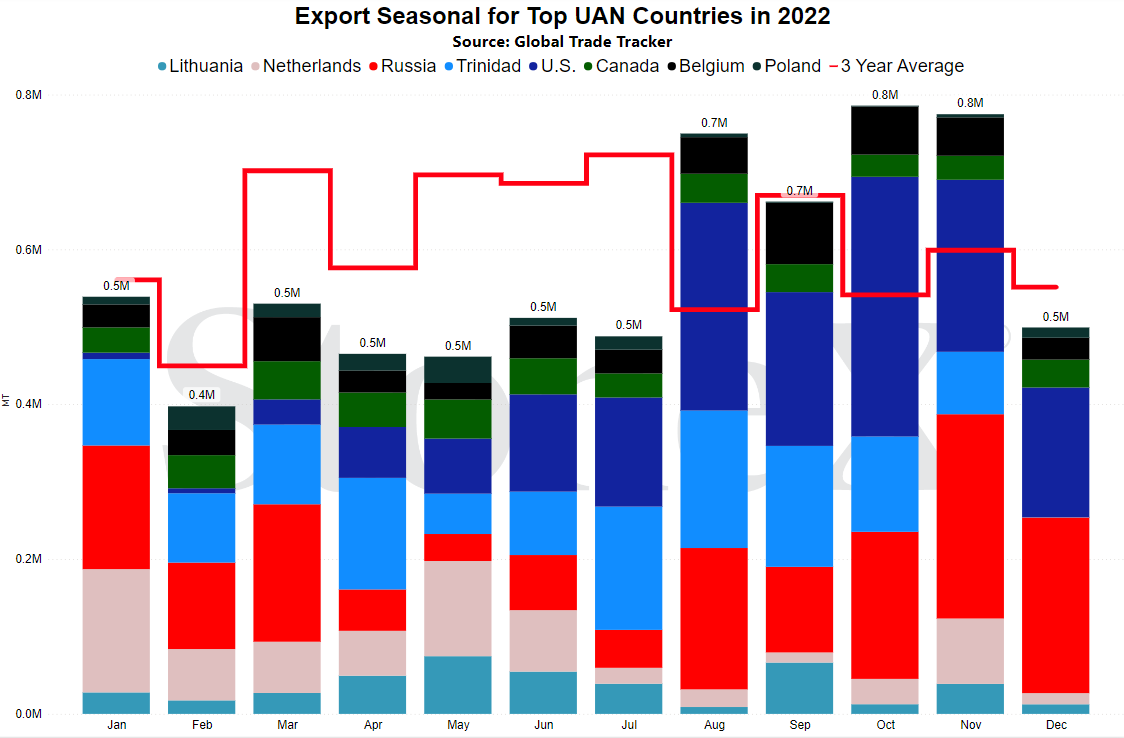
General global import/export UAN information
image 73019
image-20231108145745-1
image 73021
image-20231108145801-2
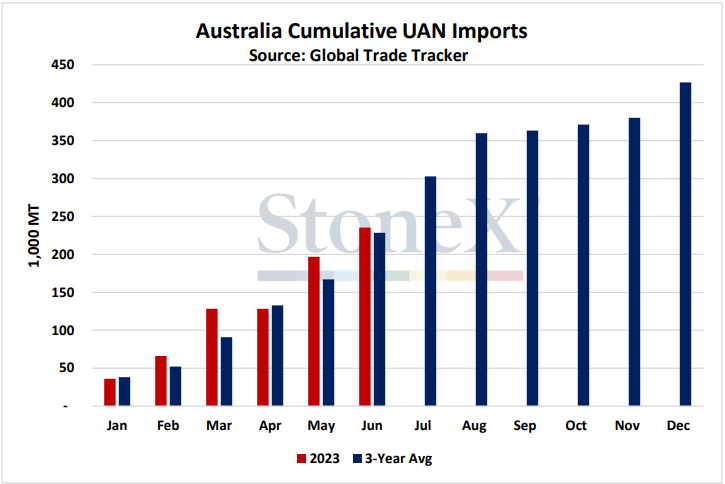
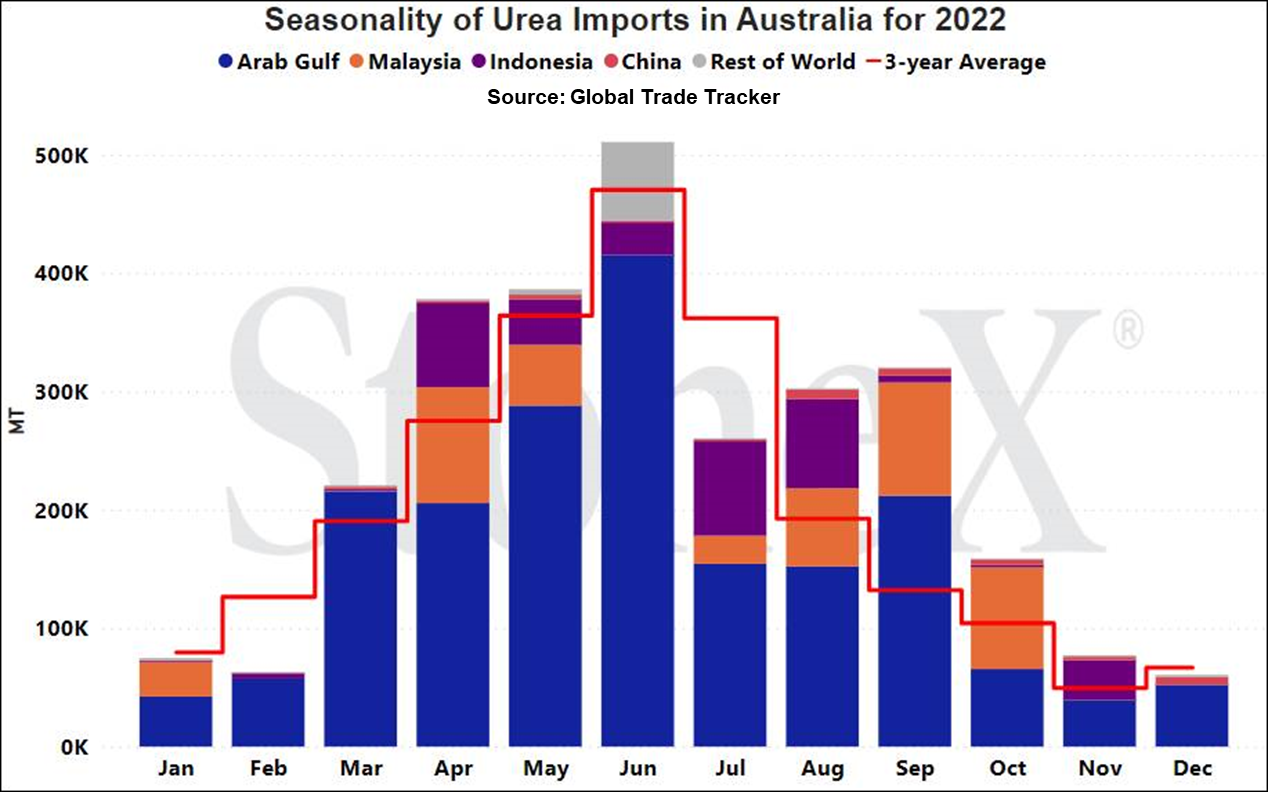
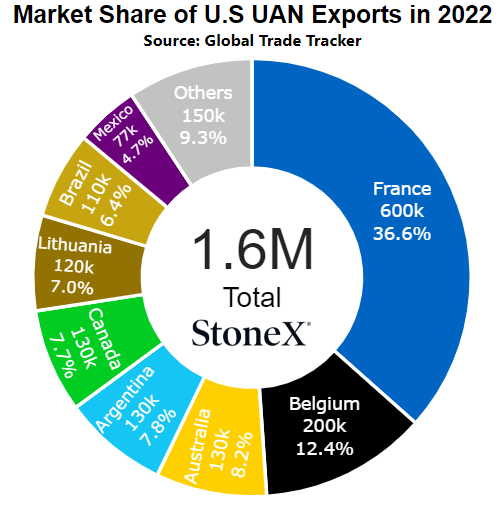
General Australian UAN Information
image 83731


image 78341
image 85328
What has happened in the last 30 days?

EU production continues to struggle with high priced natural gas

Another month, another lack of improvement by EU based nitrogen production facilities.

As has been the case for a while now, EU natural gas values are high vs where they would historically be.  It turns out that when you anger your biggest and cheapest supplier to the point that they shut off gas flows (and then someone sabotages the Nordstream pipelines), your input price rises which shuts off certain manufacturers.  We typically follow the Dutch TTF for European natural gas pricing.  Historically, that price would be in the $4 - $7MMbtu range.  Today, Europe is fortunate that it fell from its high of $103 (August 2021) to its current range of $11 - $13MMbtu.  

Unfortunately, that price "correction" still has approximately 25% of their nitrogen production offline.  It is simply too expensive to produce and compete with the world market.  Instead, Europe has become highly dependent on imports from places like the U.S. to backfill the tons they are not producing.  By our estimation, this equates to around 2M ton per year.  Not only is that 2M ton that is removed from the supply side of the equation, but that adds 2M tons to the demand side as well.

To make matters worse, we have been seeing/reading reports that certain manufacturers are taking steps to "give up" production in the European region and instead start looking at boosting rates in places like North America.  No doubt the POV is that they see N.A. input values as much more stable/cheap compared to what is going on in Europe.  This does not bode well for other manufacturers in the region.

So this is all to say that this story is unchanged.  Europe continues with production rates low and is leaning on imports to backfill.

What does this mean for Aussie farmers?

As long as the EU continues to struggle with high natural gas values, EU UAN production rates will be lowered.

As long as EU UAN production rates remain lowered, U.S. manufacturers will have alternate sales opportunities.

As long as U.S. manufacturers have alternate sales opportunities, they can demand higher prices from N.A....and Australia.

Unfortunately, U.S. manufacturers are reaping the benefits of EU's situation and there isn't an end in sight.

 
Where are current values in relation to the past

NOLA/New Orleans, Louisiana 

Number 2 global importer in 2022
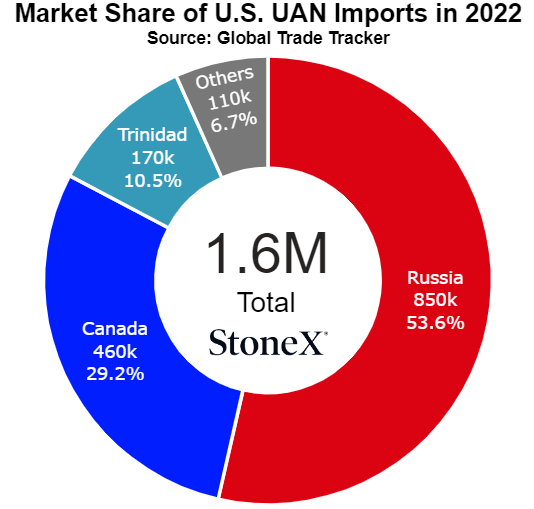
image 83733

Number 1 global exporter in 2022

image 83734

Price comparisons

Vs 30 days ago - 10% or approximately $20 higher

Vs 90 days ago - 7% or approximately $15 higher

Vs 6 months ago - -18% or approximately $50 lower

Vs 1 year ago - -13% or approximately $35 lower
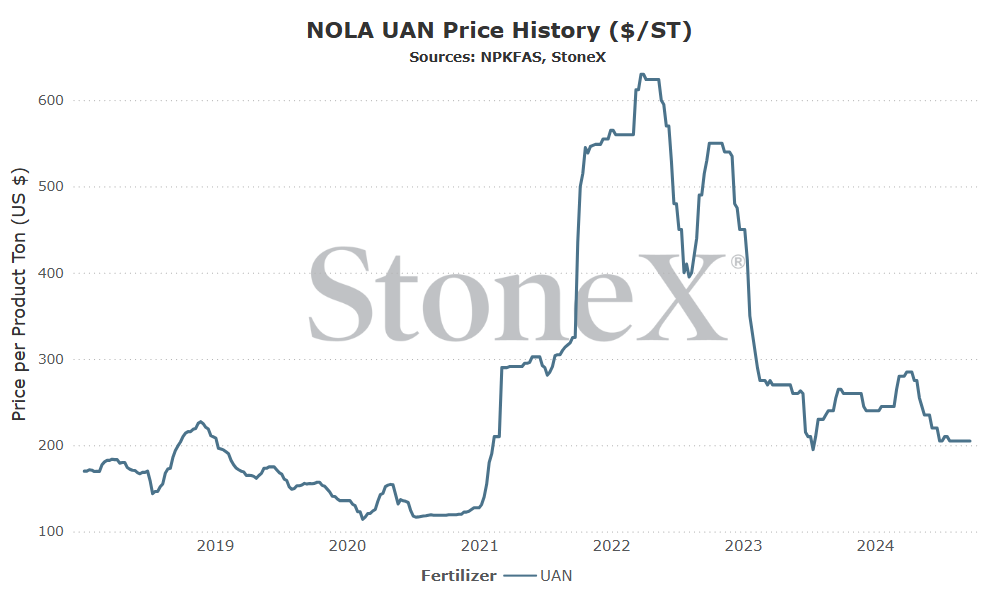
image-20241028221556-2

Black Sea (Russia)

Number 2 global exporter in 2022
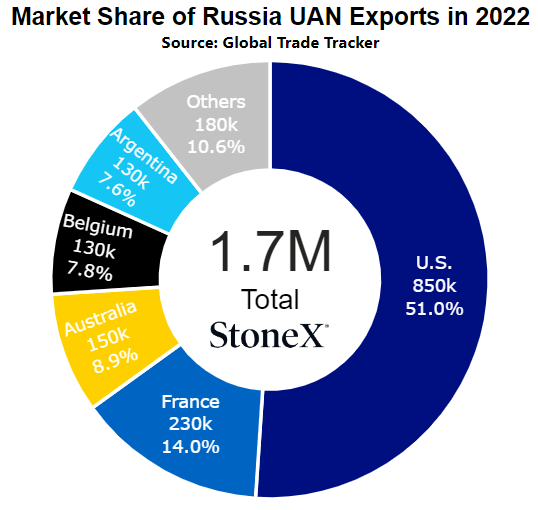
image 83735

Price comparisons:

Vs 30 days ago - 9% or approximately $16 higher

Vs 90 days ago - 11% or approximately $20 higher

Vs 6 months ago - 25% or approximately $39 higher

Vs 1 year ago - 13% or approximately $23 higher
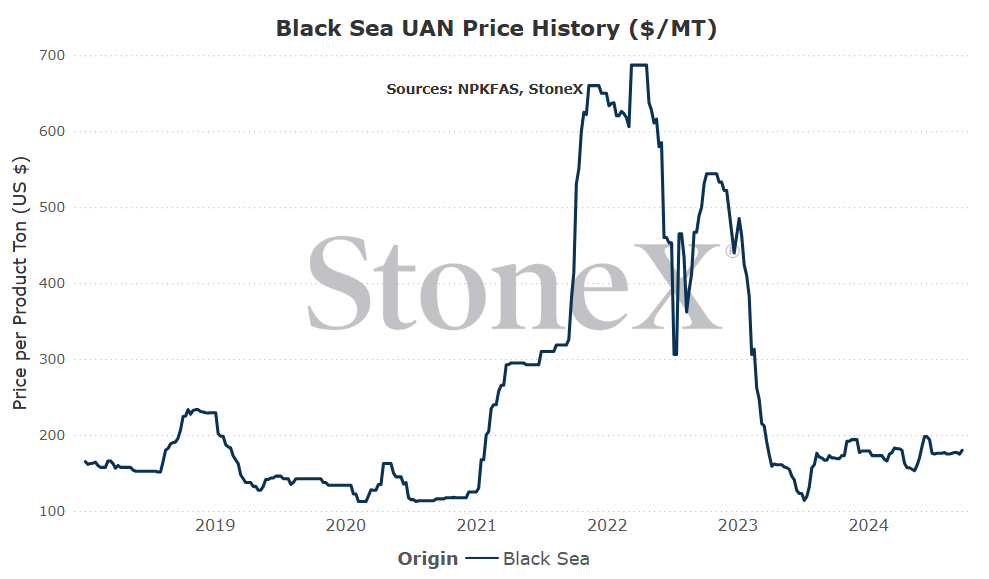
image-20241028221622-4


Bull/Bear Factors
Because no market is ever guaranteed to go higher/lower, we try to consider the factors that can sway values so that we are able to act when they occur rather than react.
Bullish Factors
  • EU production still 75% of normal – 25% of EU UAN production equates to roughly 2M tons per year.  Not only is that 2M tons of supply missing, it is also 2M tons of new demand to backfill the lost production.  Big one-two combo.
  • Urea market outlook appears bullish – where urea goes, UAN should follow...and our outlook on urea remains bullish.  If urea prices start to appreciate, it makes sense that UAN values will eventually follow.  
  • U.S. manufacturers continue to have plenty of sales options - if a seller only has a single sale opportunity, that seller can easily justify dropping their price to ensure they make the sale.  However, if that same seller has a lot of options, they can more easily hold their price up.  They have options.  They have other opportunities.  There is no need to cut price.  Doesn't guarantee higher prices...but it certainly helps make the case.
Bearish Factors
  • Buyers just are not interested with poor farm economics – this continues to be the biggest sticking point in my mind.  Farmers are dealing with crap economics.  Income just isn't enough to cover expenses and make much money. Retailers know this and are playing a much more conservative role out of fear of being on the wrong side.  If this continues thru to the new year (no guarantee that year end/beginning prepay happens), we could see prices pressured.
  • Urea values start to tank – while I do not expect this to happen, markets have proven me wrong before.  Grain values are already low.  If we suddenly see urea values starting to drop, how long will it be before we see UAN follow?  I would expect that prices would hold for a little while but recent history likely has manufacturers nervous on trying to hold on too long.
  • EU production returns - this seems like the stretch factor of the century...but that is how much I am struggling with a 3rd bearish factor!!!  If for some reason we see the EU take steps to restart that last 25% of production, that changes global trade flows.  It removes sales opportunities from U.S. manufacturers.  It adds supplies.
Where are the current UAN/grain ratio values today?

We believe that only looking at the flat price of either grains or fertilizer can be misleading:

  • Only selling grain can hurt you if fertilizer prices rise substantially

  • Only buying fertilizer can hurt you if grain prices fall

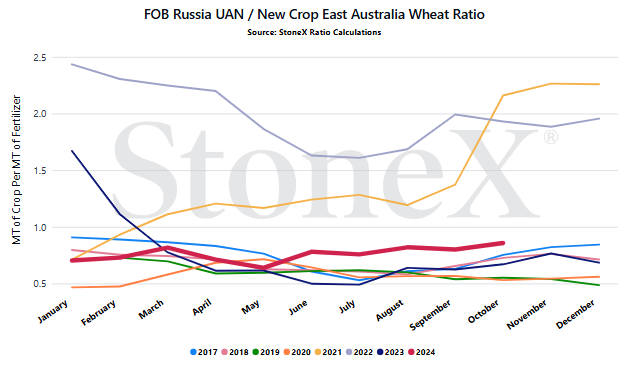
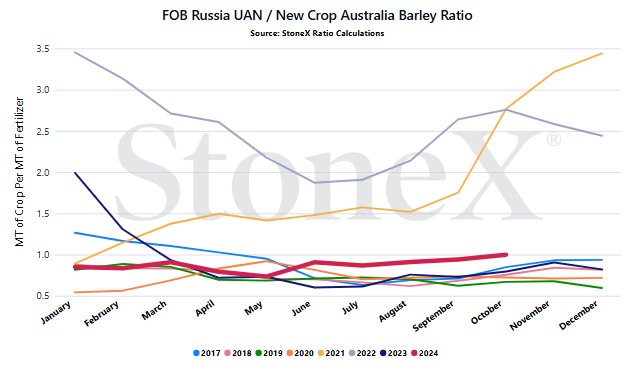
We look at the ratio "value" to get a better indication of where we are or how many bushels of X does it take to pay for 1 ton of fertilizer.

Would you rather:

  • Spend 100 bushels to pay for 1 ton of UAN

  • Spend 60 bushels to pay for 1 ton of UAN

When we compare the current ratio value against recent years, we start to see if we are high or low.

YOUR VALUES MAY LOOK DIFFERENT

This graph looks at the NOLA UAN price vs the flat grain price. There are no logistics on either product. Your location will look different due to fertilizer logistical costs, grain basis, etc.
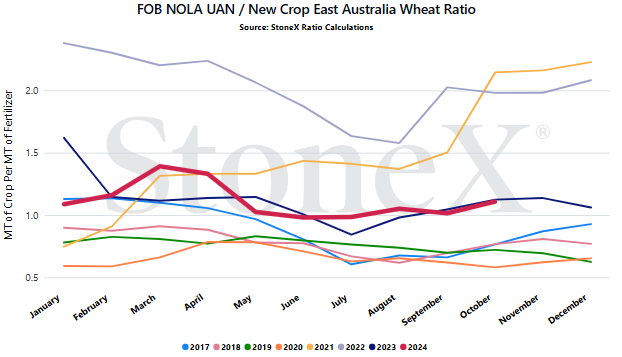
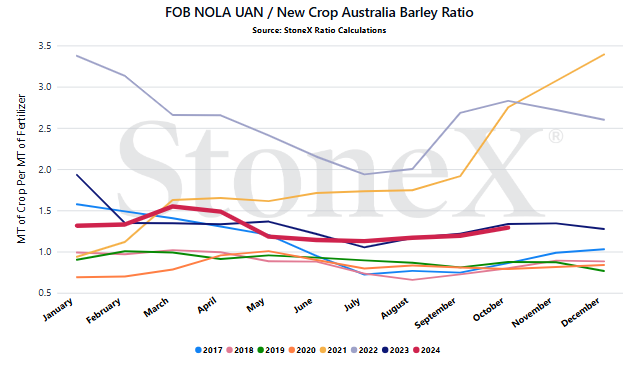
image-20241104155340-1

image-20241104155349-2image-20241104155357-3image-20241104155406-4


Josh Linville’s Focal Points
  • Demand timing - there are a lot of factors that can impact this.  It could be rising grain values.  It could be rising urea values.  It could be fear that the fall NH3 season isn't happening.  Regardless of the reason, it all comes down to when buyers step forward.  Over the last few years, the market has gotten used to buyers stepping in earlier than this year.  Economics were good and folks were willing to spend money.  Now, there are a lot of people saying that expectations for year end/beginning prepay should probably get ready for disappointment.  I still think it is going solid demand that is going to support UAN values...but it is a matter of when that happens.
  • Any further production hiccups - The EU region has been at 75% of normal capacity for all of 2024 and there is little to no indication that improves near term.  We have already seen Trinidad production hiccups due to natural gas supplies.  We are doing ok today, but we can ill afford further issues...and winter is coming.  A North American artic blast could hurt production rates.  Trinidad could have problems again.  Who knows what happens with Russia.  We do not need anymore production downtime.


StoneX Ratio Calculation

The ratio calculation is derived from Bloomberg historical grains values as well as fertilizer values from StoneX, NPKFAS, and Argus.

The calculation is simply dividing the fertilizer price by each grain price.

All data was sourced from StoneX unless otherwise noted.

  • Fertilizers

This material should be construed as the solicitation of an account, order, and/or services and represents the opinions and viewpoints of the individual authors or presenters. It does not constitute an individualized recommendation or take into account the particular trading objectives, financial situations, or needs of individual customers.


The views are current only through the date stated and are subject to change at any time based upon market or other conditions, and StoneX Group Inc. (“SGI”) disclaims any responsibility to update such views. Actual results, performance, or achievements may differ materially from those expressed or implied. Information is based on data gathered from what we believe are reliable sources. Past performance does not guarantee future results.


The StoneX Group Inc. group of companies provides financial services worldwide through its subsidiaries, including physical commodities, securities, exchange-traded and over-the-counter derivatives, risk management, global payments and foreign exchange products in accordance with applicable law in the jurisdictions where services are provided.


References to certain OTC products or swaps are made on behalf of StoneX Markets, LLC (SXM), a member of the National Futures Association (NFA) and provisionally registered with the U.S. Commodity Futures Trading Commission (CFTC) as a swap dealer. SXM’s products are designed only for individuals or firms who qualify under CFTC rules as an ‘Eligible Contract Participant’ and who have been accepted as customers of SXM.


StoneX Financial Inc. (SFI) is a member of FINRA/NFA/SIPC and registered with the MSRB. SFI is registered with the U.S. Securities and Exchange Commission (SEC) as a Broker-Dealer and with the CFTC as a Futures Commission Merchant and Commodity Trading Advisor. StoneX Financial (Canada) Inc. (SFCI) is registered in Canada and is a member of CIRO and CIPF. References to certain securities trading are made on behalf of the BD Division of SFI and are intended only for an audience of institutional clients as defined by FINRA Rule 4512(c). References to certain exchange-traded futures and options are made on behalf of the FCM Division of SFI. Wealth Management is offered through SA Stone Wealth Management Inc., member FINRA/SIPC, and SA Stone Investment Advisors Inc., an SEC-registered investment advisor, both wholly owned subsidiaries of SGI.

R.J. O’Brien & Associates, LLC (RJO) is registered with the CFTC as a Futures Commission Merchant and is a member of NFA.


StoneX Financial Ltd (SFL) is registered in England and Wales, company no. 5616586. SFL is authorized and regulated by the Financial Conduct Authority (FCA) (registration number FRN:446717) to provide services to professional and eligible customers including: arrangement, execution and, where required, clearing derivative transactions in exchange traded futures and options. SFL is also authorized to engage in the arrangement and execution of transactions in certain OTC products, certain securities trading, precious metals trading and payment services to eligible customers. SFL is authorized and regulated by the FCA under the Payment Services Regulations 2017 for the provision of payment services. SFL is a category 1 ring-dealing member of the London Metal Exchange. In addition SFL also engages in other physically delivered commodities business and other general business activities which are unregulated and not required to be authorized by the FCA.


This communication is issued in the European Economic Area by StoneX Financial Europe GmbH (SFEG). StoneX is the trade name used by STONEX GROUP INC. and all its associated entities and subsidiaries. StoneX Financial Europe GmbH (“SFEG”) is a securities trading firm registered in Germany under Company No. HRB 80844.


StoneX Financial Pte Ltd (Co. Reg. No 201130598R) (“SFP”) is regulated by the Monetary Authority of Singapore and is a Capital Markets Service Licence holder (for dealing in capital market products), an Exempt Financial Adviser (for advising on investment products and issuing or promulgating analyses/ reports on investment products) and a Major Payment Institution (for domestic and cross-border money transfer services).


SFP may distribute analysis/report produced by its respective foreign affiliates within the StoneX Group of companies pursuant to an arrangement under Regulation 32C of the Financial Advisers Regulations Recipients should contact SFP at (65) 6309 1000 for any matters arising from, or in connection with, this webinar.


StoneX APAC Pte. Ltd. (“SAP”) (Co. Reg. No 200616676W) is regulated as a Dealer (PS20190001002) under the Precious Stones and Precious Metals (Prevention of Money Laundering and Terrorism Financing) Act 2019 for purposes of anti-money laundering and countering the financing of terrorism.


StoneX Financial (HK) Limited (CE No.: BCQ152) (“SHK”) is regulated by the Hong Kong Securities and Futures Commission for Dealing in Securities and Dealing in Futures Contracts.


StoneX Financial Pty Ltd (ACN 141 774 727) holds an Australian Financial Service License (AFSL: 345646) for Dealing in Securities, Exchange-Traded Derivatives Contracts, OTC Derivatives Contracts and Foreign Exchange Contracts, and is regulated by the Australian Securities and Investments Commission.


StoneX Securities Co., Ltd. (“SSJ”) (Co. Reg. No 010401047199) is regulated by the Japanese Financial Services Agency as a Type-I Financial Instruments Business Operator (Kanto Local Finance Bureau (FIBO)No.291’), is a member of the Financial Futures Association of Japan for dealing and broking FX and FX Option transactions, and is a member of the Japan Securities Dealers Association for dealing and broking stock indices and option transactions.


Trading swaps and over-the-counter derivatives, exchange-traded derivatives and options and securities involves substantial risk and is not suitable for all investors. Past performance of any futures or option is not indicative of future success. Indicators are not a trading system and are not published as a specific trade recommendation. The information herein is not a recommendation to trade nor investment research or an offer to buy or sell any derivative or security. It does not take into account your particular investment objectives, financial situation or needs and does not create a binding obligation on any of the StoneX group of companies to enter into any transaction with you. You are advised to perform an independent investigation of any transaction to determine whether any transaction is suitable for you. No part of this material may be copied, photocopied or duplicated in any form by any means or redistributed without the prior written consent of StoneX Group Inc.


The report/analysis herein is not directed to, or intended for distribution to or use by, any person or entity who is a citizen or resident of or located in any locality, state, country or other jurisdiction where such distribution, publication, availability or use would be contrary to law or regulation.


© 2026 StoneX Group Inc. All Rights Reserved.

Satellite view of Earth at night showing illuminated cities across Asia and the Middle East

Discover more insights

Our subscribers have access to comprehensive market analysis from StoneX spanning commodities, equities, currencies and more.

StoneX: We open markets

Our market expertise, advanced platforms, global reach, culture of full transparency and commitment to our clients’ success all set us apart in the financial marketplace.

Reach

With access to 40+ derivatives exchanges, 180+ foreign exchange markets, nearly every global securities marketplace and numerous bi-lateral liquidity venues, StoneX’s digital network and deep relationships can take clients anywhere they want to go.

Transparency

As a publicly traded company meeting the highest standards of regulatory compliance in the markets we serve, our financials and record of accomplishment are matters of public record. StoneX’s commitment to “doing the right thing over the easy thing” sets us apart in the industry and helps us build respect, client trust and new partnerships.

Expertise

From our proprietary Market Intelligence platform, to “boots on the ground” expertise from award-winning traders and professionals, we connect our clients directly to actionable insights they can use to make more informed decisions and achieve their goals in the global markets.