Welcome to our monthly analysis of LBMA trading volumes for the major precious metals. As usual, there are some interesting patterns to explore.
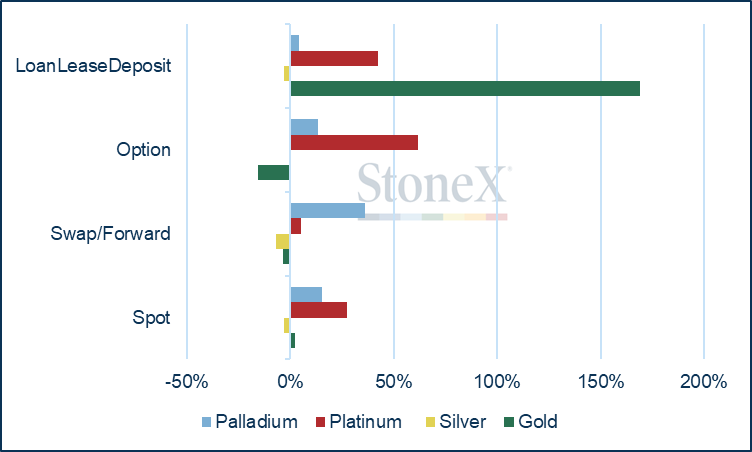
In the main, spot gold and silver volumes were again lower month-on-month, albeit only marginally, although the very high volumes in gold in the wake of the Federal Open market Committee distorted the overall gold figures slightly, pushing them into the plus column. Where gold really shone was in the LoanLeaseDeposit sector, with volumes more than doubling over the average for January to May. Once again, the liveliest changes were in platinum and palladium, both of which posted volume gains across the board and in which volumes have been growing since mid-May.
As ever, heavy volumes were almost always followed by changes in trend, or at least a correction; as sentiment changes so some positions are opened while others are closed.
Daily average trading volumes in June, compared with the average for the first five months of the year.
GOLD
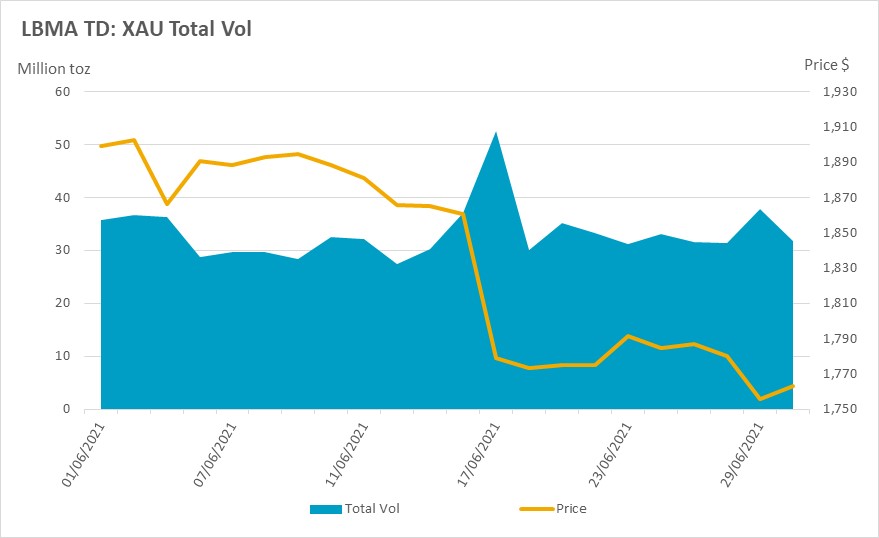
Had it not been for the markets’ perhaps exaggerated reaction to the outcome of the Federal Open Market Committee’s (FOMC) meeting in mid-June (see below), gold’s average spot traded volumes over the month would have been fractionally (-1.3%) lower than the average for January to May as the overall gradually declining trend was, very largely sustained. It was a similar story for forwards and options, while the LoanLeaseDeposit (LLD) patterns differed slightly from the other sectors.
It is probably easier to deal with this latter subsector first. It is arguable that on at least one occasion during June the actions in the LLD segment could be regarded as both a price maker and a price taker. During May the gold price had steadily worked its way higher and at the second attempt managed to clear the $1,900 level. It is certainly possible that this was a target level for potential hedging, as LLD volumes picked up smartly as the price crossed this psychological barrier at end-May; after a brief pause volume jumped again on 2nd June, with gold peaking that day at $1,902.75 in the LBMA afternoon auction but hitting intraday highs closer to $1,910, before dropping more than $35 the following day. The rest of the month saw broadly steady LLD volumes as the price slithered lower before stabilising in a narrow range around $1,780 towards month-end. Then LLD turnover jumped again. This could certainly have been to do with the approach of the end of the quarter, but may also have been fresh hedging on the basis that the price wasn’t making much headway in either direction. Following this activity the price dipped to test $1,760, before starting a fresh recovery in early July. To put this into context, these two outliers were 32% and 43% higher respectively than the average over the rest of the month.
The main talking point in the financial sector was the shift in stance from the FOMC. The bond market in particular seemed spooked, although it dusted itself off fairly quickly. This theme, and the debate over whether inflationary forces are transitory or persistent, has informed gold sentiment ever since – although to be fair, Fed policy has been front-and-centre for a long while now. The June FOMC meeting is one of the four during the year (there are eight meetings in total) when the Committee delivers economic projections. The key element that unnerved the markets was the “dot plot”. This is the chart that shows where the individual Committee members expect to see the fed funds target rate at the end of the coming years. In March, the Committee was expecting rates to stay where they are now right through to the end of 2023. Now the expectation is that by the end of 2023 the rate will be 50 basis points higher than currently; and there has been increasing evidence of a bifurcation between the Doves and the Hawks on the Committee, with some of the latter even arguing for a rise before the end of this year. The drop in the gold price just after the meeting was exacerbated by technical factors, CTAs, momentum trades and the like, with spot volumes soaring for two days after the meeting then returning to more normal levels, as did forwards and options.
The key here is the flattening of the yield curve. The bond market is telling us that it is expecting tighter conditions from ~2-4 years out, obviating the need for further tightening thereafter. The rates on the medium-term tenors have consistently risen over the past few weeks, while week-to-week changes in the 20- and 30-year rates have been falls. Real rates remain negative and the Minutes from the meeting showing a continued bias towards “lower for longer”; and the gold market appears to have stabilised after the retreat of weaker handed holders and the arrival of bargain hunting from private individuals in south-east Asia to professional investors.
SILVER
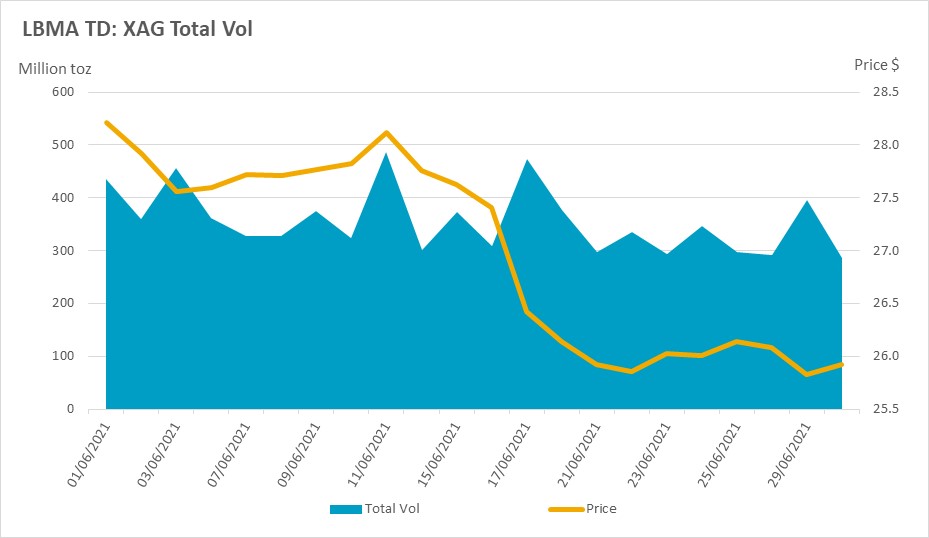
Silver volumes were choppier than gold during June. Overall, the daily average spot activity was down 3.1% against the January-May average, while swap and forward volumes were down by 6.8%. After the surges in activity in May that suggested some forward selling into strength, silver traded in what, for this most volatile of metals, was a very narrow range. Intraday prices peaked at the start of June at $28.56 and bottoming out at month-end, at $25.53 on the 29th. This is a range of just 10.6%, compared with gold’s 8.6% range measured on the same basis ($1,751 to $1,907). Ordinarily silver would be expected to trade a range twice as wide, if not more, than gold.
In terms of volumes traded, there were four days when spot daily volumes were more than one standard deviation higher than the average (compare two for gold) and five days when volumes were more than one standard deviation from the average (compare one with gold). With one exception, the low volume days all followed the markets’ falls post-FOMC, suggesting a nervousness about possible future direction.
Volumes in the LLD sector, however, in the final week of June were 57% higher than the rest of the month, which does suggest that hedged or financing positions were being rolled forward or squared off ahead of the quarter-end.
This contrasts with the pattern in the forwards, in which volumes in the first half of the month were 25% higher than in the second half, which also suggests that investor or speculative activity was cautious.
Interestingly the highest volumes in both spot and forwards were on 11th June, surpassing activity in the FOMC fall-out a week later. Once again, this falls in line with the premise of high volumes heralding a change in direction. This time, after silver had dropped a week previously from over $28 to test $27, then rallied but failed on four successive days to clear $28, it looks as if sentiment changed. On the 11th there was a brief foray over $28, but the price went into reverse as participants bailed out and it looks as if others sold forward, at the same time as gold was failing to clear $1,900. So both gold and silver were on the retreat even before the FOMC meeting.
PLATINUM & PALLADIUM
There are important common elements to the patterns of trading of these two metals which should be taken together, and this is the LLD subsector and the “industrial” usage of the major PGMs.
LoanLeaseDeposit
It looks very much as if both platinum and palladium trading volumes were benefiting from the reopening of industrial activity. Once we have accounted for the automotive sector, which typically takes up approximately 40% of global platinum demand, and jewellery, which currently absorbs roughly 26%, the balance is accounted for by investment and industrial demand. Much of the latter involves platinum as in-process material, e.g. baths for float glass, bushings for fibre glass, and catalysts in the petrochemical industry and the production of fertilizer. Consequently there can be a lot of leasing activity in the markets for both these metals from time to time. The way it works is that when in-these PGM -bearing components need replacing, for example when a catalyst becomes spent, the industrial entity will borrow (or own) the necessary metal to add while the spent catalyst is recycled with the new metal in order to produce a fresh catalyst. This is known as closed-loop recycling, in that the material in question stays within the production and recycling process and doesn’t get sold further downstream.
In June. Platinum LLDs were up by 42% over the average daily rates from January to May, while palladium LLDs were up almost four-fold. There was no direct correlation between the two sets of figures, but that is understandable as the industrial uses vary; while platinum’s uses are as above, those of palladium that need closed-loop recycling are centred more on the chemical sector (and emission control catalysts in the auto sector, which are not involved in closed-loop recycling, account for 80% of global demand).
A number of capacity expansions were postponed during 2020 due to the pandemic and it looks very much as if the return to more normal conditions now means that industrial consumers are locking in supply down the curve.
Spot, forwards and options:
Platinum spot turnover was up by 28% in June against the average of the previous five months, while palladium volumes were ahead by 36%.
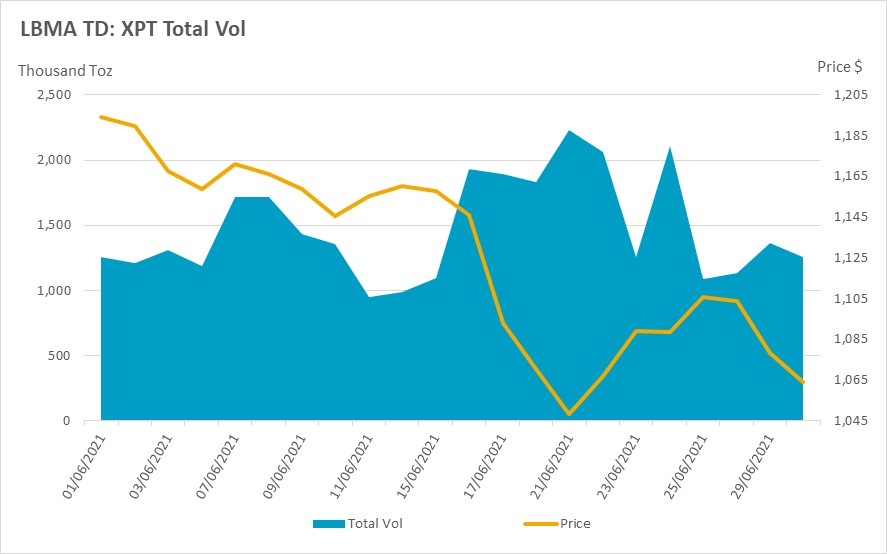
Key outliers for platinum were the 4th, 16th and 21st of June. In between, volumes tended to tail off and, as usual, volume peaks were coincident with changes in price direction. Over the period there were a couple of pieces of news that could have had a bearish influence on platinum prices, with one news agency talking on 3rd June about the likelihood of a strong production recovery from Amplats, plus increasing cognisance of the shortage in microchips and the impact that this has been having on the completion of auto manufacture. More likely, in practice, the surge in volume may have reflected the fact that platinum was, by this stage, heavily in oversold territory and therefore liable to profit taking from shorts.
A similar argument can be applied to 21st June when platinum was testing minor support in the $1,050 region and was heavily oversold. At this stage there was also heavy activity in the forward markets as well as a pick-up in volume in the options markets, suggesting that the market sees $1,050 as good bargain-hunting ground area; certainly since that turnaround the price has been consolidating (at time of writing) between $1,050 and $1,100.
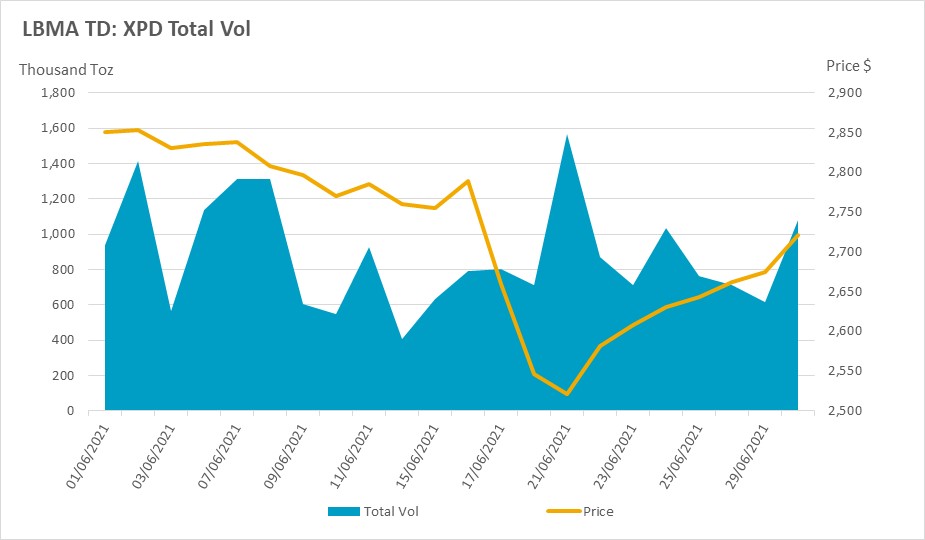
Palladium spot and forward activity was lively at the start of the month. After rallying towards the end of the month in a partial reversal of earlier falls, palladium ran into resistance at $2,900 and eventually stale bull liquidation kicked in along with some forward sales. The next bout of volume came after Nornickel had reported on 4th June that the Taimyrsky mine was resuming operation (this was one of the mines that was hit by flooding earlier in the year), and this may have prompted some further profit taking and forward selling (which is not to imply that the trading came from the mining house itself).
The heavy fall in price on 17th June came in thin conditions (and as we have noted before, thin conditions can lead to wide price swings) and can be ascribed to contagion from the fall-out elsewhere following the FOMC Statement. The final big outlier, again both in spot and forwards, on 21st, was bargain hunting as the metal gradually defined a trading range of between $2,500 and $2,900, a range that has held good in the first days of July.