Well, it’s here. The question now is whether you still want it when it seems to be more out of favor than at any point in the past year.
Writing this Q2 Forecast is strikingly similar to last year’s. Last year there was a looming threat that seemed to have negative overtones, and stocks had already started to pull back from record highs in a notable way. And, in both situations, President Trump retained a degree of control on the outcome, with last year’s ‘Liberation Day’ tariffs which were set to come online just after the Q2 open and this year’s continued campaign in the Middle East.
Last year it felt very much like trying to catch a falling knife. But, taking a step back and looking at weekly and perhaps even monthly charts helped to illustrate why retaining a bullish bias and looking at the current sell-off more as an opportunity, at some point in the future, was a more attractive path forward.
It didn’t take long for that to play out but then along came a new theme, one the markets are now widely aware of. This is the ‘TACO’ trade which insinuates that President Trump often backs down from the face of pressure to prevent larger declines in stock prices. It seemed to be known back then but it’s been publicized far and wide more recently, with many major media sources and headlines directly calling out the matter.
Perhaps the bigger question for this scenario is whether Trump has as much control over the conflict in the Middle East as he did tariff implementation just months after inauguration. And perhaps more pointedly, whether the market response to this dynamic situation is something that’s presenting fewer controllable variables for the Commander in Chief.
As I write this forecast in the closing days of Q1 it feels like last year when stock prices resembled a falling knife. For short-term strategy, that’s far from ideal if looking to buy or get long. But, as I did write in the 2026 forecast, chasing prices while at or near record highs was going to require a pullback to make bullish positioning an attractive prospect. Well, that pullback has arrived, and the longer-term chart remains bullish and opportunistic. So, the question for Q2 is when or where support develops to allow for that to happen, and I’ll look into four separate equity indices below.
S&P 500
In SPX my 2025 target was hit shortly after the 2026 open, but it was the 7k level in the cash index that proved problematic. That price traded only briefly on the morning of January 26th and what started as stalling soon turned into reversal. And like last year, that bearish drive came after the month of February showed a grinding backdrop around ATHs.
As of this writing, my first key zone of support has already come into play at the 6500 level and with price pushing through that, it remains a pensive theme as we approach the Q2 open. If we do see buyers return, on a shorter-term basis, that zone could remain as usable. If not, then the focus goes to another key zone that’s a little further below and, interestingly, this has some relation to last year’s theme as the 6145 level was around where buyers had stalled before the 2025 pullback on the Liberation Day theme.
SPX - Weekly Chart
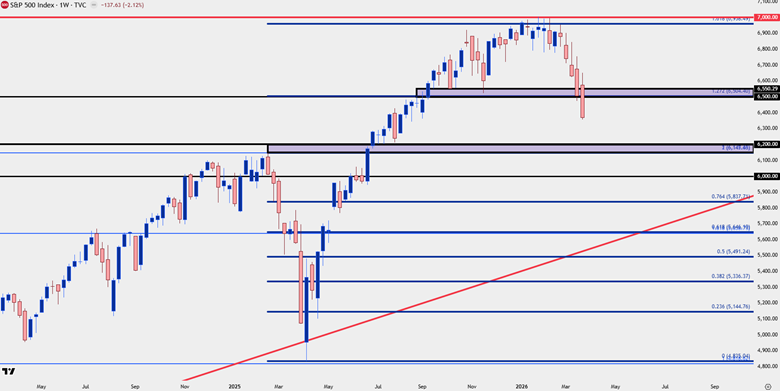
Chart prepared by James Stanley; data derived from Tradingview
Large Cap Bigger Picture
The monthly chart illustrates why I think one would want to look at this situation as opportunistic.
Since the Financial Collapse in 2008 there have been a handful of pullback scenarios in stocks, including the Covid pandemic and then the abrupt rate adjustments of 2022. Each turned out to be an attractive buying opportunity and it’s from that 2022 episode that I think we can get a feel for what may be ahead.
In 2022, the Fed was forced to raise rates because they dismissed inflation in 2021, instead choosing to allow the market to run hot for fear of stalling the recovery from the Covid pandemic. But the fact that the Fed started talking up the possibility of rate cuts far before they had even finished hiking highlights the fact that the American central bank has a built-in interest to keep equity markets strong. Couple this with the fact that President Trump’s chosen successor is taking over atop the Fed in Q2, and it’s difficult to imagine that the Federal Reserve’s take on ‘the wealth effect’ would have any negative changes.
So, rather than chasing downside for temporary bearish momentum the more prudent path forward seems to be to remain bullish, look for support and wait for matters to turn higher. This is why the market awaits the TACO trade and frankly it makes sense as to why it could work out like that. President Trump probably doesn’t want to see a bear market ahead of mid-term elections later this year.
SPX - Monthly Chart
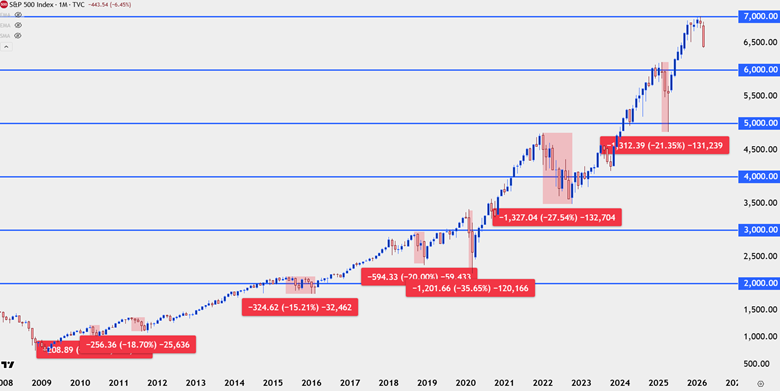
Chart prepared by James Stanley; data derived from Tradingview
Nasdaq 100
Perhaps one of the more bullish qualities of the current backdrop is what isn’t happening, and that’s the near constant bubble talk that had enveloped tech stocks and specifically AI-related stocks late last year.
To be sure, this was of little surprise as it’s something I had talked about in the 2025 equities forecast. There was striking similarity between the AI boom of recent and the tech boom 25 years prior. Stretched valuations and sketchy revenue data painted a very similar picture, where investors’ excitement had gotten the better of them to allow these massive trends to build in names like NVDIA.
And from that NVDA ticker there’s a good illustration of what I’m talking about as the pullback there has been rather slight so far, all factors considered. If we did get a broader sell-off the big question is whether we’re at a point where investors will sell out of stakes like NVDA and instead look for safer harbors elsewhere. This would seem to require some element of re-pricing on the AI theme, and I simply don’t see that backdrop nearby. Instead, this recent sell-off seems more of a knee-jerk reaction to inflationary potential produced by the prospect of higher oil prices driven by Middle East conflict.
And further to that point, if investors did state a wide-scale sell-off in NVDA, would there suddenly be few or no investors looking to take advantage of the pullback and ‘buy the dip?’ Would the continued tensions in Iran and the Strait of Hormuz have a negative effect on that matter – would it have a delay in how quickly AI is changing the world around us?
In stocks, a similar theme has shown in the Nasdaq 100 as NVDA, where the pullback has so far remained as relatively light, all factors considered. But with that said, the weekly chart is difficult for me to justify as bullish at this point given that price is in the process of putting in a support break. The level that’s next up on my chart is the zone around 22,500 which was the resistance point in 2025 before the tariff-fueled pullbacks. Below that, there’s a shorter-term spot of support at 21,362 and then the 20k level is a major zone, spanned up to the 61.8% Fibonacci retracement at 20,224.
Nasdaq 100 (NDX) - Weekly Chart
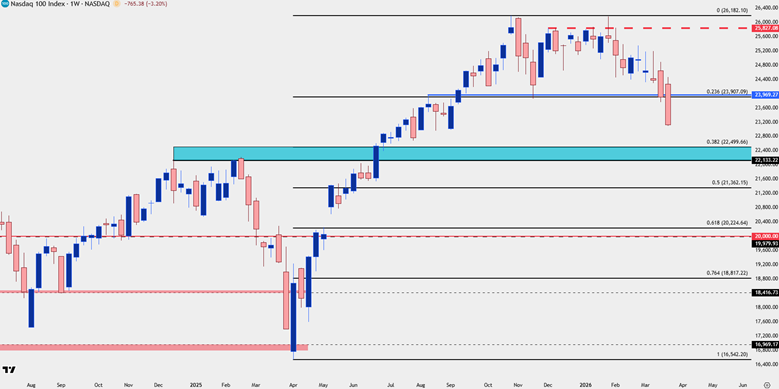
Chart prepared by James Stanley; data derived from Tradingview
Dow Jones
The early-year strength in the Dow saw the index test a massive spot of resistance above the 50k handle and that’s where demand suddenly stalled. That level was also the 2.618% extension of the 2022 pullback which is related to a support level that’s almost back in the picture at 45,244, which is the 100% measured move of that same prior sell-off.
The proximity to that support makes it a bit more difficult to use in a three-month forecast but if we do see buyers stage support in early-Q2 trade, that could make for a more attractive backdrop of bullish continuation than what might be showing in NDX or SPX, at the time. This would mark that zone around the 45k level as key support, and if that’s breached, the next support down is a spot of prior resistance-turned-support at 43,325, after which it’s the 42k handle that comes into the picture which is confluent with the 1.618% extension of that same 2022 pullback.
Dow Jones - Weekly Chart
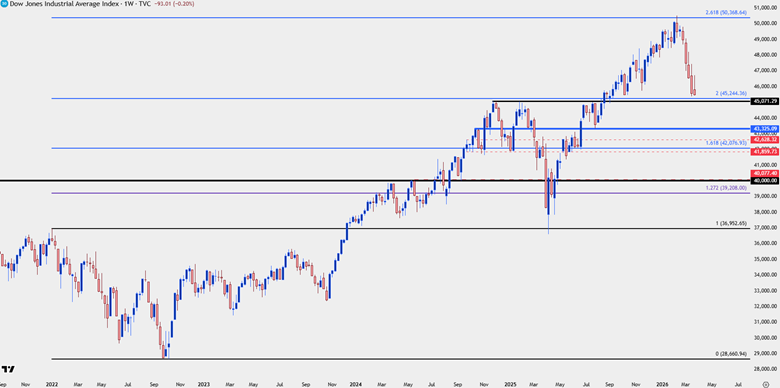
Chart prepared by James Stanley; data derived from Tradingview
Russell 2000
Perhaps one of the larger surprises of early-2026 trade was the outperformance in the Russell 2000 index, which coming into last year had been a major laggard amongst US equity indices.
In both 2022 and 2024 the index was unable to test the 2500 level, with the 2460 area coming into hold the highs in both scenarios. The pullback last year was especially brutal to small caps as RTY lost as much as 31%. But it also came back to life in a very big way as late last year brought a fresh ATH into the mix, which was followed by an extension in that rally in early trade this year.
As of this writing, the index is back at the 2460-2500 zone and that makes directional prognostication a challenge. But – if we do see the dip bought in US equities in early-Q2 trade, like the Dow above, this is an attractive backdrop as buyers can look for the index to first reclaim the 2500 level, after which short-term resistance sets up at 2560 and then 2605, after which the 2704 Fibonacci extension comes into view around the prior ATH.
Conversely, if the sell-off in US equities extends through early-Q2 trade as it did last year, the next support down for the Russell 2000 is a familiar spot around the 2300 level in the index.
Russell 2000 Futures – Weekly Chart
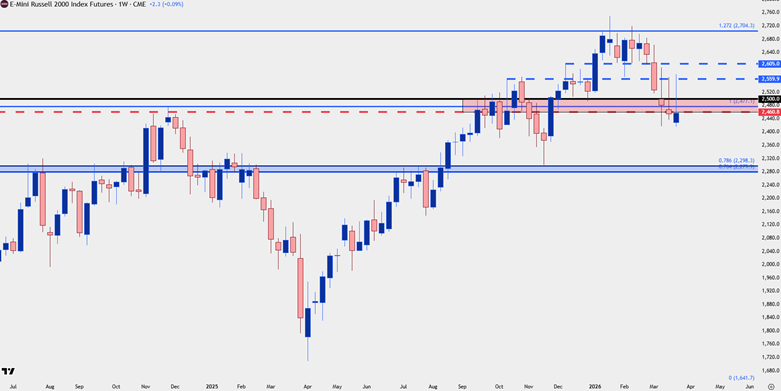
Chart prepared by James Stanley; data derived from Tradingview
--- written by James Stanley, Senior Market Analyst, Global Macro