Q4, 2025 Forecast for US Equities: S&P 500, Nasdaq 100
As we move into Q4 there’s a similar backdrop in US equities as what was showing at the start of the year: A well-priced bullish rally that has shown only a minimum of pullback lately. We had the start of rate cuts at the September FOMC meeting, in both years, and there’s a wide expectation for another 50 bps in cuts for 2025, along with more softening in 2026 and 2027. Frankly, there’s little reason to doubt the bullish trend that’s taken over stocks from the April lows and the one hindrance at this point is just how aggressively that’s priced in, with the Nasdaq 100 up almost 50% from the lows of just five months ago.
As I’ve said for the past couple years in these equity forecasts, I remain bullish. But like I also said coming into this year, this is an environment that’s ripe for a pullback and that could be the trader’s best friend when working with such trends. That pullback arrived forcefully in early-Q2 trade and ultimately, that proved to be one of the most opportune long setups for stocks in decades. The oversold RSI reading on the weekly chart was only the second such observation in the past ten years, with the Covid pandemic as the other. In both cases, stocks showed a massive reversal thereafter and now we’re dealing with the hangover effect of that second instance.
At this point there remains little reason to expect the normally bullish backdrop of the past 16 years to change. The Fed remains dovish, even with inflation 50% above their target, and the executive branch has certainly taken interest in talking stock prices higher. So, any pullback that does show will likely be met with supportive commentary either from the fiscal or monetary side of the coin and perhaps even both.
The risks to this forecast are surprise moves with inflation and given the Fed’s most recent forecast for Core PCE to finish the year at 3.1%, that would seem to be the line in the sand that could start to question the dovish expectation around the FOMC. But that might be more of a Q1, 2026 theme than something of note for next quarter. It was the flare in inflation earlier in the year that caused the Fed to take a step back from rate cuts earlier in the year, and equity prices suffered as the prospect of tariffs came into the equation, as well.
For targets, the 161.8% extension of the 2025 pullback plots at 6958, which is confluent with the 7k psychological level. That’s just about 4.7% away from current price and that seems a reasonable estimate for where prices may move as we push into the end of the year. That would be roughly a 17% gain for SPX in 2025, which doesn’t seem outlandish given the backdrop of a softening Fed and 30-year bonds trading below 5%.
For support – the 6500 level is notable, as this is confluent with the 127.2% extension of that same major move. That price had provided resistance for the rally on the way up, and this becomes the area of the chart that bulls need to defend in the event of pullback scenarios. If we do get a larger sell-off, the price that sticks out as important is the same that caught the high in February at 6148, which is the 161.8% extension of the 2022 pullback. Notably, that level hasn’t yet been tested for support since the breakout so in an adverse scenario, with a deeper pullback whether that’s driven by inflation data or just a top heavy trade pulling back, that becomes the next significant line in the sand below 6500.
SPX Weekly Chart
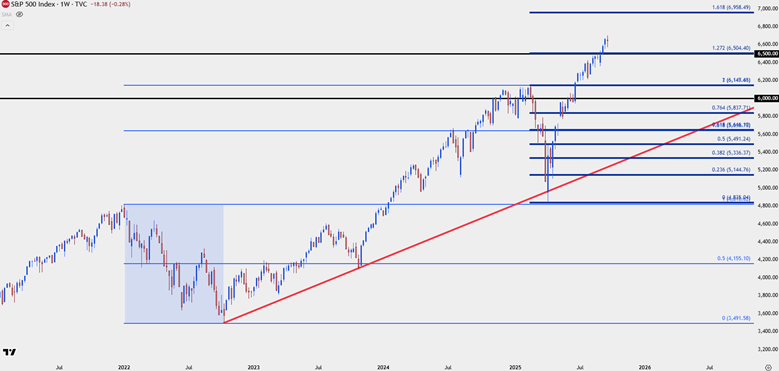
Chart prepared by James Stanley; data derived from Tradingview
Nasdaq
Tech remains the more worrisome part of the US equity backdrop at the moment, largely just because of how aggressively it’s run and there’s questions remaining around the revenue potential of the AI trade, which has absolutely taken over. And like I had looked at coming into this year, that does bear resemblance to the dot com trade that drove so aggressively in 1999 as the unbridled hope for follow-through growth on the back of this ‘new’ medium created lofty valuations that would be difficult to justify even in a best case scenario.
But valuation alone is not a bearish thesis, and as example, we can go back Alan Greenspan’s warning of outlandish valuations in tech stocks as an example. In December of 1996, Greenspan had the famous remark about ‘irrational exuberance.’ This is often quoted by the media as testament to ‘the maestro’ being able to see that a reversion was on the horizon.
But in December of 1996 the Nasdaq 100 was trading at around 800. The index then went on to grow more than five times that amount over the next three years, and when it did finally fall – it was that same 800 level that came in as support in 2003. The index never fell below the level that it was at when Alan Greenspan made that comment.
Nasdaq 100 1993-2007
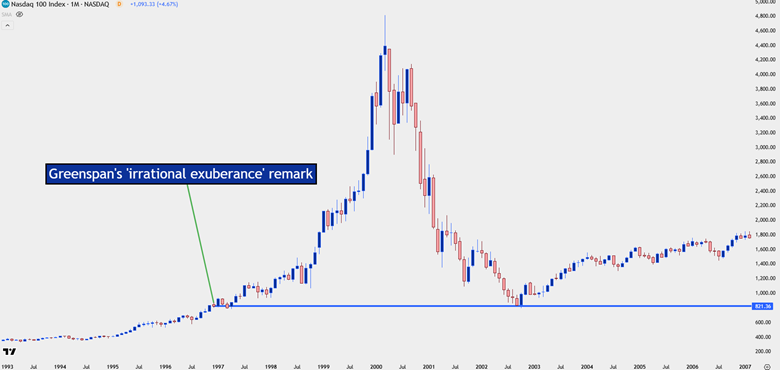
Chart prepared by James Stanley; data derived from Tradingview
NDX in Q4
For the Nasdaq, I’m going to employ a similar method for targets by using a 161.8% extension of the 2025 pullback move, which again, lines up to just around 5% from current market price. That seems a reasonable estimate for topside targets into the final quarter of the year, and if that is attained, it would amount to an approximate 21.5% move for 2025, which also seems reasonable.
For support, the 127.2% extension aligns with an area of prior resistance, around 23768 and this would be the ‘s1’ level for the index as we move into Q4. For the ‘s2’ zone, I’m tracking that a little deeper at some unfilled gap in NDX from 22763-22973, and for the ‘s3’ zone, it’s the same area as the February high of 22222 spanned down to a prior resistance level of 21856.
If bears are able to elicit a break below that ‘s3’ zone, my assumption is that something in the backdrop would have changed and that’s impossible to predict from where we’re at right now; but bigger picture, the next major test below that would be the support zone around the 20k handle which has a wide range of unfilled gap following the breakout in May.
A test there would be a legitimate ‘moment of truth’ for bulls.
Nasdaq 100 Weekly Price Chart
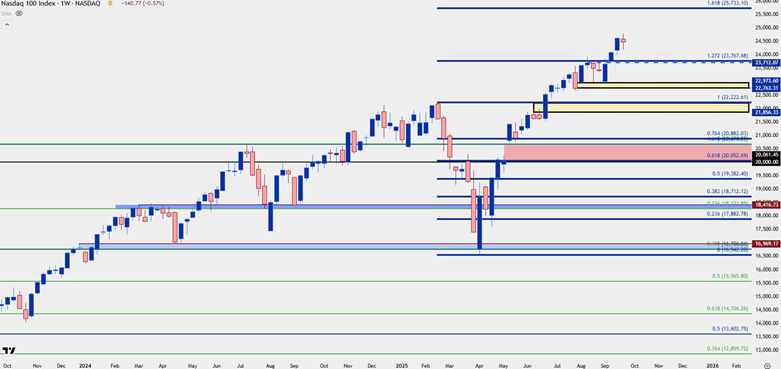
Chart prepared by James Stanley; data derived from Tradingview
--- written by James Stanley, Senior Strategist