Durum
Market Summary
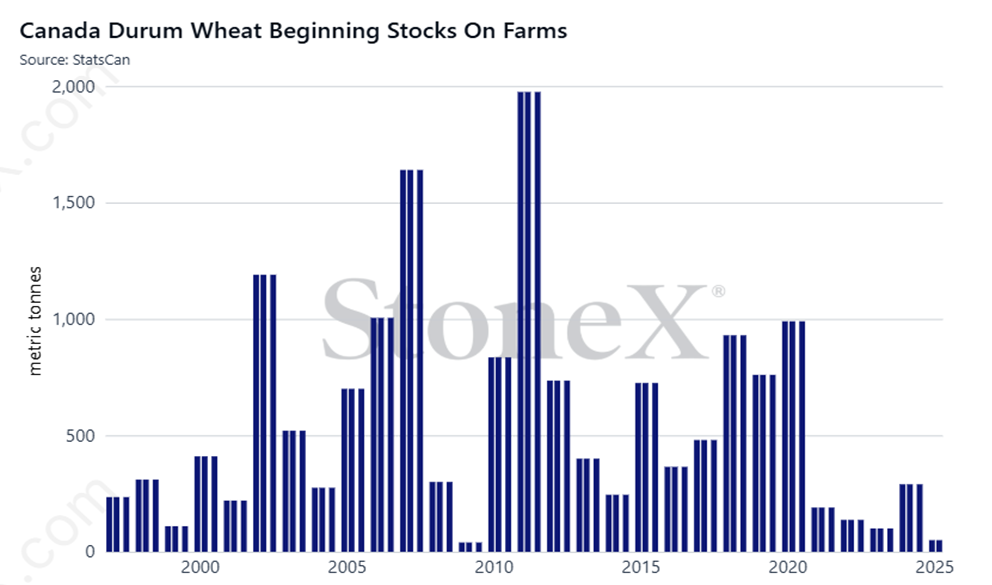
· Stats Canada released the July 31st stocks report estimate at 496,000 MT vs 669,000 MT in 2024
· Quality concerns after rain delays with sprouts and low falling number the biggest factor, also Low TW, mildew and bleaching
· Producer harvest deliveries were stronger year over year with YTD 757,100 vs. 542,700 MT last year, bringing visible to 597,900 MT
· On farm stocks were lower to start the crop year, but factor in visible stocks and we come in at the 500,000 MT carry in
· Buyers have demand but no short covering premiums seen at this time, quality will be a driver to bid structures
Sales Recommendations
· Will be critical to have composite samples graded for marketing plan on durum as grades will range from #1 CWAD to feed
· Initial supply push covering off first trains as producers choose to move durum with pulse market issues front and center
· Buyers have been getting creative with spreads and reference grades, be sure to have this defined before hedging
· 2016 & 2019 also had quality challenges, watch for quality spec discounts in addition to grade discounts
· Still many moving pieces to this years durum market, please contact your Know Risk consultant for individual farm plan
CGC Week 7 Statistics
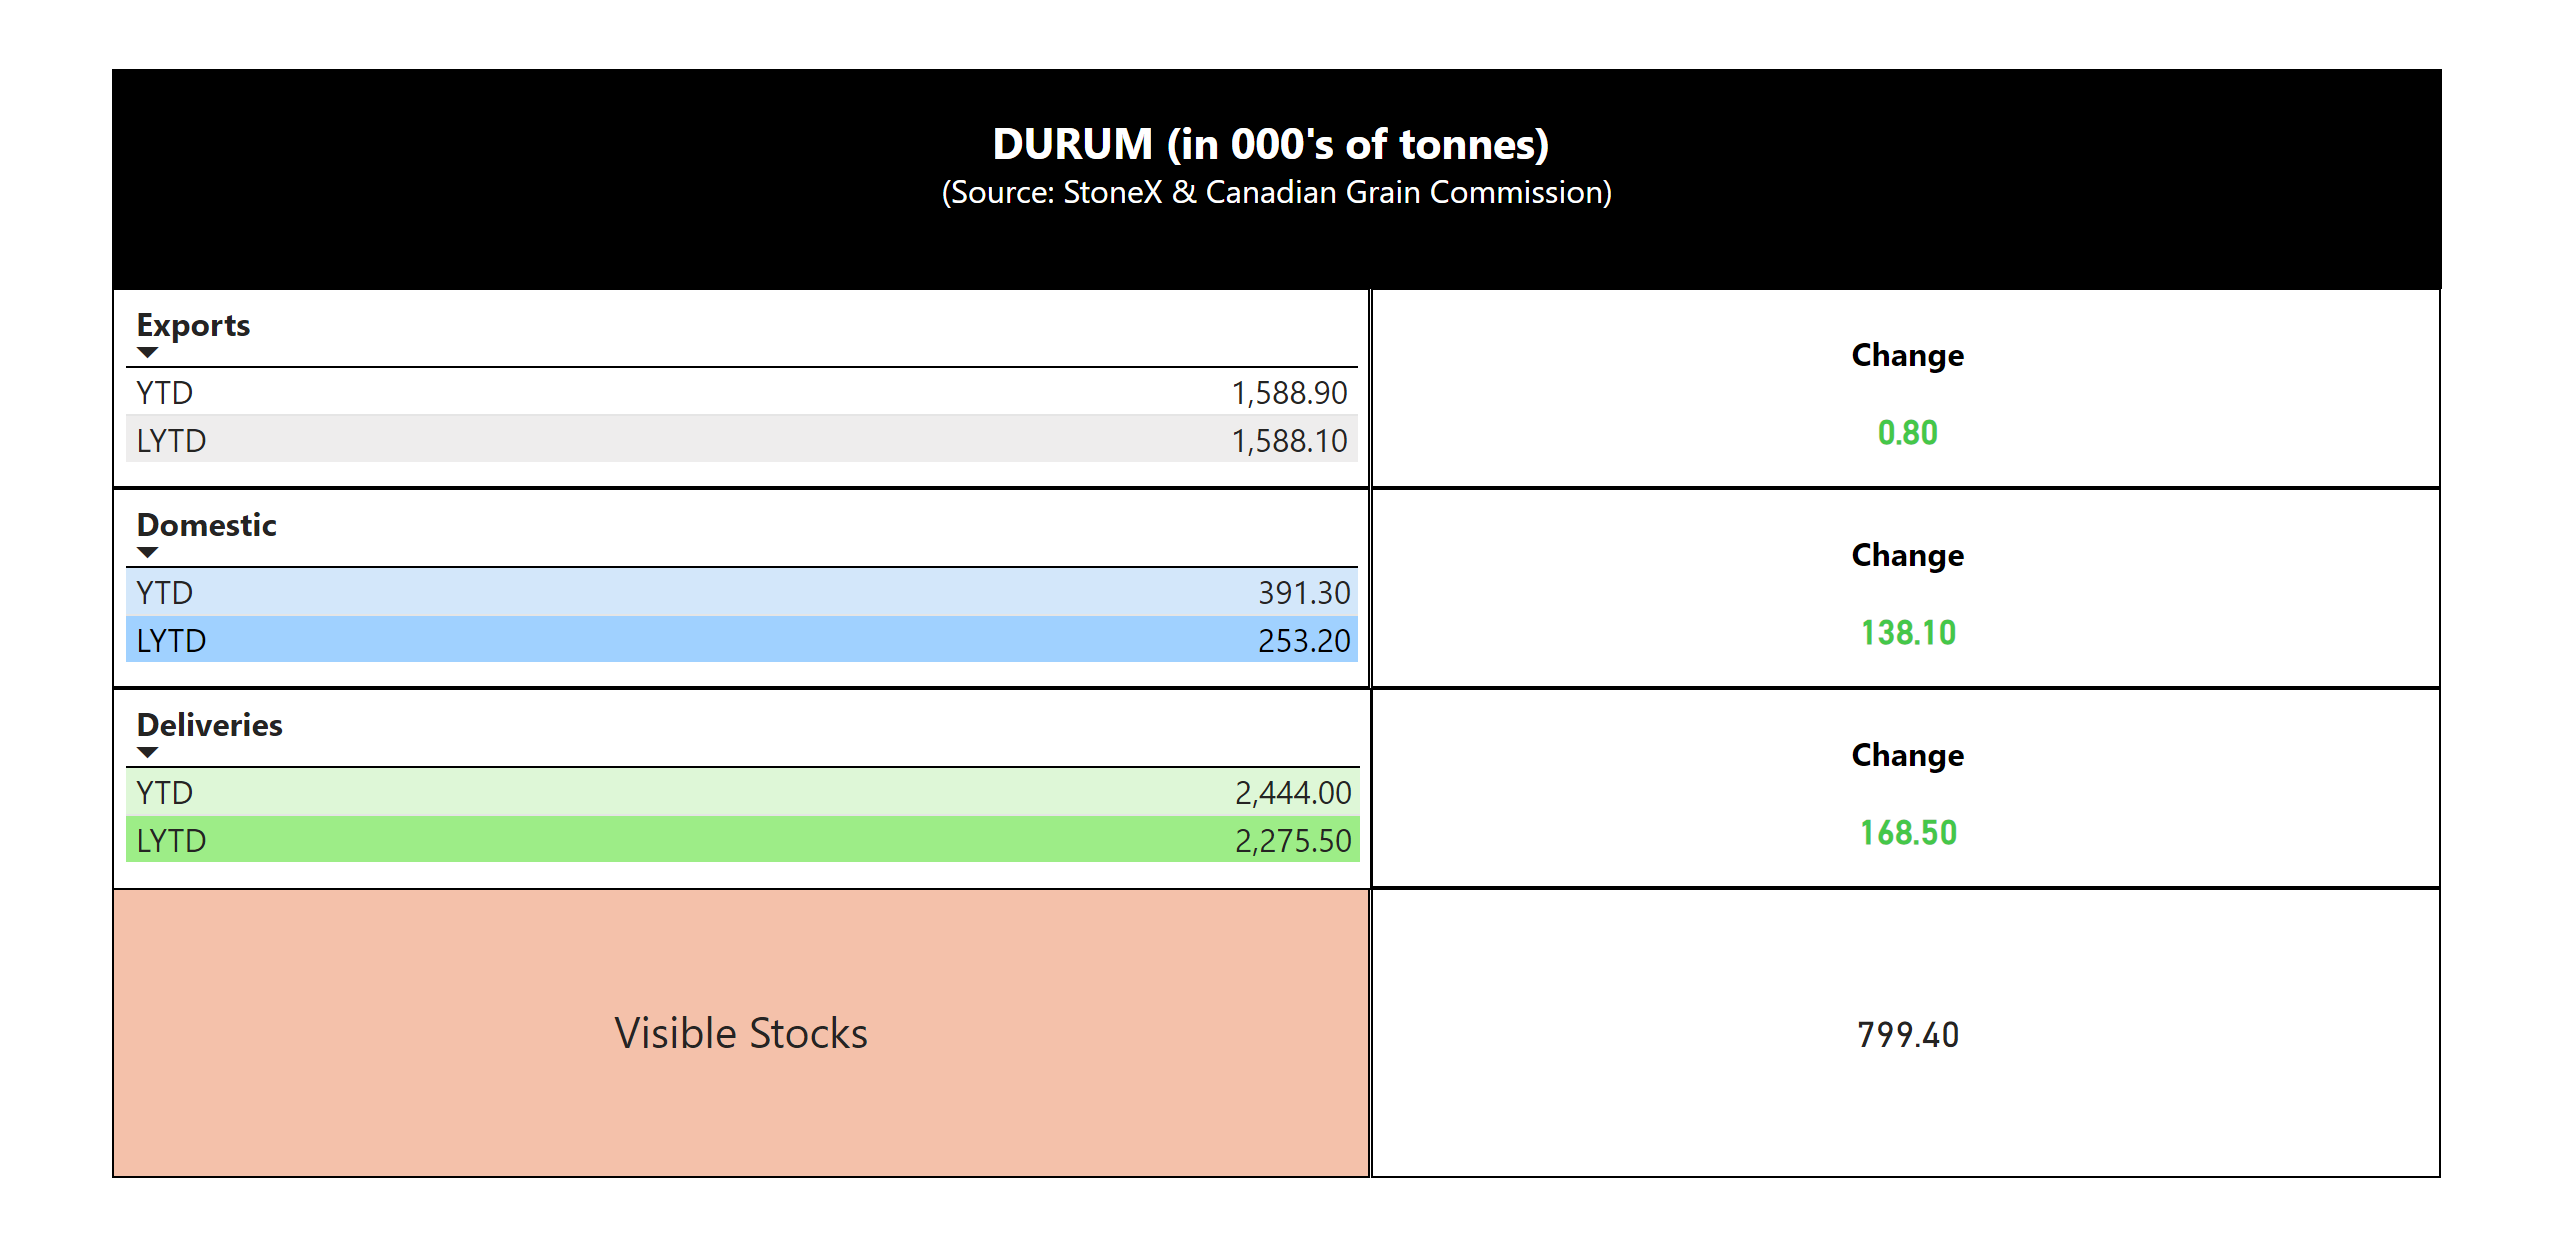
Chart of the Month
Oats
Market Summary
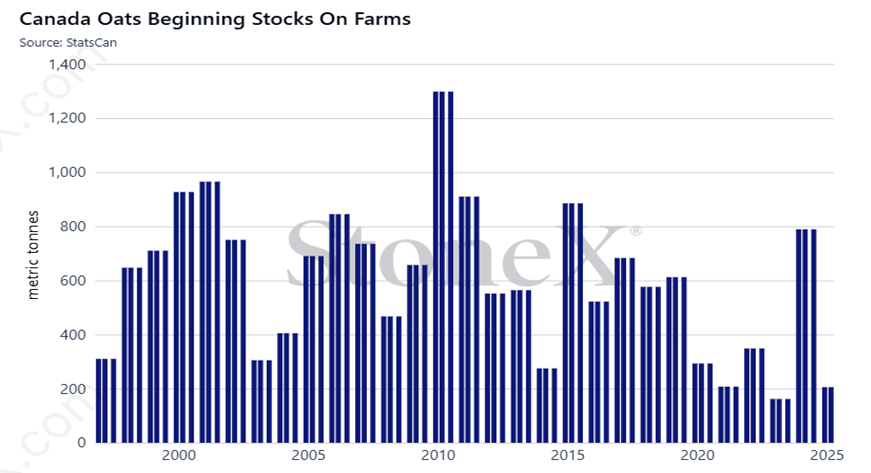
· Stats Canada released the July 31st stocks report estimate at 507,000 MT vs 670,000 MT in 2024
· Yield reports have held strong and generally of high milling quality, rain delays have also downgraded quality in certain geographies
· Bids remain soft at this time, as exporters have the bid with end users / processors well covered for nearby and deferred windows
· Exports are marginally below last year, full year pace at 1.388 MMT against full year benchmark of 1.5 MMT
· Visible stocks are comfortable at 377,200 but also encouraging to see 123,400 MT in export position
Sales Recommendations
· Line companies remain flat as producers look for a delivery outlet with yields above expectations
· Anticipate bids will stay flat until we see export demand, producer hedge pressure will dictate upside potential
· Bid structures should also start to build in a carry, if you can store also look at bids in deferred windows
· If you have a 2025 defined deliver by date, be proactive and get hedges on to capture that delivery window
· Have new crop cost of production estimates worked back to break even per bushel as timing can be sensitive on new crop bids
CGC Week 7 Statistics
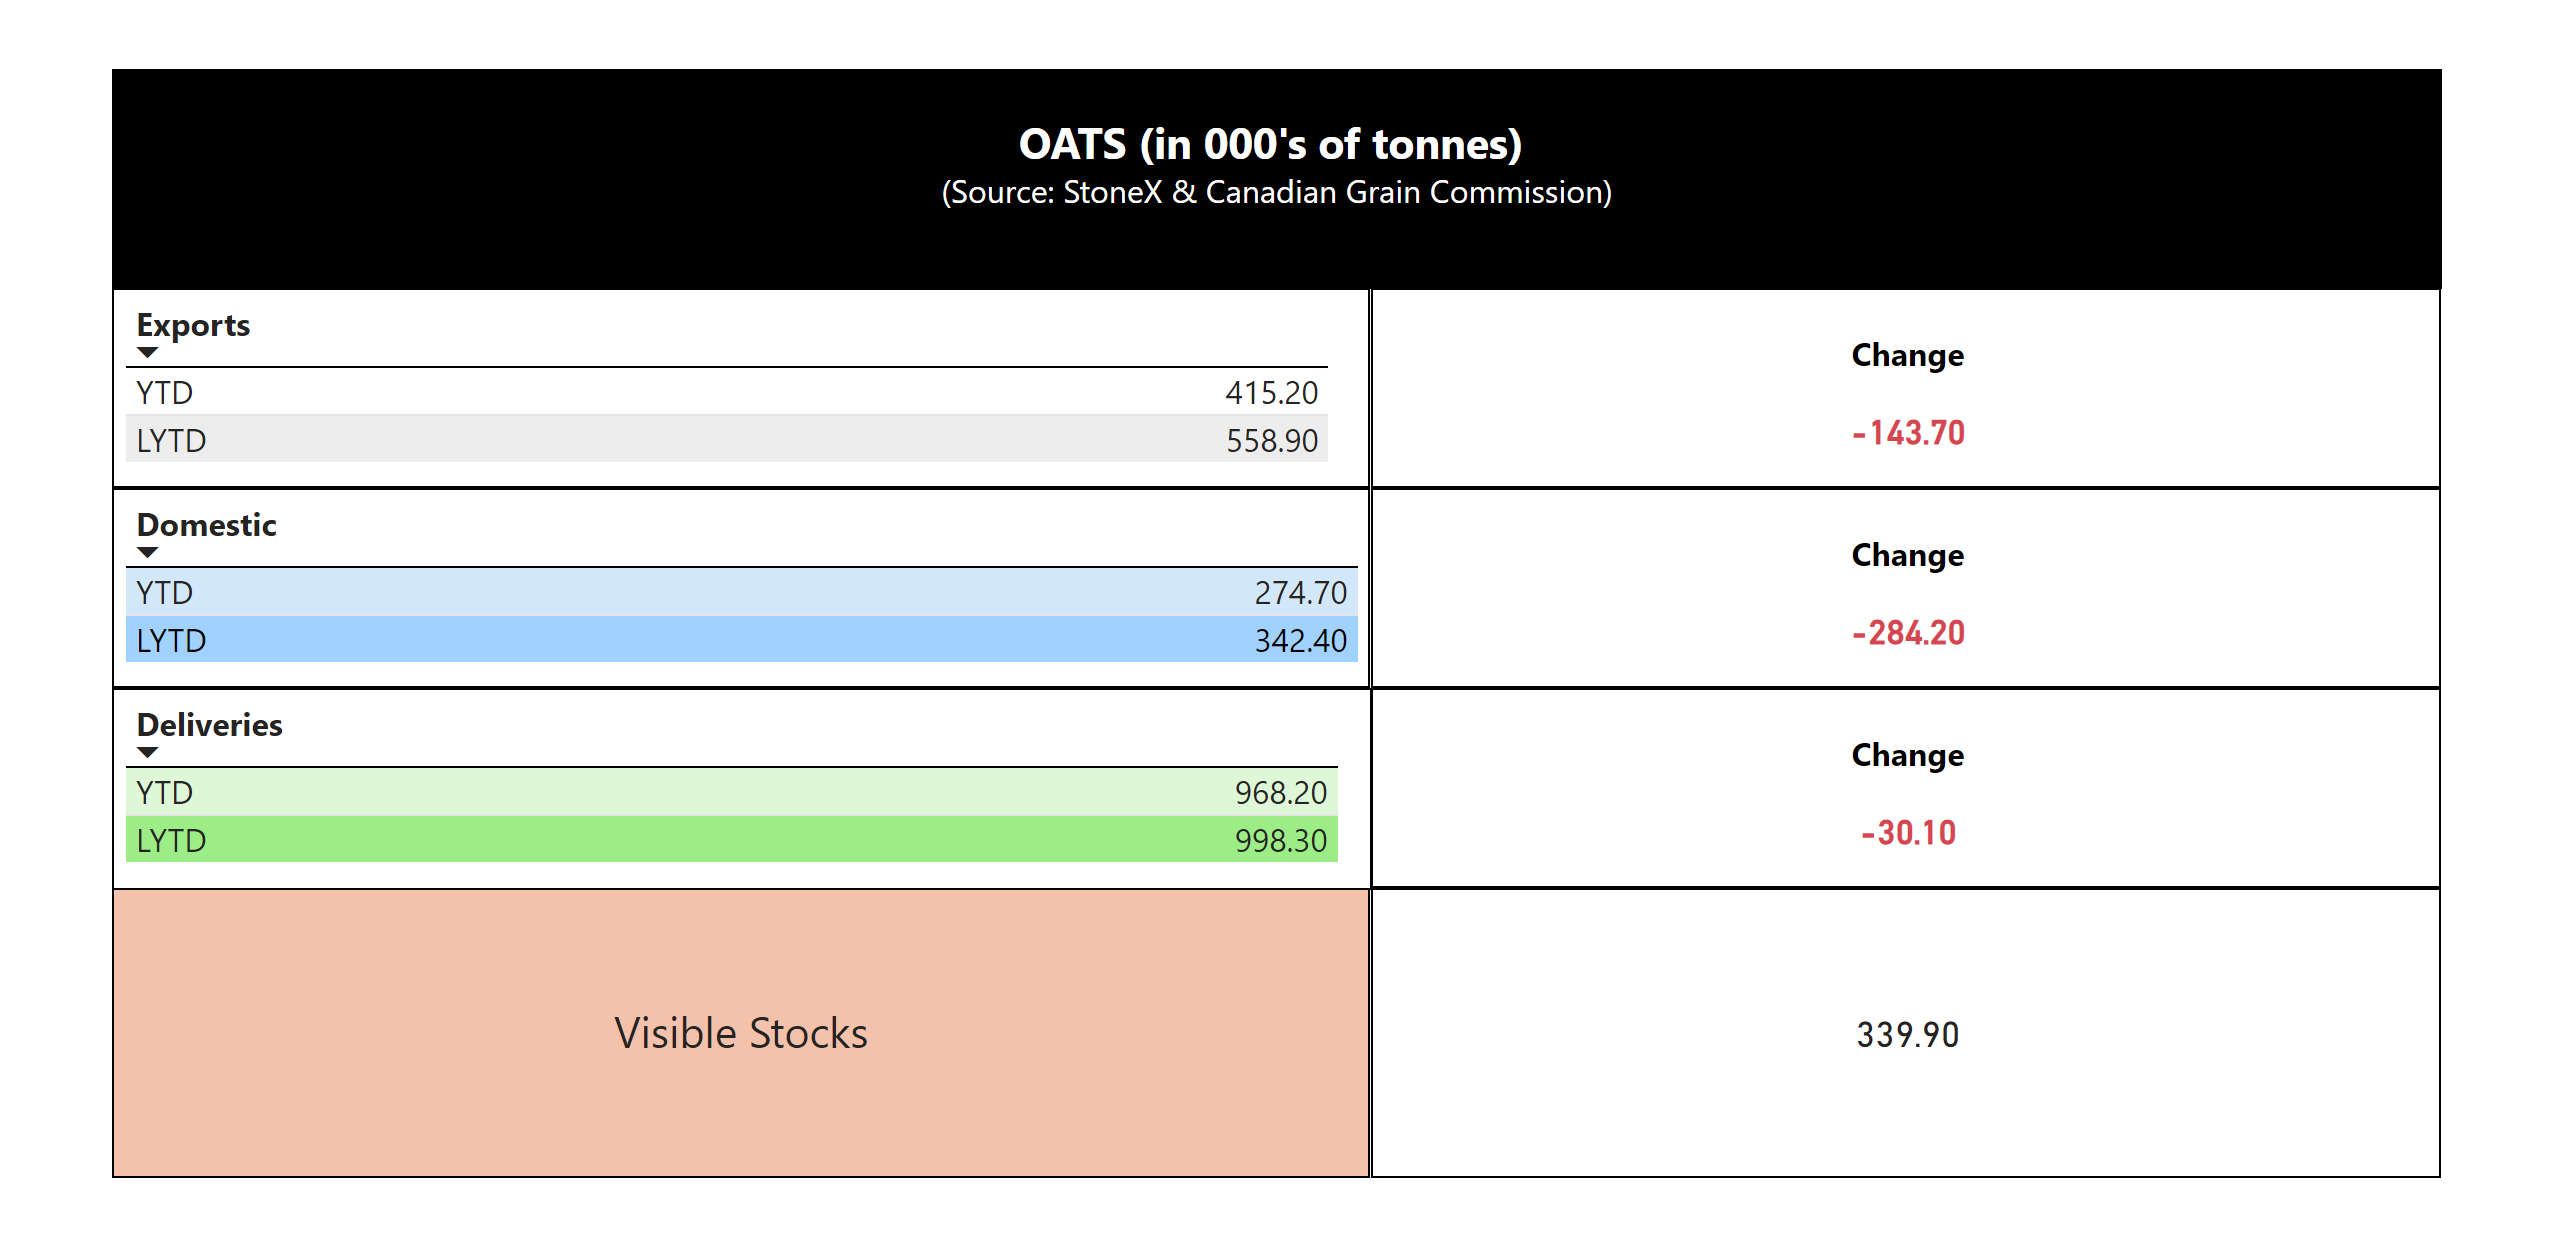
Chart of the Month
Peas
Market Summary
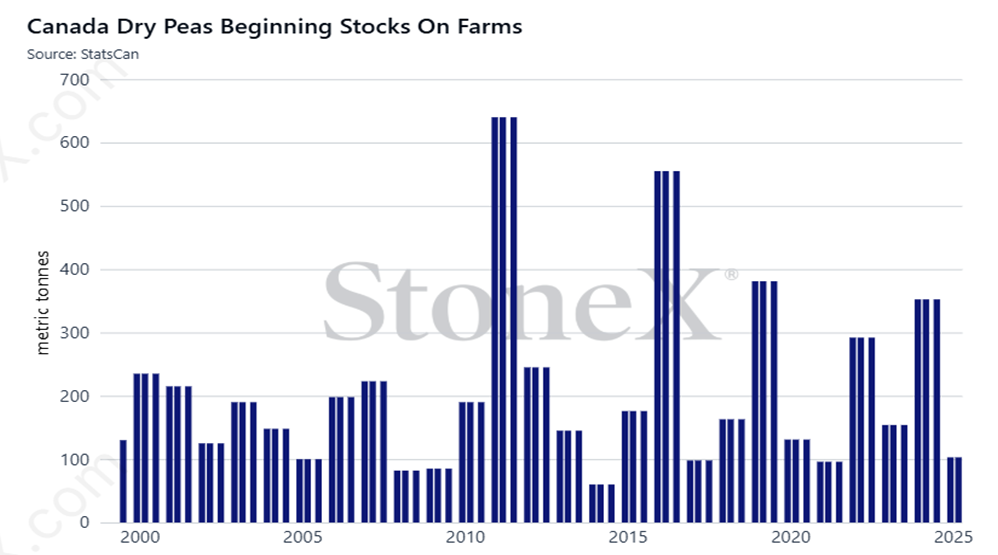
· Stats Canada released the July 31st stocks report estimate at 489,000 MT vs 299,000 MT in 2024
· Pea bids have bounced off harvest low, but remain muted as exports to China are unlikely to reappear this crop year
· Producer deliveries have slowed to 35,600 MT last week and YTD 864,000 MT vs. 1.044 MMT prior crop year
· Exports held in relatively well for now, with YTD 457,700 MT vs. 582,700 MT but also only 112,000 MT in export position now
· Bids have done their job grinding lower to slow producer selling, will buyers take a spec long here or await fresh demand
Sales Recommendations
· We have seen supply push environments before, harvest selling & delivery pressure has subsided
· Green peas maintain a premium over yellows, but that demand is also being covered off
· Buyers are also looking for samples ahead of deliveries or any new contracting opportunities
· Line companies are actively buying again, so great signal to continued exports, although anticipate smaller volumes
· Work back break even per bushel on yellow peas to help quantity margins for early bin space, logistics and cash flow requirements
CGC Week 7 Statistics
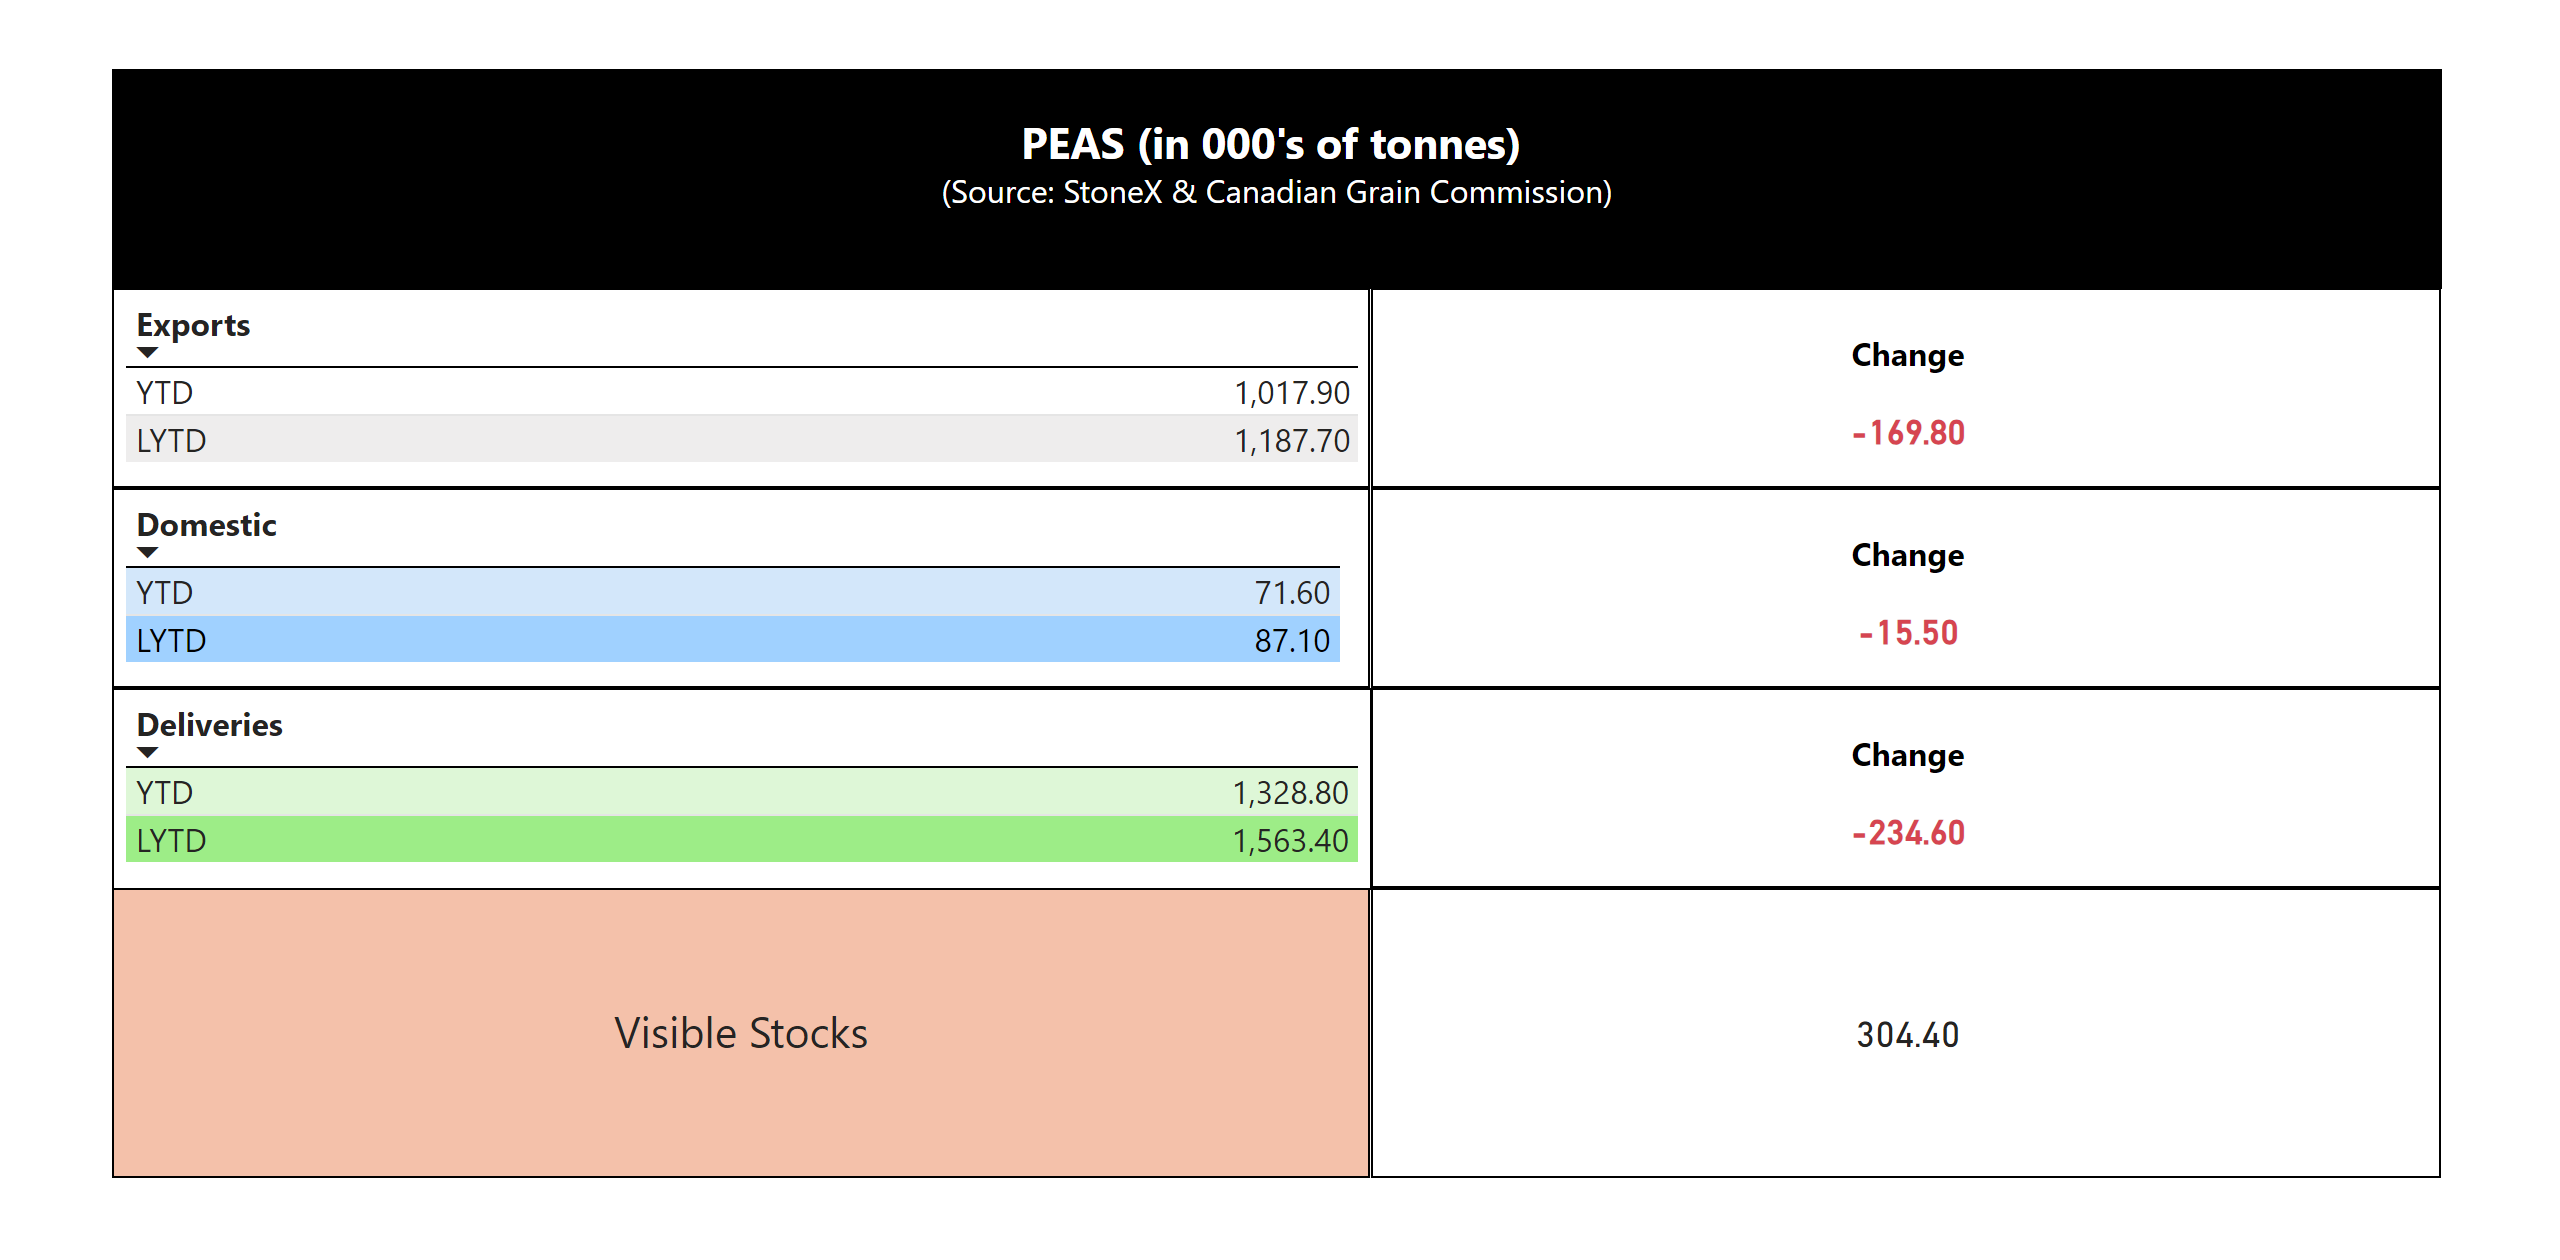
Chart of the Month
Barley
Market Summary
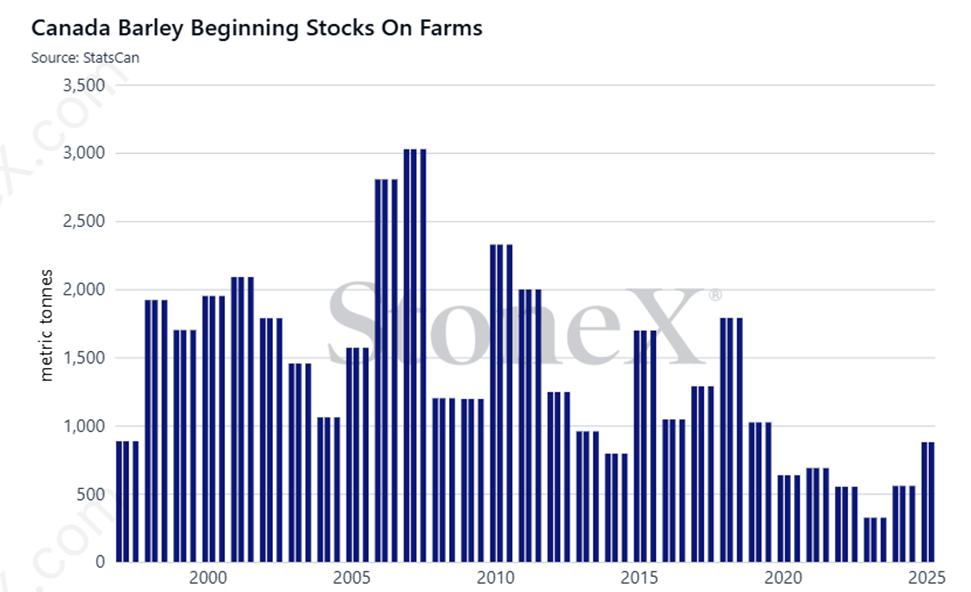
· Stats Canada released the July 31st stocks report estimate at 1.249 MMT vs 1.152 MMT in 2024
· Feed barley bids remain under pressure as buyers have great coverage and soft demand at this time
· Most maltsters remain on sidelines awaiting completion of harvest, hard to anticipate prices firm with lots of quality & volume to select
· Harvest deliveries were heavy at 955,100 MT vs. 598,400 MT last year keeping visible stocks also high at 668,100 MT
· Domestic market should post a carry in bid structures now, as they will want to push fresh hedges into the JFM 2026 window
Sales Recommendations
· Feed Barley– Bids will remain under pressure with harvest activity as initial yield reports will have space at a premium
· Anticipate bids can firm post harvest but will need to be looking at deferred delivery windows
· Would hedge feed barley for JFM 2026 If margin objectives are met
· Malt Barley– If you have opportunity to hedge FOB Farm with maltster, would do that prior to demand fading away
· IF you have existing malt contracts, send samples ASAP to allow maltsters to grade and potentially bid on the balance of production
CGC Week 7 Statistics
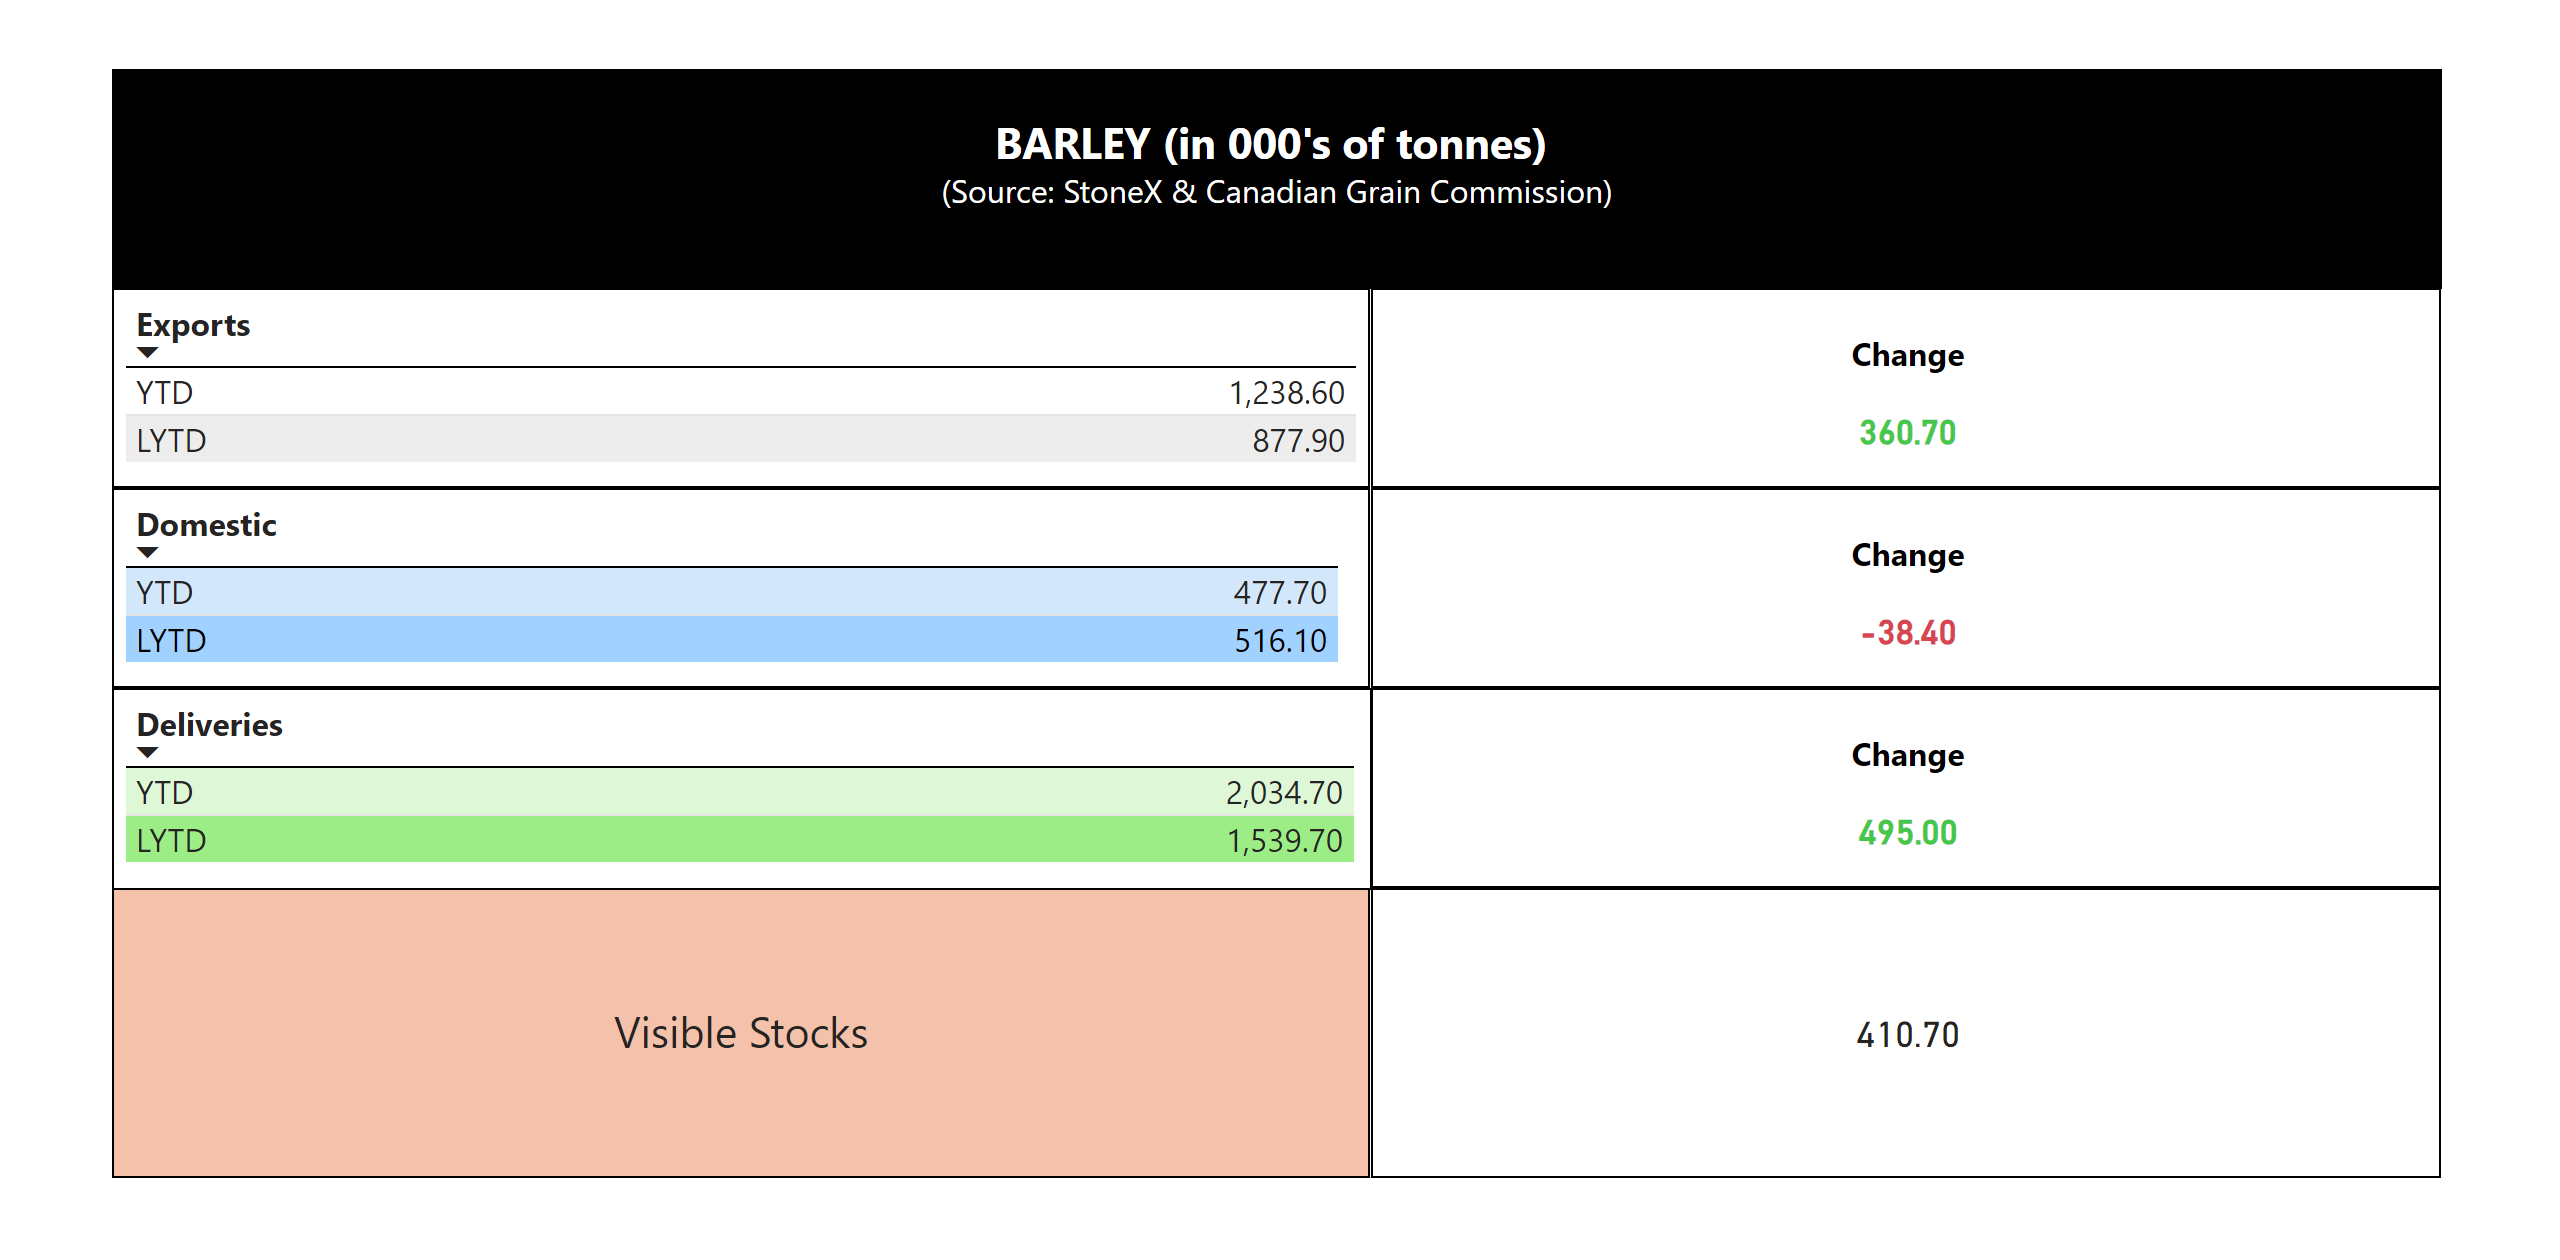
Chart of the Month
Flax
Market Summary
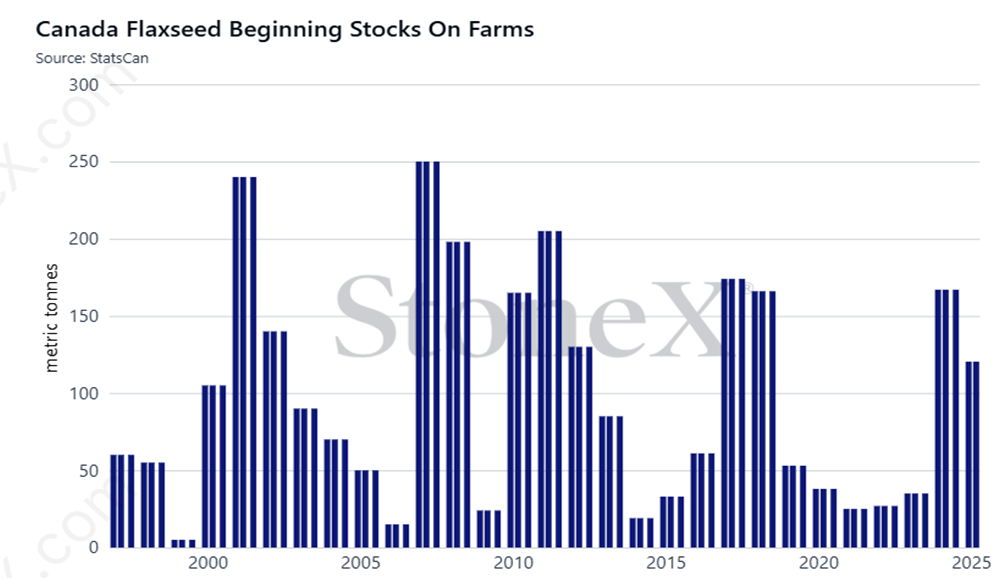
· Stats Canada released the July 31st stocks report estimate at 134,000 MT vs 164,00 MMT in 2024
· Visible stocks are lower at 20,000 MT awaiting new crop supplies, still very comfortable against quiet exports and domestic use
· Initial yield & quality reports are good, bids are mixed but shrugged off general selloff, also hard to anticipate rally in bid structures
· Exports will be a major feature for the crop year, can we see some tonnage shipped to EU, although minimal still a good signal
· Anticipate producers to store flax vs harvest movement needs
Sales Recommendations
· No changes from August report for hedge recommendations for old crop or new crop
· Would suggest to be hedging new crop flax once production levels are confirmed, look to end users for premium bids vs. line companies
· If your flax is glyphosate free, there could be a premium as this is a fairly new dynamic for USA destinations
· Know your instore grades and specs, seeing some max dockage specs that are now a restraint on some potential delivery locations
· Previous recommendation to hedge 5 to 10 bushels per if FOB and AOG is available
CGC Week 7 Statistics
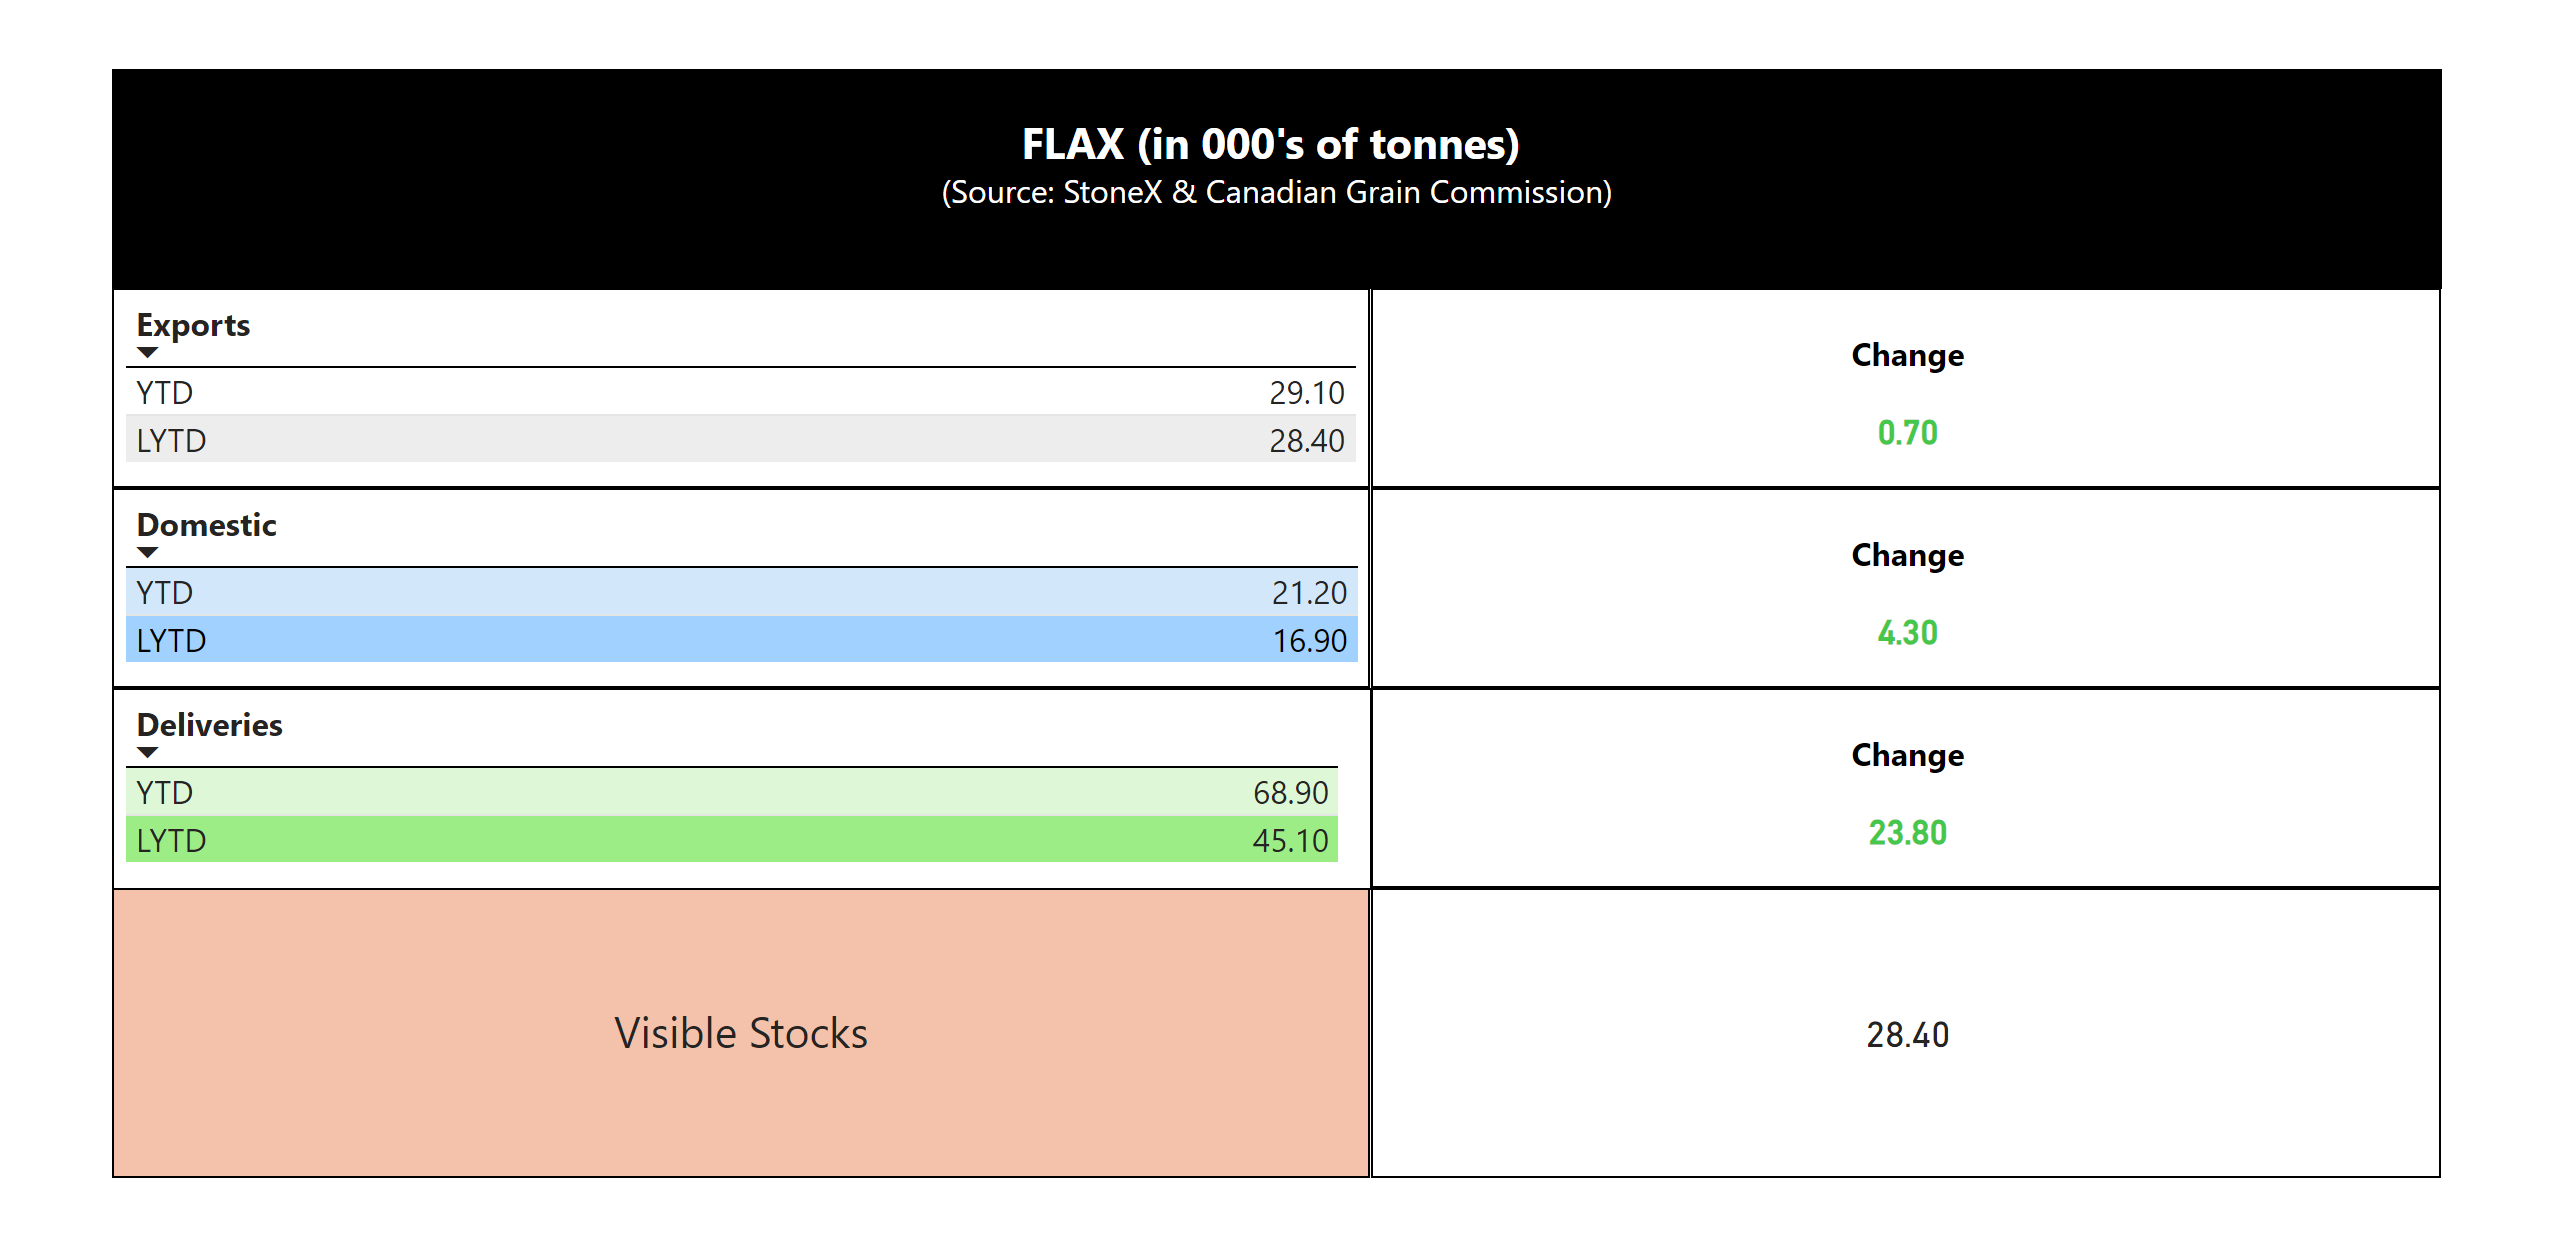
Chart of the Month