As markets move into the second half of 2026, North American currencies are starting to follow a different path from the one seen earlier in the year. Shifting monetary policy expectations, along with potential progress in Middle East negotiations, could remain key drivers for the USD, CAD, and MXN over the coming months.
In this environment, Canadian dollar and Mexican peso have struggled to make a clear recovery against a US dollar that continues to show some strength. If confidence in the USD remains resilient during the second half of the year, both USD/CAD and USD/MXN could maintain more visible upward pressure over the medium term.
What is the stance of central banks?
At the time of writing, North American central banks are starting to show important differences in their monetary policy outlooks. Bank of Mexico still holds the highest interest rate in the region at 6.5%, although it has already been cutting from the 7.00% level seen at the start of the year. Even so, the easing process has been gradual, and for now, the institution appears to be moving more cautiously before making any further adjustments.
Bank of Canada, meanwhile, remains the most neutral central bank in the region. Since October 2025, it has not changed its interest rate, which remains at 2.25%, accumulating five consecutive decisions with no change. This reflects a stance focused on waiting for new data before making any major shift in monetary policy.
Federal Reserve has also kept its rate stable at 3.75%, but its outlook is beginning to look different. Unlike Banxico and the Bank of Canada, the Fed has started to show signs of a more restrictive stance, with the possibility of new hikes before the end of 2026. This shift could continue to support the US dollar against its main regional peers.
North America interest rate table 2025 – 2026

Colors: From green to red. Green represents higher rates and red represents lower rates in each country.
Source: Data - Tradingeconomics
North America interest rate chart 2025 - 2026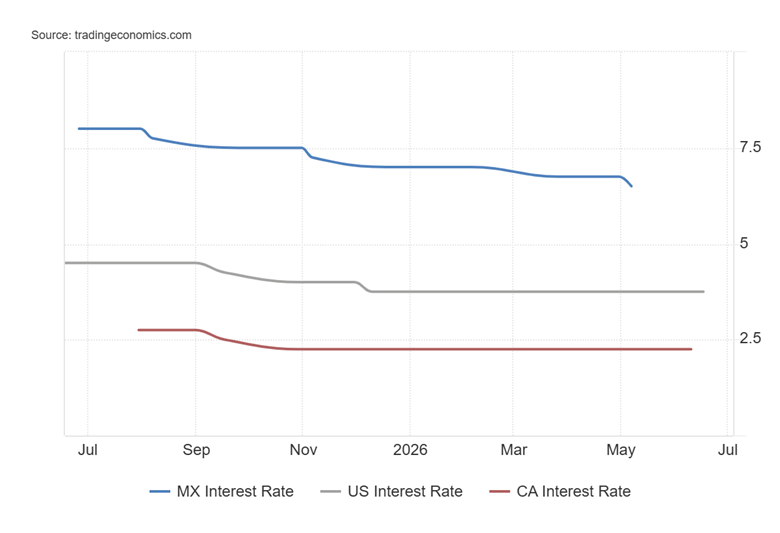
Source: Tradingeconomics
Upcoming central bank decisions could help define the direction of North American currencies during the second half of the year:
- Bank of Canada kept its rate at 2.25% on June 10 and made it clear that the economy is still facing a complicated mix of slower growth and inflationary pressures, partly due to high energy prices. For now, this keeps the central bank in a wait-and-see position.
- Bank of Mexico cut its rate from 6.75% to 6.5% on May 7, but it also stated that this move closed the cutting cycle that began in 2024. This leaves Banxico in a more neutral phase, where it will likely continue to monitor inflation before making any new moves.
- In contrast, the Federal Reserve kept its rate at 3.75% on June 17, but the new dot plot showed that more participants now expect the rate to move above 4.00% before the end of 2026. In addition, comments about inflation in the United States reinforced the idea that new rate hikes could arrive as early as September.
With this in mind, and based on recent central bank messages, inflation remains one of the most important factors for anticipating the direction of monetary policy. The key now is to assess how close or far each economy is from its target, as this can either confirm the current stance of each central bank or offer clues about possible changes in upcoming decisions.
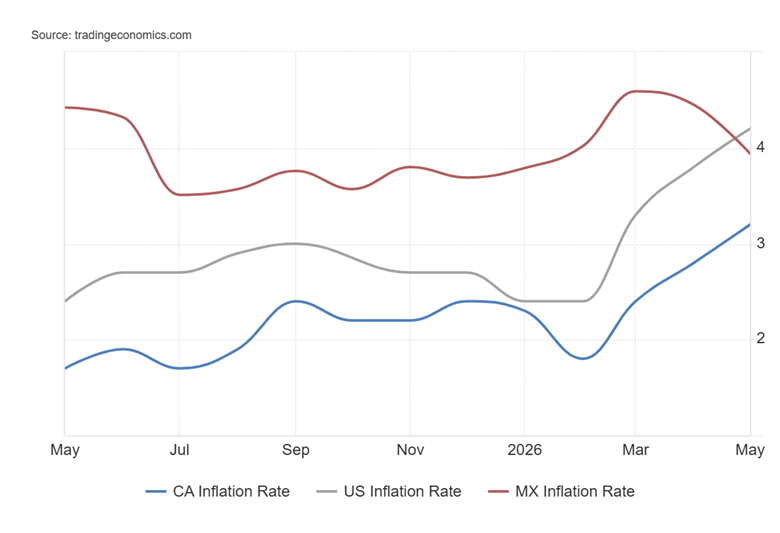
In Canada, inflation has risen to 3.2% from the 1.8% recorded in February, moving above the 2.00% target. In Mexico, inflation has slowed to 3.94% in May, below the March peak of 4.59%, although it remains above the 3.00% target. In the United States, by contrast, inflation has continued to accelerate more than expected, reaching 4.2% year-over-year in May, well above the 2.4% seen in February and still far from the 2.00% target.
North America inflation performance 2025 - 2026
Source: Tradingeconomics
These figures leave a mixed picture. Mexico is showing some moderation in inflationary pressures, while Canada and, especially, the United States continue to move further away from their targets. This reduces the room for a more flexible monetary policy stance from the Fed and the Bank of Canada over the coming months. However, the picture looks different in the United States, where markets are already starting to price in possible rate hikes. Banxico and the BoC, meanwhile, still appear to have room to keep a neutral stance in their next decisions.
Overall, these differences could continue to shape the relative strength of North American currencies. Mexico still has the highest rate in the region, which continues to support part of the peso’s appeal. However, without a more aggressive stance from Banxico, that appeal could lose strength against a more restrictive Fed. In Canada, the lowest rate in the region reduces the relative attractiveness of the Canadian dollar, especially compared with a US dollar supported by expectations of higher rates, a more attractive bond market, and its role as a global safe-haven asset.
This scenario suggests that the US dollar could continue to show greater strength against the Mexican peso and the Canadian dollar during the second half of 2026. If the Fed maintains a more restrictive stance and markets continue to price in higher rates, dollar-denominated assets could regain appeal due to their perception of stability and security within the region. In addition, persistent inflationary pressures in the United States reduce the room for monetary easing and reinforce the USD’s relative advantage. In this environment, buying pressure in USD/CAD and USD/MXN could become more relevant over the medium term.
Is the Middle East conflict still weighing on markets?
During 2026, one of the most relevant geopolitical events has been the escalation of the conflict in the Middle East. Since late February, tensions between Israel, the United States, and Iran have affected market confidence, increased the risk premium, and generated important moves across financial assets.
In this context, the US dollar has played an important role. During moments of greater concern, especially when risks around the Strait of Hormuz increased, the USD once again acted as a liquidity-driven safe-haven currency. This was reflected in DXY, which moved consistently above the 97-point area in early March as tensions intensified.
However, the dollar has also weakened when the conflict has shown signs of easing. One example was June 11, when the cancellation of US attacks and progress in negotiations reduced part of the safe-haven demand. At that point, DXY began to move back below the 100-point area, showing that the conflict has been an important factor for dollar demand, beyond the Federal Reserve’s monetary policy alone.
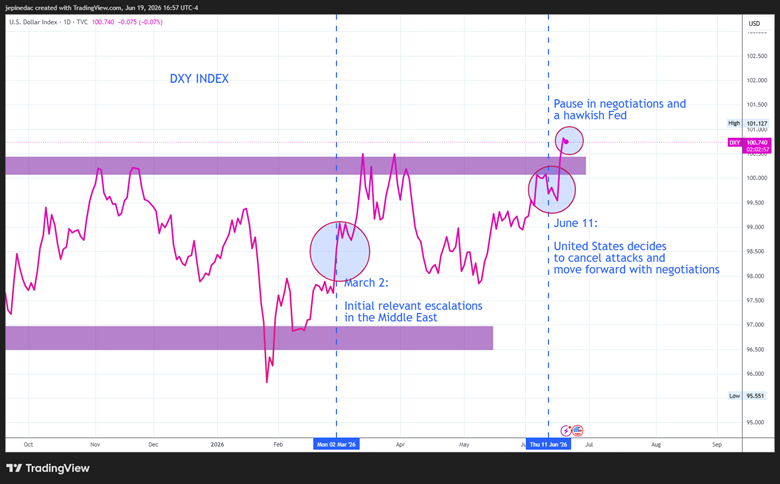
Source: Data TVC - Tradingview
At the time of writing, negotiations in the Middle East continue to move forward, although there are still doubts over when the situation in the region could fully normalize. If a clearer diplomatic solution takes shape, the dollar could lose part of its safe-haven appeal over the medium term. This could limit part of the support the USD receives from a more aggressive Federal Reserve and open the door for the Mexican peso to regain some appeal. Under this scenario, USD/MXN could enter a phase of greater indecision over the coming months.
For Canada, the relationship is more complex. Around 18% of Canadian exports at the end of 2025 were tied to the oil market, meaning that a drop in crude prices, driven by potential progress in Middle East negotiations or more concrete peace agreements, could weigh on the country’s economic stability during the second half of the year.
This helps explain why CAD has steadily lost value against the USD toward the end of the first half of 2026, a move that has not been seen with the same intensity in the MXN. For that reason, lower safe-haven demand for the dollar would not necessarily translate into a strong recovery for the Canadian dollar, and buying pressure in USD/CAD could remain relevant.
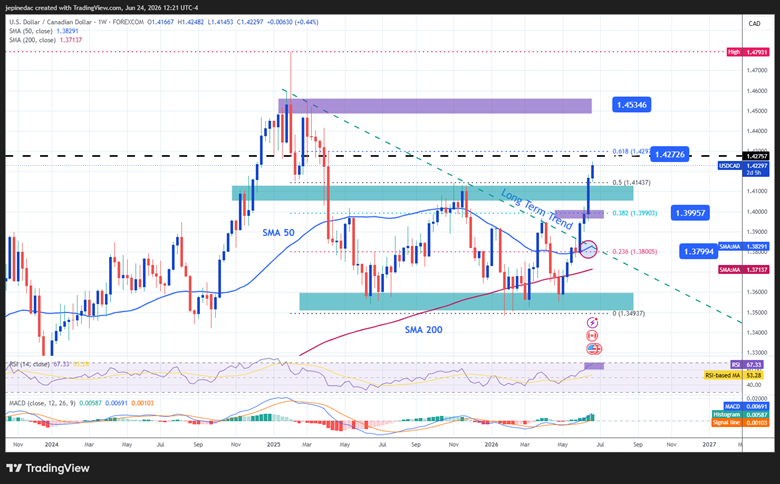
USD/CAD breaks a long-term trend
Source: StoneX, Tradingview
- A relevant bullish move emerges: Since the first days of June, USD/CAD has managed to break a bearish trendline that had remained the dominant technical pattern since January 2025. This move reflects an important shift in the weekly chart structure, with bullish pressure starting to dominate recent price action. If buying strength holds, the pair could move toward a more defined bullish bias and even develop a new upward trendline over the coming months.
-
- RSI: Line remains above the 50 neutral level, suggesting that bullish impulses over the last 14 weeks have gained relevance. This supports the presence of a potential buying bias in the market. However, the indicator is also approaching the overbought area near 70, meaning short-term bearish corrections cannot be ruled out if signs of excessive buying pressure begin to appear.
-
- MACD: MACD histogram remains above the neutral 0 area, reflecting bullish dominance in the moving average structure. If this behavior continues, the buying bias could remain relevant for USD/CAD.
-
- 1.42726: Important resistance located near relevant pullback areas from the first months of 2025 and aligned with the 61.8% Fibonacci level. Sustained moves above this level could strengthen the bullish bias and open the door to a more aggressive upward trendline over the coming months.
-
- 1.39957: Nearby barrier marked by the 38.2% Fibonacci level. This area could act as an important zone to watch in case of short-term bearish corrections.
-
- 1.37994: Relevant support located near the previous dominant bearish trendline and the 50-period moving average. A return to this area could signal a lack of direction and open the door to a phase of greater indecision or sideways movement, weakening the possibility of a sustained long-term bullish move.
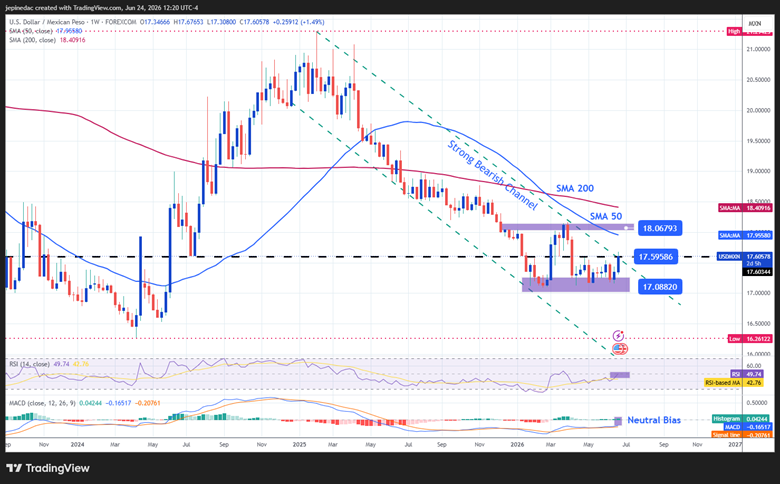
USD/MXN struggles to find direction
Source: StoneX, Tradingview
- Bearish channel begins to lose strength: Since the first days of January 2025, USD/MXN has maintained a consistent bearish channel, supported by the 50-period moving average crossing below the 200-period moving average, which confirmed an important selling bias. However, in recent weeks, US dollar strength has started to gain more influence, creating a phase of sideways price action in the short term. Although the pair has not yet broken out of the bearish channel, selling pressure has lost momentum, meaning the current structure is starting to show the risk of transitioning into a possible sideways range over the coming months.
-
- RSI: Line has started to flatten slightly below the 50 neutral area, suggesting that the selling momentum seen in previous weeks has lost relevance. This dynamic reinforces a scenario of greater indecision in the medium term.
-
- MACD: MACD histogram remains very close to the 0 area, reflecting balance between the moving averages and a lack of clear direction. If this behavior continues, indecision could keep dominating USD/MXN price action.
-
- 18.06: Crucial resistance located near previous weekly highs, in an area that also coincides with the 50-period simple moving average and the Ichimoku cloud barrier. A breakout above this level could invalidate the dominant bearish channel and open the door to a more relevant buying bias over the coming months.
-
- 17.59: Nearby barrier that has acted as a neutral zone in previous years. Moves around this level could reflect a clearer phase of indecision and support the formation of a sideways range on the chart.
-
- 17.08: Main support located at the 2026 lows and currently considered the most important bearish barrier. A sustained break below this level would bring strength back to the selling bias and could extend the bearish channel over the next few months.
Written by Julian Pineda, CFA, CMT – Market Analyst
Follow him on: @julianpineda25