StoneX logo

Daily Natural Gas Market Update 2-16-24

By: Heather Wine, Senior Risk Manager - Energy

Daily Natural Gas Market Update
 
Heather Wine
Senior Risk Manager | (312) 373-8250
StoneX Financial Inc. - FCM Division
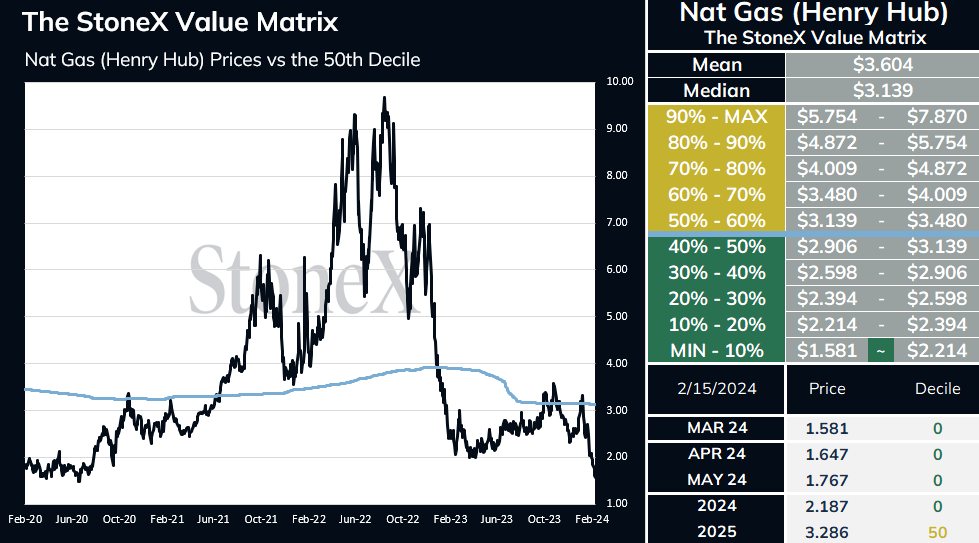
StoneX Value Matrix
image 90074
Source: StoneX Value Matrix, Bloomberg
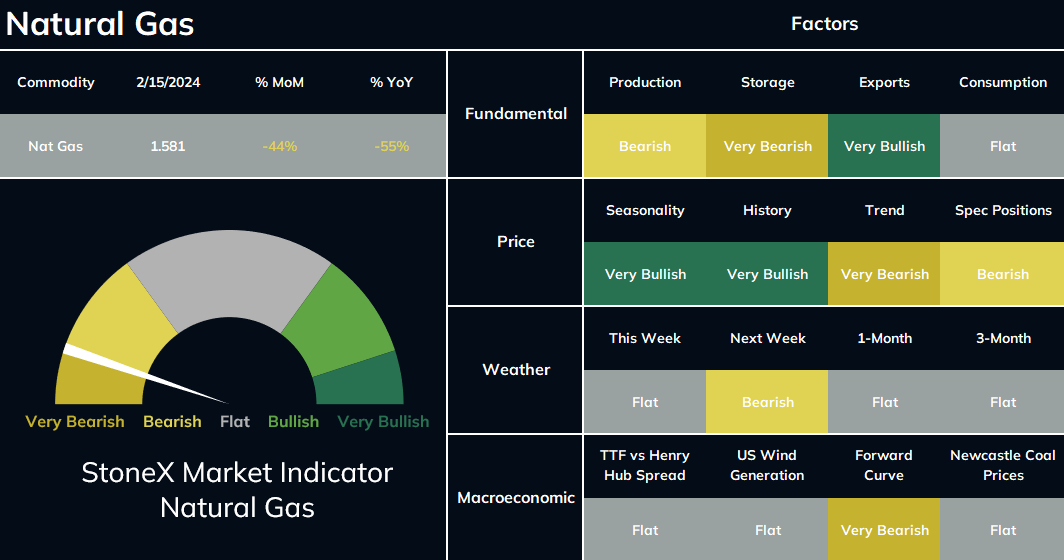
StoneX Market Indicator
image 90077
Source:  StoneX Market Indicator, Bloomberg
Fundamentals & Weather

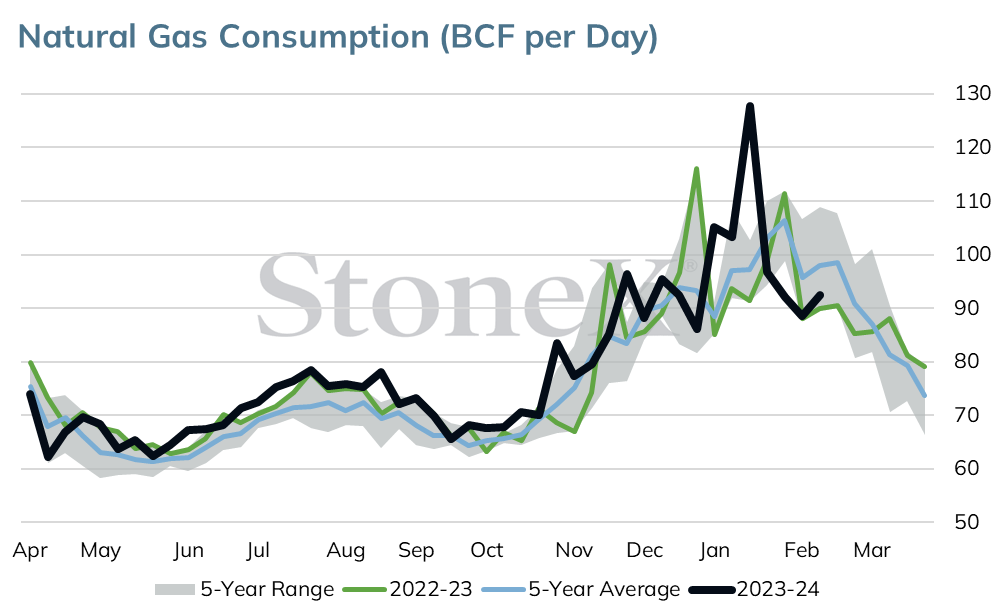
Prices declined yesterday as oversupply concerns were heightened following storage data that revealed a much smaller than expected withdrawal.  Declining heating demand expectations and near record output added to the downside.  Mar futures settled 2.8 cents lower at $1.581.  Prices have now fallen 24% over the last 8 sessions.  

image 90078
Source: Bloomberg, CME

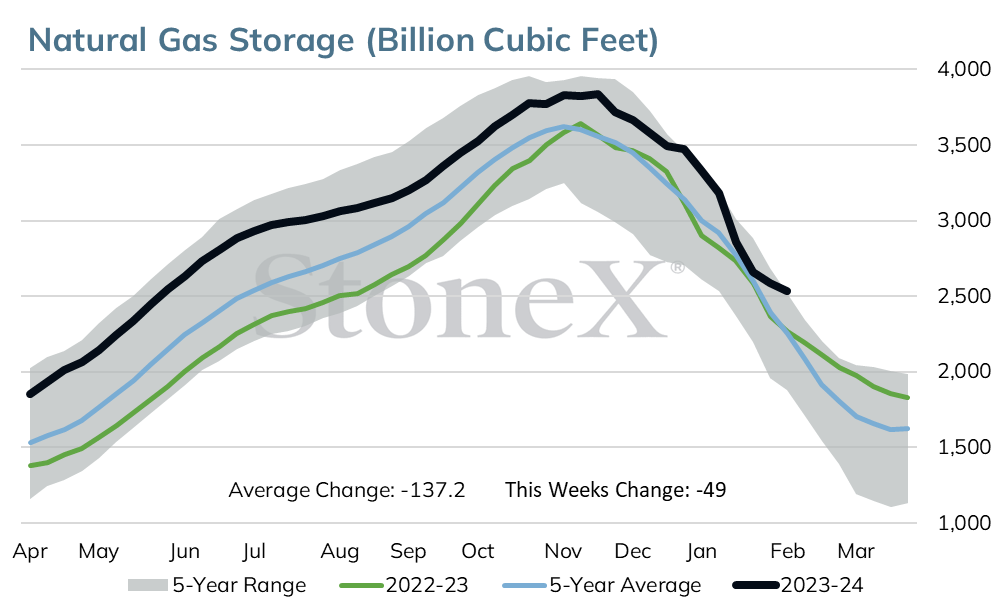
For the week ended Feb 9, stocks fell by just 49 BCF leaving gas in storage at 2.535 TCF.  The pull trailed expectations by 19 BCF and was well below the 5 yr avg of 149 BCF and the year ago draw of 117 BCF.  Stocks are now 348 BCF above the 5 yr avg and 255 BCF above last year. 

Storage models suggest further bearish storage data over the coming few weeks.   The week in progress is expected to see a draw in the 60-67 BCF range vs the 5 yr avg  draw of 168 BCF.  The week ending Feb 23 is expected to see a pull of 77 BCF vs the 5 yr avg draw of 143 BCF.  If correct, the surplus will grow by another 170 BCF over the next 2 weeks, pushing the 5 yr avg surplus to 500+ BCF. 

image 90079
Source: Bloomberg, EIA

Forecasts from Maxar continue to suggest an overall warm pattern for the next 2 weeks.  Brief rounds of cold are expected across the Rockies today.  The cold will move into the Eastern US this weekend, pushing temps to below normal levels. Temps will quickly warm back up early to mid next week with a chance for another round of cold for late next week. The next 2 weeks should see a lower than normal 333.5 HDDs. 


​​image 90080
Source: NOAA

Prices are actually trading higher this morning with the spot month up 3 to 4 cents.  Colder temps heading into the weekend are offering support

Technical Analysis
image 90081
Source: Bloomberg, CME

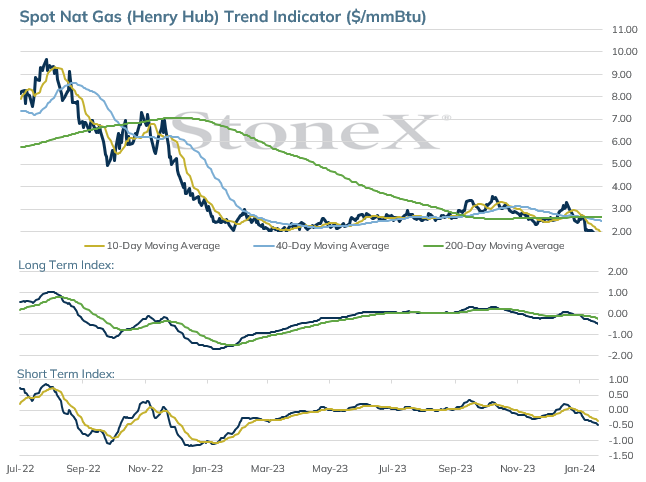
The spot March 24 natural gas contract has closed down eight consecutive sessions trading down to a new 3 ½ year low on Thursday at 1.573 before closing the day at 1.581, down .028.

There is still no sign of a bottom being in place with Thursday’s 1.573 low being near term support followed by monthly low support at 1.519 from March 2020.

60-minute chart trend line support beginning at the early-January high is currently near 1.450.

Daily RSI at 25.78 is in the oversold area but the RSI index can remain oversold for some time before a lasting low forms.  Volume has trended lower the past two sessions which could indicate an exhaustion low is forming.

Current weakness is expected to be the final price break before a post-winter seasonal low is set.  

Moving Average Alignment – Bearish 
Long Term Trend Following Index – Bearish
Short Term Trend Follow Following Index - Bearish

Relative Strength Index - 25.78

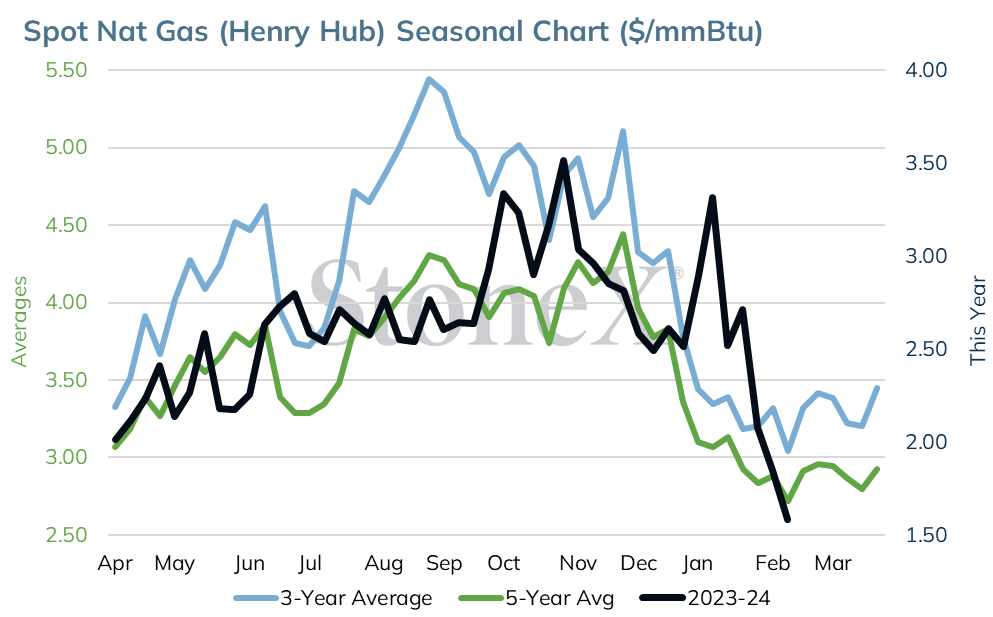
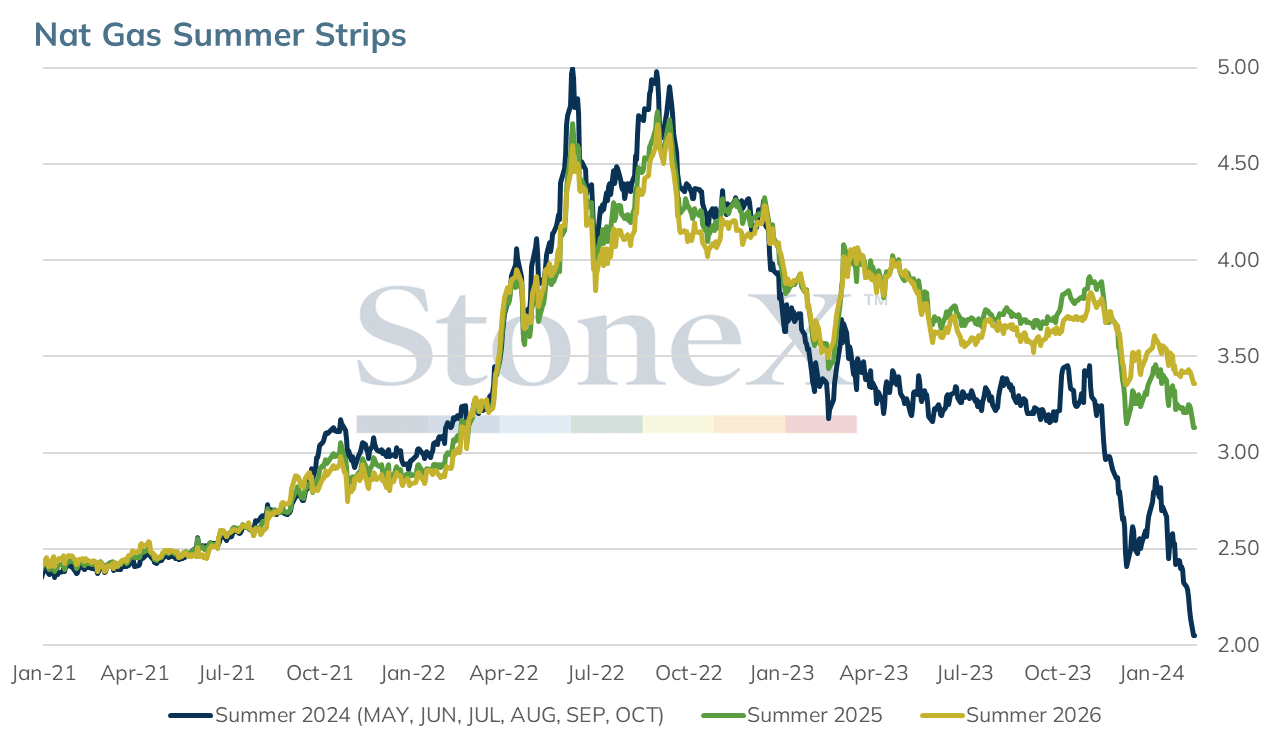
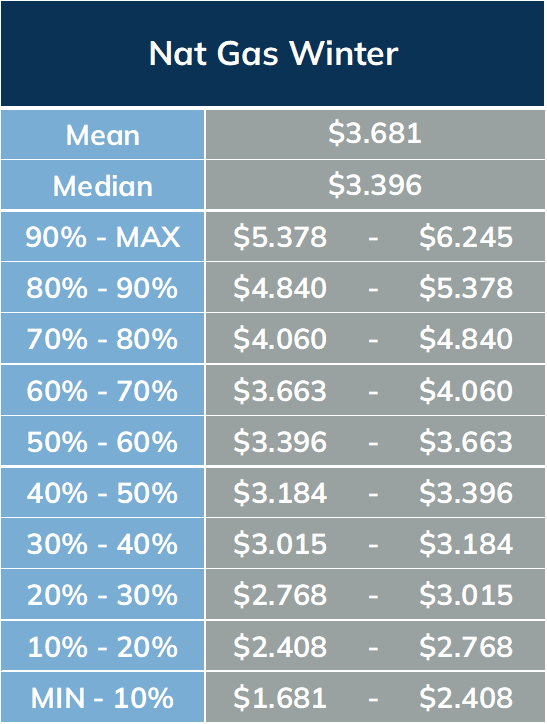
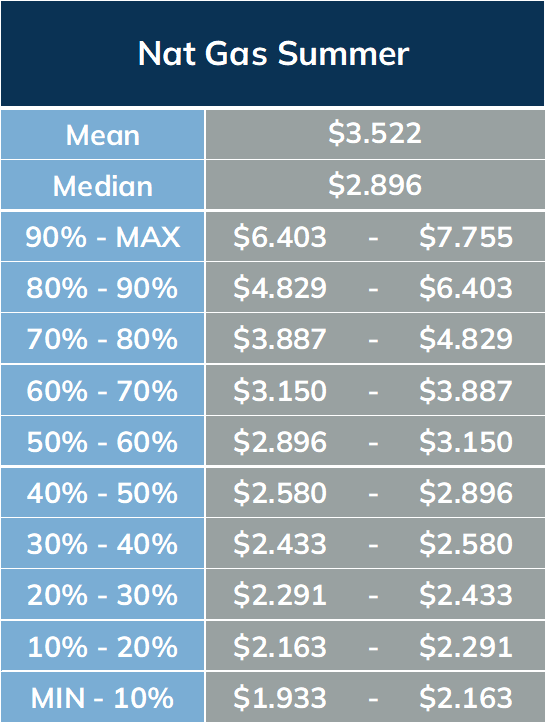
Seasonal Prices
image 90023
Source: Bloomberg, CME
image 90022
Source: Bloomberg, CME
image 90021
Source: Bloomberg, CME
image 89880
Source: Bloomberg, CME
image 89879
Source: Bloomberg, CME
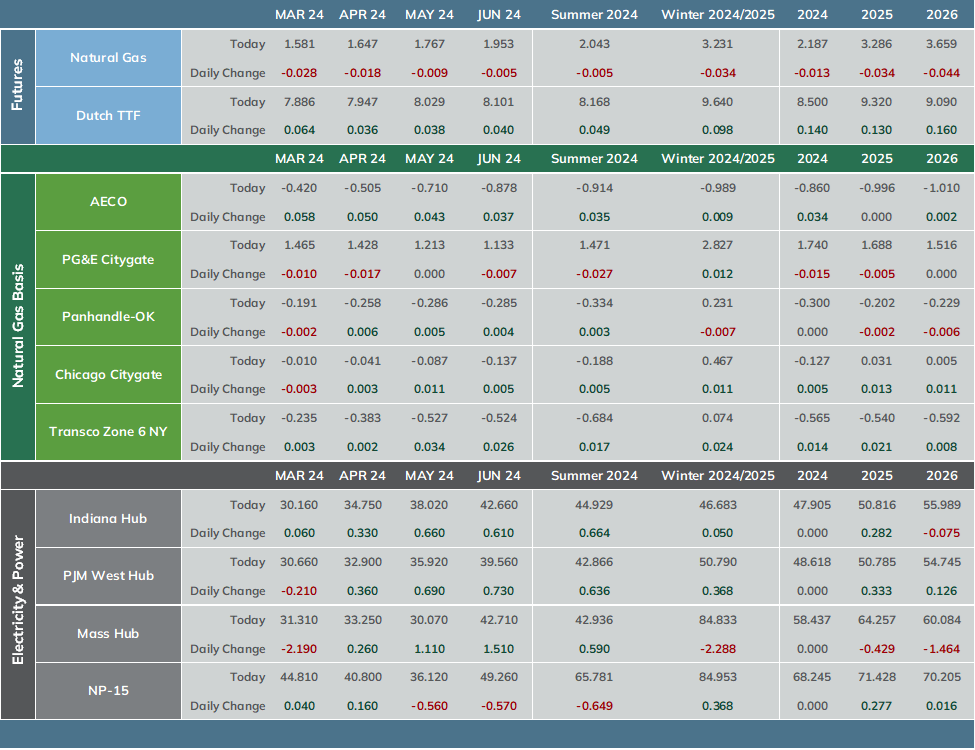
Forward Curve Pricing
image 90082
Source: Bloomberg, CME
 
Disclaimer

The StoneX Market Indicator provides an overall view of market sentiment for a commodity based on the quantification of fundamental, technical and historical market data related to that commodity.  Each factor is quantified by comparing data for the current period versus last year, versus the previous period, versus its history and versus the yearly average.  This quantification is converted to a number and summed together. The sum of all factors are reweighted by the 4-year decile of its history. The 4-year deciles redistribute the StoneX Market Indicator to obtain an equal share between the bullish and the bearish signals.  The StoneX Market Indicator History graphically represents each day’s actual very bearish to very bullish signal.  This history contains the sum of all factors, excluding weather forecasts.

The StoneX Value Matrix provides a measure of historical value by analyzing 4 years historical price data distributed into 10 deciles.  All of the years are weighted at 20% with the exception of the most recent year which is weighted at 40%. The prices are adjusted for inflation using the Producer Price Index (PPI).  

Reproduction or use in any format without authorization is forbidden. © Copyright 2024.  All rights reserved.


  • Energy

This material should be construed as market commentary and represents the opinions and viewpoints of the author, and does not reflect tailored advice associated with any specific account.


The views are current only through the date stated and are subject to change at any time based upon market or other conditions, and StoneX Group Inc. (“SGI”) disclaims any responsibility to update such views. Actual results, performance, or achievements may differ materially from those expressed or implied. Information is based on data gathered from what we believe are reliable sources. Past performance does not guarantee future results.


The StoneX Group Inc. group of companies provides financial services worldwide through its subsidiaries, including physical commodities, securities, exchange-traded and over-the-counter derivatives, risk management, global payments and foreign exchange products in accordance with applicable law in the jurisdictions where services are provided.


References to certain OTC products or swaps are made on behalf of StoneX Markets, LLC (SXM), a member of the National Futures Association (NFA) and provisionally registered with the U.S. Commodity Futures Trading Commission (CFTC) as a swap dealer. SXM’s products are designed only for individuals or firms who qualify under CFTC rules as an ‘Eligible Contract Participant’ and who have been accepted as customers of SXM.


StoneX Financial Inc. (SFI) is a member of FINRA/NFA/SIPC and registered with the MSRB. SFI is registered with the U.S. Securities and Exchange Commission (SEC) as a Broker-Dealer and with the CFTC as a Futures Commission Merchant and Commodity Trading Advisor. StoneX Financial (Canada) Inc. (SFCI) is registered in Canada and is a member of CIRO and CIPF. References to certain securities trading are made on behalf of the BD Division of SFI and are intended only for an audience of institutional clients as defined by FINRA Rule 4512(c). References to certain exchange-traded futures and options are made on behalf of the FCM Division of SFI. Wealth Management is offered through SA Stone Wealth Management Inc., member FINRA/SIPC, and SA Stone Investment Advisors Inc., an SEC-registered investment advisor, both wholly owned subsidiaries of SGI.

R.J. O’Brien & Associates, LLC (RJO) is registered with the CFTC as a Futures Commission Merchant and is a member of NFA.


StoneX Financial Ltd (SFL) is registered in England and Wales, company no. 5616586. SFL is authorized and regulated by the Financial Conduct Authority (FCA) (registration number FRN:446717) to provide services to professional and eligible customers including: arrangement, execution and, where required, clearing derivative transactions in exchange traded futures and options. SFL is also authorized to engage in the arrangement and execution of transactions in certain OTC products, certain securities trading, precious metals trading and payment services to eligible customers. SFL is authorized and regulated by the FCA under the Payment Services Regulations 2017 for the provision of payment services. SFL is a category 1 ring-dealing member of the London Metal Exchange. In addition SFL also engages in other physically delivered commodities business and other general business activities which are unregulated and not required to be authorized by the FCA.


StoneX Financial Pte Ltd (Co. Reg. No 201130598R) (“SFP”) is regulated by the Monetary Authority of Singapore and is a Capital Markets Service Licence holder (for dealing in capital market products), an Exempt Financial Adviser (for advising on investment products and issuing or promulgating analyses/ reports on investment products) and a Major Payment Institution (for domestic and cross-border money transfer services).


SFP may distribute analysis/report produced by its respective foreign affiliates within the StoneX Group of companies pursuant to an arrangement under Regulation 32C of the Financial Advisers Regulations Recipients should contact SFP at (65) 6309 1000 for any matters arising from, or in connection with, this webinar.


StoneX APAC Pte. Ltd. (“SAP”) (Co. Reg. No 200616676W) is regulated as a Dealer (PS20190001002) under the Precious Stones and Precious Metals (Prevention of Money Laundering and Terrorism Financing) Act 2019 for purposes of anti-money laundering and countering the financing of terrorism.


StoneX Financial (HK) Limited (CE No.: BCQ152) (“SHK”) is regulated by the Hong Kong Securities and Futures Commission for Dealing in Securities and Dealing in Futures Contracts.


StoneX Financial Pty Ltd (ACN 141 774 727) holds an Australian Financial Service License (AFSL: 345646) for Dealing in Securities, Exchange-Traded Derivatives Contracts, OTC Derivatives Contracts and Foreign Exchange Contracts, and is regulated by the Australian Securities and Investments Commission.


StoneX Securities Co., Ltd. (“SSJ”) (Co. Reg. No 010401047199) is regulated by the Japanese Financial Services Agency as a Type-I Financial Instruments Business Operator (Kanto Local Finance Bureau (FIBO)No.291’), is a member of the Financial Futures Association of Japan for dealing and broking FX and FX Option transactions, and is a member of the Japan Securities Dealers Association for dealing and broking stock indices and option transactions.


Trading swaps and over-the-counter derivatives, exchange-traded derivatives and options and securities involves substantial risk and is not suitable for all investors. Past performance of any futures or option is not indicative of future success. Indicators are not a trading system and are not published as a specific trade recommendation. The information herein is not a recommendation to trade nor investment research or an offer to buy or sell any derivative or security. It does not take into account your particular investment objectives, financial situation or needs and does not create a binding obligation on any of the StoneX group of companies to enter into any transaction with you. You are advised to perform an independent investigation of any transaction to determine whether any transaction is suitable for you. No part of this material may be copied, photocopied or duplicated in any form by any means or redistributed without the prior written consent of StoneX Group Inc.


The report/analysis herein is not directed to, or intended for distribution to or use by, any person or entity who is a citizen or resident of or located in any locality, state, country or other jurisdiction where such distribution, publication, availability or use would be contrary to law or regulation.


1. PRECIPICE DISCLAIMER: This communication includes data and analytics supplied by Precipice Analytics. StoneX does not own, control, create, or author this data and has not independently verified its accuracy. StoneX does not endorse its use for anything other than informational purposes. You are advised that Precipice Analytics technology may be protected by intellectual property and other rights that prohibit the unauthorized use and dissemination of the information contained herein.

2. MARKET INDICATOR DISCLAIMER: The StoneX Market Indicator provides an overall view of market sentiment for a commodity based on the quantification of fundamental, technical and historical market data related to that commodity. The StoneX Market Indicator History graphically represents each day’s actual very bearish to very bullish signal. This history contains the sum of all factors, excluding weather forecasts.

3. VALUE MATRIX DISCLAIMER: The StoneX Value Matrix provides a measure of historical value by analyzing historical price data distributed into 10 deciles. The prices are adjusted for inflation using the Producer Price Index (PPI) published by the U.S. Bureau of Labor Statistics.


© 2026 StoneX Group Inc. All Rights Reserved.

Satellite view of Earth at night showing illuminated cities across Asia and the Middle East

Discover more insights

Our subscribers have access to comprehensive market analysis from StoneX spanning commodities, equities, currencies and more.

Related articles for Energy

Perspective: Morning Commentary for August 13

August 13 – The major stock indices traded quietly mixed overnight ahead of this morning’s weekly job numbers and producer price index data. Like Wednesday, this morning’s data was considered good as well, providing support for stocks while generally allowing Treasury yields to slip a bit lower. The VIX is trading near 14.4, which is just above yesterday’s new low for the year. The dollar index is trading near 99.8. Yields on 10-year Treasuries are trading near 4.64%, while yields on 2-year Treasuries are trading near 4.15%. WTI crude oil is trading near $81 per barrel, while Brent trades near $87 per barrel. Wheat prices again firmed overnight on geopolitical risks in the Black Sea Region, while corn and soybean prices pulled back modestly from yesterday’s big gains.

Arlan Suderman
Arlan Suderman
  • Grains & Oilseeds
  • Energy
  • Dairy
  • Renewable Fuels
  • Cocoa
  • Coffee
  • Cotton
  • Sugar
  • Meats & Livestock
  • Forest Products

Perspective: Morning Commentary for August 12

August 12 – Today’s focus is on inflation, with the July consumer price index data out this morning. We have this, and one more month of data, ahead of the next Federal Reserve meeting. Of course, headlines from the Middle East and the Black Sea wars also have an ongoing influence on the markets. Stock futures posted gains this morning, while the VIX traded just below 15. The dollar index traded near 99.7. Yields on 10-year Treasuries are trading near 4.66%, while yields on 2-year Treasuries are trading near 4.18%. WTI crude oil is trading near $83, while Brent trades near $88 per barrel. The grain and oilseed markets rebounded from yesterday’s losses ahead of today’s highly anticipated WASDE crop report that is due out at Noon Eastern Time.

Arlan Suderman
Arlan Suderman
  • Grains & Oilseeds
  • Energy
  • Dairy
  • Renewable Fuels
  • Cocoa
  • Coffee
  • Cotton
  • Sugar
  • Meats & Livestock
  • Forest Products

U.S. Dollar Index Cycles Turn on Levels Drawn Nearly Two Decades Ago

The levels that decide the U.S. dollar index cycle were drawn long before 2026, in channels dating back to 2008 and 2022. Razan Hilal walks through the monthly structure and what separates a pullback inside the trend from a genuine turn.

Editorial Team
Editorial Team
  • Energy
StoneX: We open markets

Our market expertise, advanced platforms, global reach, culture of full transparency and commitment to our clients’ success all set us apart in the financial marketplace.

Reach

With access to 40+ derivatives exchanges, 180+ foreign exchange markets, nearly every global securities marketplace and numerous bilateral liquidity venues, StoneX’s digital network and deep relationships can take clients anywhere they want to go.

Transparency

As a publicly traded company meeting the highest standards of regulatory compliance in the markets we serve, our financials and track record are matters of public record. StoneX’s commitment to “doing the right thing over the easy thing” sets us apart in the industry and helps us build respect, client trust and new partnerships.

Expertise

From our proprietary Market Intelligence platform to “boots-on-the-ground” expertise from award-winning traders and professionals, we connect our clients directly to actionable insights they can use to make more informed decisions and achieve their goals in the global markets.