Rhona O'Connell, Head of Market Analysis, EMEA & Asia
Tel: +44 203 580 6115 / mobile +44 7384 833897
10th August 2026
US Nonfarm numbers – the devil is in the detail
Outlook: gold and silver kick on in the wake of the employment numbers – but it’s not that simple
Last Friday saw the release of the US Nonfarm payroll numbers, which are a key parameter for market watchers and the Federal Reserve alike. Contrary to expectations of a gain of 80,000 plus jobs, the headline number came in at a loss of 23k. This naturally shook up the markets and the knee jerk reaction was for a rollback of any expectations for rate hike in September and generated a concomitant sharp rally in both gold and silver with gold trading above $4,300 as we write and silver trading in the $64 dollar region.
We should interpret these employment numbers with care, however, because a good part of the reduction comes from the falling away of approximately 50,000 jobs in the local education sector, in the public employment sphere, and which independent economists expect to unwind by September. Retail payroll, plus leisure and hospitality sector employment reductions can also be attributed to the falling away of previous hikes in consumer spending as a result of the income tax refunds which came about earlier this year as part of the One Big Beautiful Act. That said there is a slowing in healthcare growth, while the increase in productivity as a result of AI is also something of a dampener.
So it could well be that this month’s number is something of an anomaly and we should be alert to the possibility of a stronger number next month (although we should also bear in mind that last week’s number includes downward revisions to the prior months, which is actually not unusual). Tie this together with the notionally weak CPI number that we discussed a couple of weeks ago and we could well find that some of the US economic releases in September will be biased to the upside. Meanwhile the markets are still discounting a 50% possibility of a rate hike in September, although it is also arguable that the Fed may well remain on hold for the rest of this year.
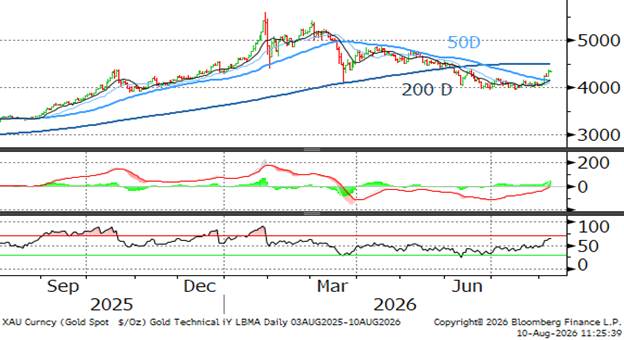
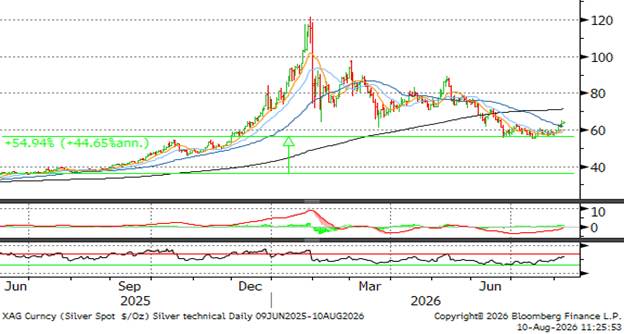
As far as the precious metals markets are concerned the technical picture has now improved for both gold and silver with gold currently trading above the 50-day moving average, although it is still looking at resistance from the 200 day (they stand at $4,153 and $4,500 respectively). Silver is similar with the 50 day now offering support at $62 while there is resistance from the 200 day at $71.
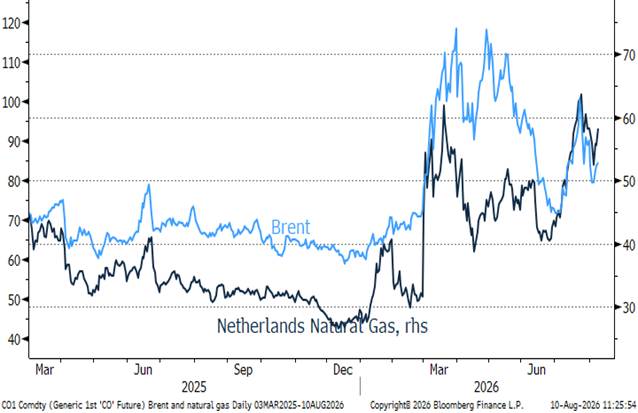
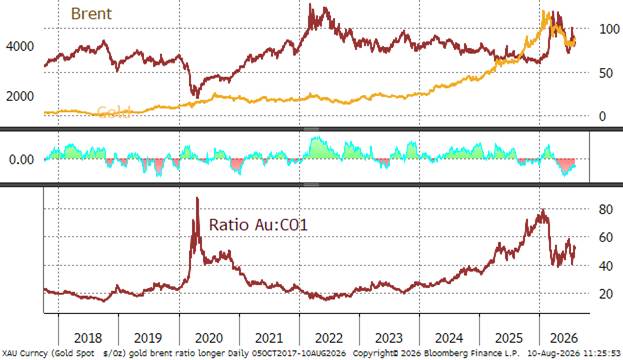
In the geopolitical background the tensions in the Gulf are still not resolved. Iran and Oman are still negotiating about the possibility of reopening Hormuz, while the Houthi militants in Yemen have said that they were responsible for the attack on the Jazan oil refinery in Saudi Arabia. Mercifully there were no casualties reported, but it did give some fresh support to the oil price and since gold in particular seems currently to be trading in the opposite direction to oil this almost certainly took some of the heat out of the market over the weekend.
From a physical standpoint Southeast Asia remains quiet, as does India. Note that we pointed out last week that we are in an inauspicious period for weddings and significant ceremonies and this does put something of a headwind into gold purchases and regional flows are tending to be directed back towards the Swiss refineries. Figures from the US Mint remain subdued.
At the Official Sector level China has reported net purchases of roughly 20 tonnes of gold for the PBOC last month, although as we have said before we do believe that these numbers do not tell the whole story. The fundamental supply demand balance continues to suggest that there are additional official sector purchases that do not necessarily show up in the PBOC figures. The fact that it makes the headlines, regardless of tonnage, gives a boost to supportive sentiment.
The latest news with respect to US tariffs relates to polysilicon products, with a 15% implementation due on the 4th of December. Solar cells fall into this category and this sector is the largest component of silver fabrication demand with an approximate 20% share last year; we are expecting a fall of something like 20% this year as a result of the oversupply in the market, particularly in Europe, along with continued thrifting which is not in itself unusual - far from it when we are dealing with an expensive component - and the threat of partial substitution by copper. The market does not expect silver to be particularly heavily hit in this particular respect although it does mean that the cost of electricity generated from this source will rise in the United States.
US five-year and 30-year yield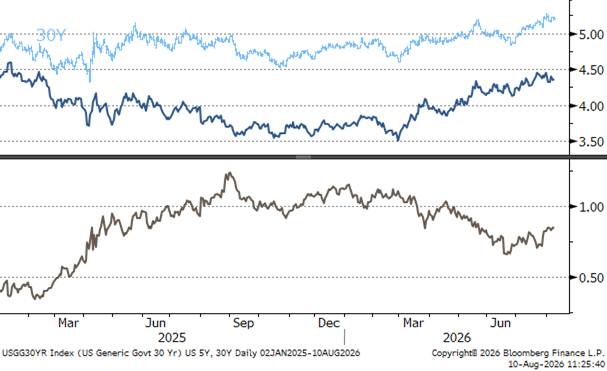
Energy picks up again due to weekend developments in the Gulf
Source: Bloomberg, StoneX
Gold, the 10D is about to cross the 50D to the upside
Silver’s moving averages are all inverted also
Source; Bloomberg, StoneX
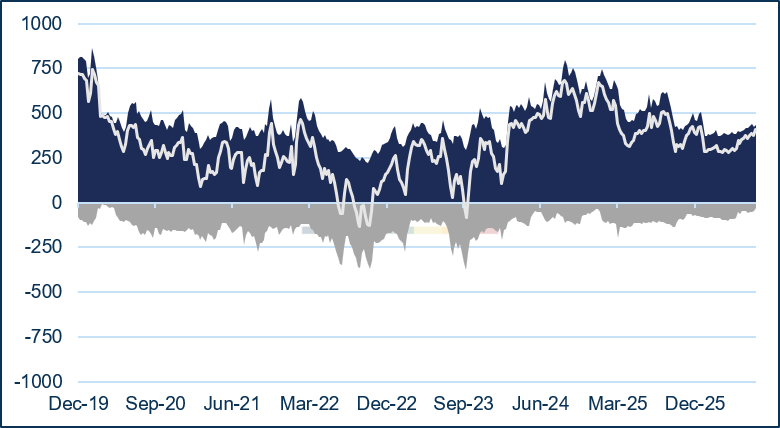
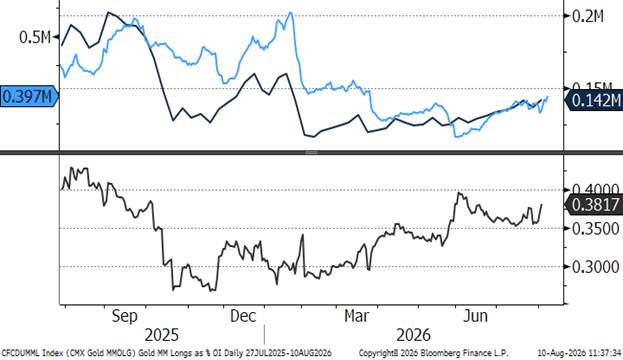
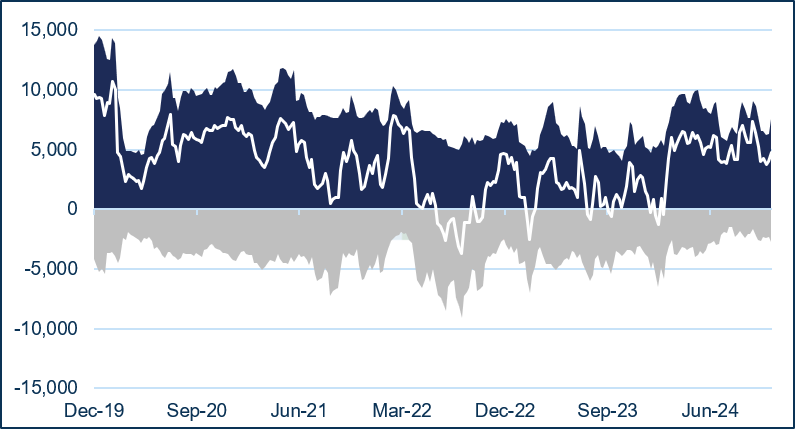
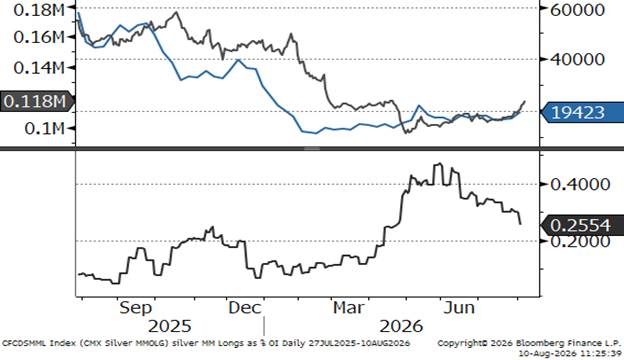
The latest CFTC gold figures, for the week to 28th July with gold trading in a remarkably tight range between $4,011 and $4,086 before its jump on Friday, reflected a change in sentiment with a 3% (15t) increase in outright Managed Money longs and a 38% (20t) drop in shorts, taking the net long to 407t. The outright long, at 419t, is now just 9% below the 12-month average. Silver positions also reversed course, with outright longs adding 14% (406t) and shorts contracting by 4% (41t) to take the net long to 1,969t, an eight-week high.
Interest has also been returning in the Exchange Traded Funds; the latest figures from the World Gold Council run to 31st July and show a weekly gain, albeit just 5.4t, driven by small gains in Europe and Asia offsetting a small decline in North America. Holdings at that date were 4,068t for a year-to-date increase of 39t, with a loss of 60t in North America, and gains of 23t in Europe and 74t in Asia. Subsequent Bloomberg figures (not as comprehensive as WGC) show further subsequent increases of seven tonnes. Silver ETFs (Bloomberg numbers) also show a revival in interest with net gains over the week of 160t (just less than 1%) to 24,6356t for a net loss year-to-date of 2,184t.
Gold COMEX positioning, Money Managers (t)
COMEX Managed Money Gold Longs as % of 1st continuation Open Interest
Source: Bloomberg, StoneX
COMEX Managed Money Silver Positioning (t)
Source: CFTC, StoneX
COMEX Managed Money Silver Longs as % of 1st continuation Open Interest
Source: Bloomberg, StoneX
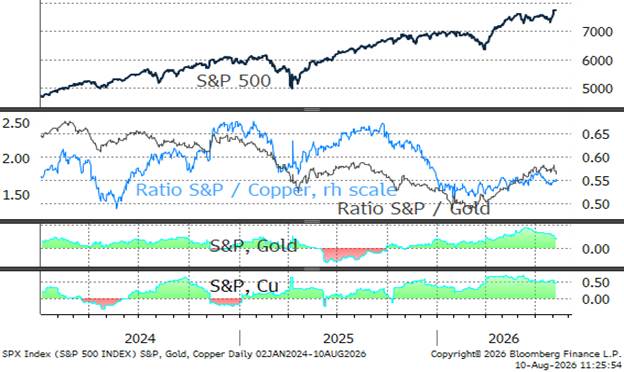
The S&P, gold and copper; S&P/gold correlation declining sharply to 0.38 while S&P:Cu correlation is also off, but steadying at 0.44
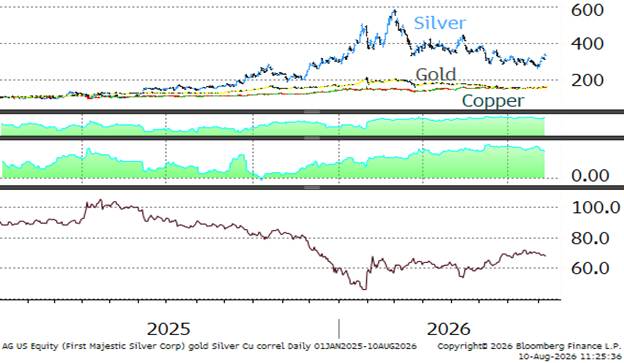
Gold, silver and copper correlations; silver-gold 0.83 (tighter) silver-copper, 0.65 (lower as gold’s momentum holds sway)
Gold:Brent ratio
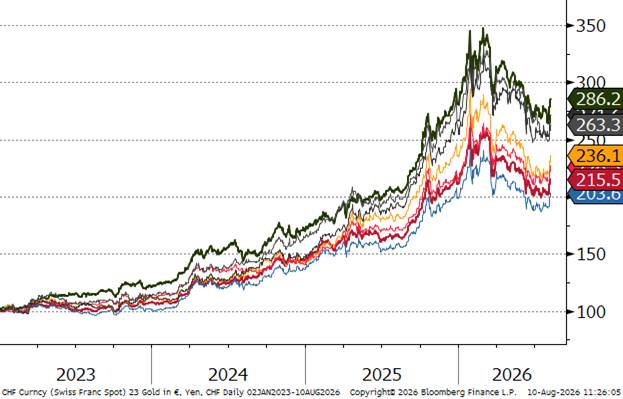
Gold in key local currencies. Year-to-date, up 7% in Rupee terms now ,flat in US$
Source for above charts; Bloomberg, StoneX
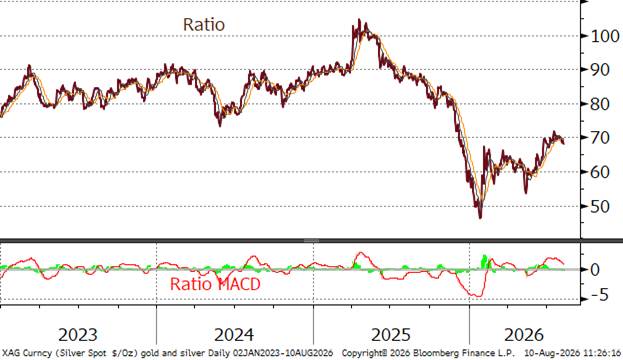
Gold:silver ratio; contracting; this is normal when prices are rising given silver’s higher volatility
Source for above charts: Bloomberg, StoneX
| | 10 August 2026 | Previous week | % change | Year-to-date | Range Jan 2024 onwards | | Range as % |
| | | | | | Min | Max | |
| Gold (pm LBMA price) | 4,338.25 | 4,054.33 | 7.00% | 0.14% | 3,976.50 | 5,417.21 | 36.23% |
| Silver (LBMA price) | 58.66 | 62.05 | -5.47% | -23.41% | 57.42 | 116.70 | 103.25% |
| Platinum (pm LBMA price) | 1,629.94 | 1,632.90 | -0.18% | -28.41% | 1,552.52 | 2,054.12 | 32.31% |
| Palladium (pm LBMA price) | 1,271.77 | 1,271.28 | 0.04% | -25.94% | 1,171.57 | 2,054.12 | 75.33% |
| S&P 500 | 7,757.64 | 7,489.72 | 3.58% | 13.32% | 4,688.68 | 7,757.64 | 65.45% |
| $:€ | 1.1559 | 1.1527 | 0.28% | -1.37% | 1.0244 | 1.2041 | 17.54% |
Source: Bloomberg, StoneX