Autos and Swiss PGM trade statistics – very early glimmers of light?
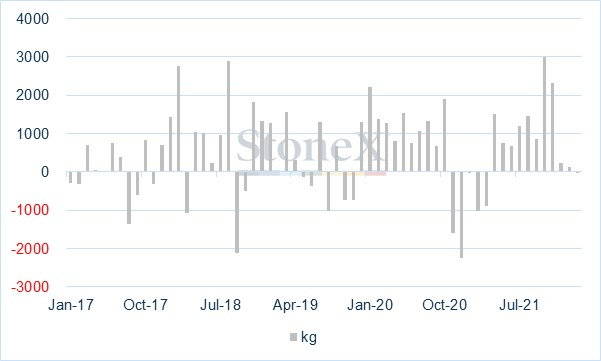
The Swiss trade statistics for key players in the platinum group metals markets are showing an interesting development. We track the numbers for the key market players, i.e. South Africa, Russia, Germany, Hong Kong, the UK and the United States.
The latest statistics imply that the auto industry may be starting, probably tentatively, to look towards a recovery. The most recent auto numbers from Europe and the United States still paint a weak picture, but not as weak as in 2020 and early 2021 and are discussed briefly below, but first the trade figures require some attention.
The key here is the trade with the United States, Germany and Hong Kong (the numbers for direct trade with China are few and far between with no recorded direct exports since May of last year).
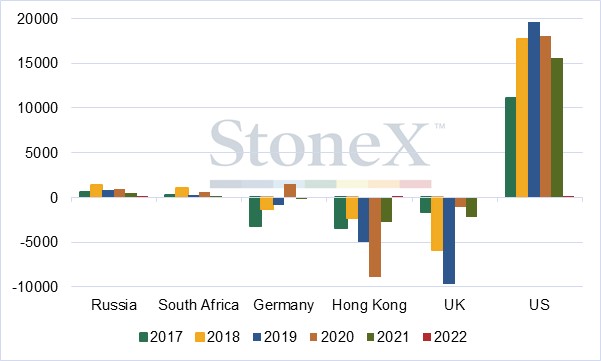
The most interesting development relates to the United States. Swiss figures record imports of substantial quantities of palladium into Switzerland, actually going as far back as at least 2017 (which we believe to be a rundown of inventory with auto makers working on a hand-to-mouth basis). As the pandemic took hold these exports continued, albeit at a slightly lower pace than in 2019, but nonetheless they were strong, at a monthly average of 1,505kg and 1,295kg in 2020 and 2021 respectively.
Now the picture is substantially altered. After a hefty net import of 3.1t in October, November posted 2.3t; then December contracted to 552kg, but in January and February they have gone to almost nothing, with just 22kg in January and 12kg in February.
Swiss monthly net trade in palladium with the key counterparties (kg)
Source: Swiss Federal Department of Finance, StoneX
Meanwhile German figures also tell an interesting story. In 2017 and 2018 Germany, a lynchpin of the auto sector, and also home to substantial refining and semi-manufacture business was a net importer of palladium from Switzerland, at 3.3t and 1.3t respectively. In 2019 it was still a net importer, but at a slower rate of 842kg. As the pandemic got to grips with the auto sector in 2020 Germany exported a net 1.5t of palladium to Switzerland and with the exception of the start of 2021 when metal went back into Germany, it kept coming into Switzerland through much of 2021. Since November, however, the flow has been back the other way, albeit that the numbers are still low, only in monthly double-digits in kilo terms.
The Hong Kong picture has also changed, but the other way around. We have written a number of times about strong China imports of palladium ahead of the tightening of emissions legislation, especially with respect to unburned hydrocarbons, for which palladium is the most effective metal. The trade numbers strongly suggest that inventories in the country are relatively plentiful, with net imports of 8.9t in 2020 dwindling to 2.7t in 2021; thus far in 2022 Hong Kong has been a net supplier of a small amount of material coming back to Switzerland. The figures may be slightly distorted as there has been a certain amount of round-tripping, but the underlying trend is clear enough.
Swiss overall net palladium trade with the key counterparties (kg)
Source: Swiss Federal Department of Finance, StoneX
Vehicle sales numbers; the industry is by no means out of the woods
A rolling total for European vehicle sales shows that since May 2021, with the exception of December 2021, each twelve-month period has been stronger than the equivalent twelve-month period of a year earlier. In the United States and China the trend is variable, but the rolling twelve-month numbers are generally higher year-on-year.
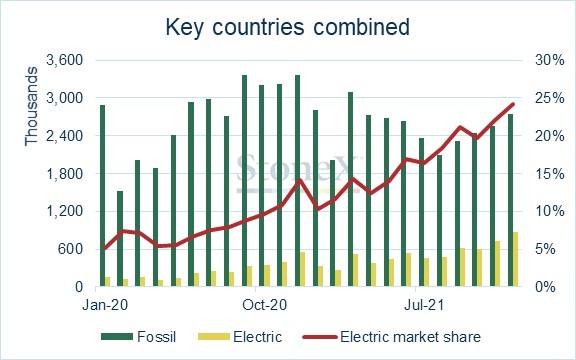
This is not necessarily bullish for the palladium market, not yet at least, because sales of electric vehicles have been the high spot within the sector. They have now reached 6% of total in the United States, while in Europe the December numbers suggest a 31% share.
Source: Bloomberg, StoneX
In Europe, fossil fuel vehicle sales are under pressure, while in the United States they have been recovering for much of the past few months. China is clearly on an uptrend.
This table summarises the fortunes of the passenger car sector in the three key areas of the United States, Europe and China and puts some numbers behind the above chart. The near-exponential growth in the electric vehicle sector is clear to see and is by no means over. Meanwhile there has been some anecdotal evidence that the dislocation in the semiconductor sector may be starting to ease, but it seems pretty thin on the ground; Nio, for example, a Chinese start-up company specialising in smart electric vehicles, has said today (25th March) that its chip procurement could be down by 10% this year.
The Ukraine crisis could exacerbate the position. Neon is critical for the lasers in semiconductor chips and Ukraine is reported to account for more than 50% of world neon production. Most chip producers, however, are believed to have substantial inventories of the gas.
We will be discussing this and related matters (including the regional breakdown of fossil vs electric) in much more detail in a webinar in early May, which will also form the background for a published Thought Leadership piece.
Sales of passenger cars by fuel type, M
| |
|
2020
|
2021
| |
|
United States
|
Fossil
|
3.08
|
2.69
|
-12.6%
|
| |
Electric
|
0.33
|
0.66
|
102.8%
|
| |
Total
|
3.40
|
3.35
|
-1.5%
|
| |
| | | |
| |
| | | |
|
Europe*
|
Fossil
|
10.48
|
9.44
|
-10.0%
|
| |
Electric
|
1.46
|
2.39
|
63.6%
|
| |
Total
|
11.94
|
11.82
|
-1.0%
|
| |
| | | |
| |
| | | |
|
China
|
Fossil
|
18.97
|
18.31
|
-3.4%
|
| |
Electric
|
1.21
|
3.16
|
161.0%
|
| |
Total
|
20.18
|
21.47
|
6.4%
|
*2021 breakdown, StoneX estimate
Source: Bloomberg, ACEA, StoneX