Weekly round -up for StoneX Bullion; Rhona O'Connell, Head of Market Analysis,
EMEA & Asia, 20th July 2026:
Tel +44 203 580 6115 / +44 7384 833897
Rates still the key driver as Middle East escalates
Outlook: continued downside risk lurking in the background; watch the 10-year bond yield
After a period of uncertainty that has kept retail investors on the sidelines there are signs of some buying in parts of the Far East – but this is being offset by continued sales elsewhere in the region, leading more or less to a zero-sum game. Middle Eastern activity remains subdued with gold largely at a discount, although there is some interest developing in India in both metals (India is the world’s largest consumer of silver jewellery and silverware with 51% of the sector and 9% of total global offtake). This may well prove supportive but is not enough to boost prices. The professional market continues to fight shy of short-term activity apart from immediate reactions to rate moves, in turn propelled by geopolitics.
Narrow ranges remain the order of the day and we continue to believe that the downside is marginally more likely than sustained rallies.
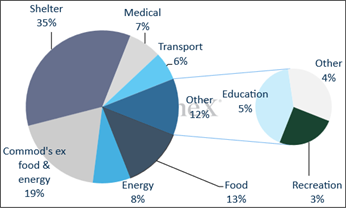
Inflation: in June 2026 these were the key components of the CPI basket
 Source: Metals Focus, StoneX
Obviously, shifts in prices modify the different inflationary contributions from different sectors, but energy itself was ~8% of total in June (compared with the more normal historical 6-7%), but indirectly its contribution is higher due to energy’s influence on transport, manufacturing and logistics. The drop in inflation in the June reading, which we believe will be reversed in July, was almost entirely due to energy, which fell by almost 6% in the month and translates into almost all the 0.4% fall in headline CPI. On a broader scale, labour costs comprise roughly 60% of business costs, but that is not the same as 60% of inflation.
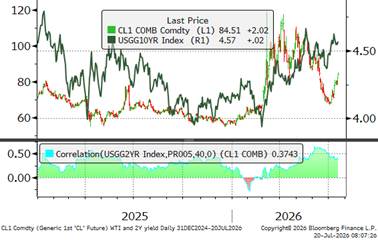
Crude oil (WTI) at $84 is down 26% from the $113 high of 6th April, but 24% up from year-ago levels. Given the strains in the Middle East we should expect prices to persist in the new range. If conditions settle, prices could well drift towards $70 over the next twelve months or so, as (if) the war premium unwinds. That does not take the heat out of inflationary forces, however, as supply chain disruption will take time to work off.
WTI and the ten-year yield
 Source: Bloomberg, StoneX
All of this means that the Federal Open Market Committee will be walking a tight-rope with respect to monetary policy. The next meeting is next Tuesday / Wednesday 28/29 July and the Fed is now entering its blackout period. Most recent comments from FOMC members have been mixed; Chris Waller, who used to be a proponent of easier monetary policy, has changed course and last week told the New York Association for Business Economics that if upcoming inflation data remain strong the Fed may need to raise rates. He pointed to tariffs, high energy prices and AI-related investment. Overtightening is clearly a risk and he believes the Committee needs several months of steady / reducing inflation pressures in order to be convinced that inflation is coming under control. The Committee remains divided and appears to be broadly 50% in favour of further tightening if inflation persists, with the rest preferring to remain steady.
Meanwhile the 10-year yield is a visible and flexible parameter, and the rise from below 4% at end-February to 4.6% now tells its own story, and provides a clear headwind for gold and, with its industrial bias, for silver.
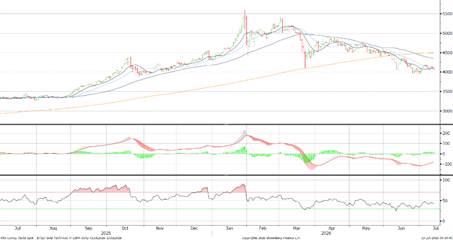
Gold, just below the 10D moving average (at $4,070 with 20D at $4073)
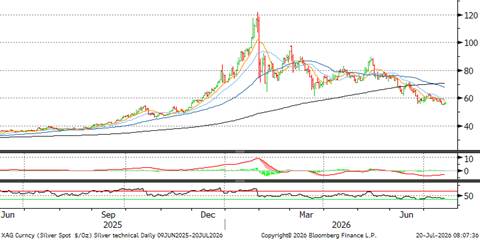
Silver’s moving averages are all inverted also
Source; Bloomberg, StoneX
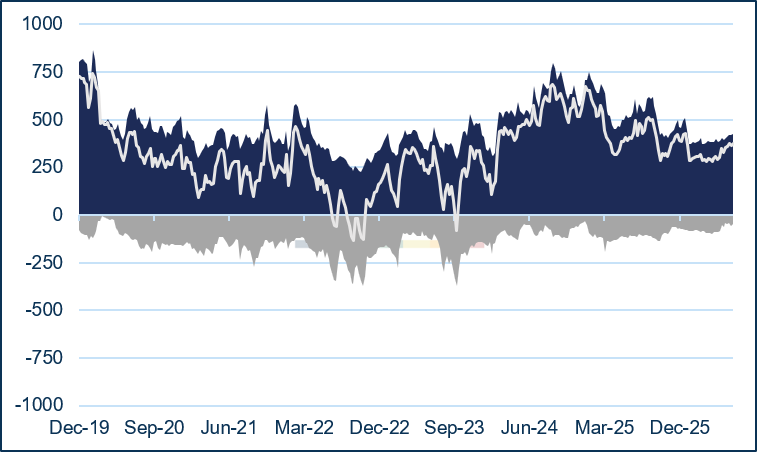
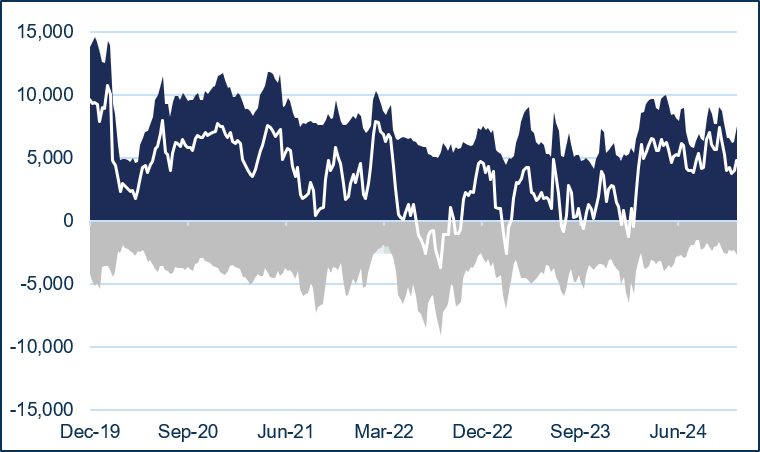
The latest CFTC gold figures show a mildly bullish tone in the week to 14th July, with a 1.5% (6.1t) gain in outright Managed Money longs and 18.3% (8.3t) of short covering. The outright long stood at 436t, which is 23% below the 12-month moving average. Silver was different, with a 9% (280t) drop in outright longs and a 1% (6.2t) rise in outright shorts. The outright long, at 2,822t, is a hefty 41% below the 12-month average.
In the Exchange Traded funds sphere, the latest figures from the World Gold Council run to 10th July and show a year-to-date gain of just 15t, to 4,045t. Falls of 67t (3%) in North America, a gain of just 12t in Europe (1%) and of 68t (16%) in Asia. The Bloomberg figures to last Friday, which are not as comprehensive as those from the World Gold Council, suggest a further drop of 20t, to 4,035t. While this implies a net five tonne drop over the year, it also represents a fall of 108t from the mid-April high of 4,143t. Silver ETFs are reported at 24,413t, a drop of 2,408t in the year to date, with bargain hunting appearing in the latter part of last week, picking up 128t.
Gold COMEX positioning, Money Managers (t)
COMEX Managed Money Silver Positioning (t)
Source: CFTC, StoneX
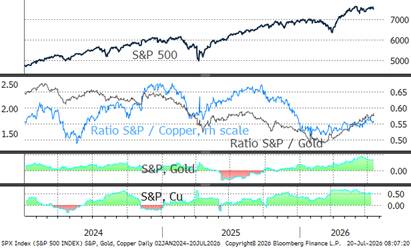
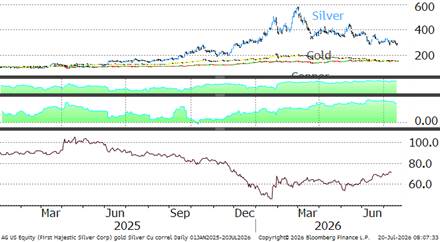
The S&P, gold and copper; S&P/gold correlation tighter at 0.69 while S&P/Cu correlation is steady at 0.49
Source; Bloomberg, StoneX
Gold, silver and copper; silver-gold 0.83 (tighter) silver-copper, 0.68 (easier)
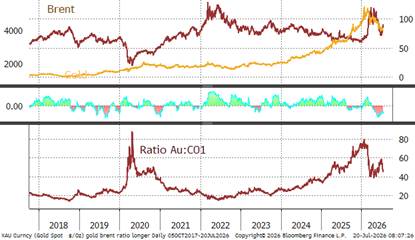
Gold:Brent ratio
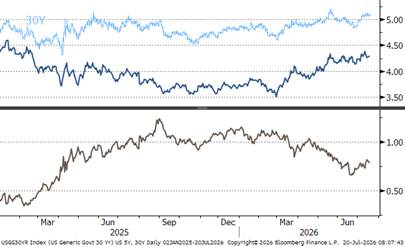
US five-year and 30-year yield
Source for above charts; Bloomberg, StoneX
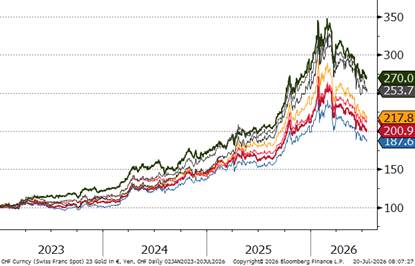
Gold in key local currencies. Year-to-date, flat in Rupee terms now ,down 7% in US$
Gold:silver ratio; rising
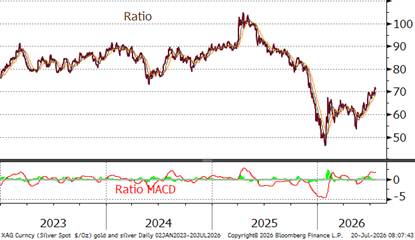
Source for above charts: Bloomberg, StoneX
| | 20 July 2026 | Previous week | % change | Year-to-date | Range Jan 2024 onwards | | Range as % |
| | | | | | Min | Max | |
| Gold (pm LBMA price) | 4,016.02 | 4,002.39 | 0.34% | -7.30% | 3,976.50 | 5,417.21 | 36.23% |
| Silver (LBMA price) | 58.66 | 62.05 | -5.47% | -23.41% | 1,552.52 | 2,778.60 | 78.97% |
| Platinum (pm LBMA price) | 1,629.94 | 1,632.90 | -0.18% | -28.41% | 1,552.52 | 2,054.12 | 32.31% |
| Palladium (pm LBMA price) | 1,271.77 | 1,271.28 | 0.04% | -25.94% | 1,171.57 | 2,054.12 | 75.33% |
| S&P 500 | 7,457.69 | 7,575.39 | -1.55% | 8.94% | 4,688.68 | 7,609.78 | 62.30% |
| $:€ | 1.1439 | 1.1416 | 0.20% | -2.39% | 1.0244 | 1.2041 | 17.54% |
Source: Bloomberg, StoneX