Precious Metals Talking Points: LBMA Precious Metals OTC volumes and what they signify; October
Rhona O'Connell
Head of Market Analysis, EMEA & Asia;
+44 203 580 6115; mobile +44 7384 833 897
This is written for NASDAQ and the LBMA and will be posted also on the NASDAQ website
LBMA Precious Metals market volumes, October 2023, and their significance
Rhona O’Connell, StoneX Financial Ltd; 23rd November 2023
Any views expressed here are of the writer and do not reflect a house view either from StoneX Financial Ltd., nor from NASDAQ.
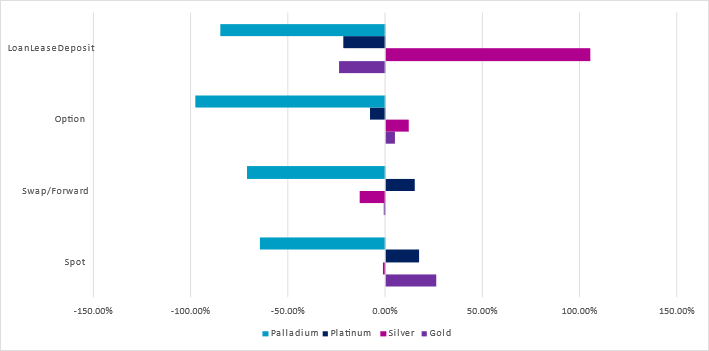
Daily October average compared with daily average for calendar 2022
Source: LBMA
Welcome to our monthly round-up of the LBMA OTC trading volumes in gold, silver, platinum and palladium, as recorded on a daily basis by the Association. These are split into spot, swap/forward, options and LoanLeaseDeposit (LLD) and give a flavour of the markets’ activity and how they were influenced by external forces and news items.
As the chart above shows, daily average volumes were generally mixed in October by comparison with the daily average in 2022. Silver was lively in LLD and options, which suggests more hedging activity, while the spot and forwards were fractionally down. Gold was down everywhere except spot, platinum was up everywhere except LLD and palladium numbers continue to look dire, reflecting the fact that the market is still not trading Russian material through the London Platinum and Palladium Market (LPPM).
The dollar essentially traded sideways during October with the DXY dollar index starting at 106.2 and closing at 106.7, and in a narrow overall range of 2%. This left the metals to follow their own instincts, as follows: - gold bottomed in the first week of the month and then rallied, driven by geopolitics; silver followed suit but more dramatically (not unusual), trading in an 11% range against gold’s 3%. Platinum barrelled higher (but faltered at end-month ahead of a volatile November) while palladium remained under pressure. Platinum gained 11% from low to high but only 7.4% net, while palladium traded a 13% range and lost 10% on balance.
GOLD
Spot gold volumes, October, M ounce
s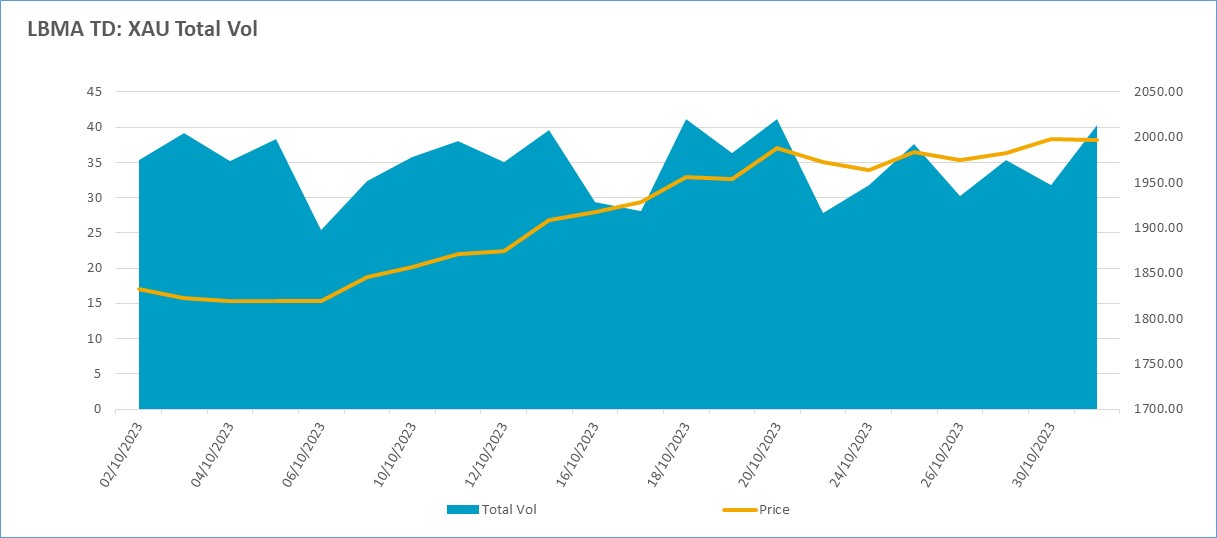
Source: LBMA
Diwali was the key fulcrum for the retail market in mid-November – and therefore October gold flows into India were suitably elevated and this will, to some extent, have given the price some support. As ever, though, the primary driver of the gold price was from the professional sector. Bear in mind that spot volumes vastly outweigh the fundamental volumes of the underlying metal. LBMA spot volumes in the twelve months to end-October 2023, for example, were, in tonnage terms, a multiple of 46 times the level of mine supply. And that is only spot, does not include any of the other OTC volumes (if we gross it all up it comes to 69 times. In addition, LBMA OTC volumes, while holding the lion’s share of the world’s physical trading, does not have a monopoly; independent analysts have suggested that it may be in the region of 70% of total.
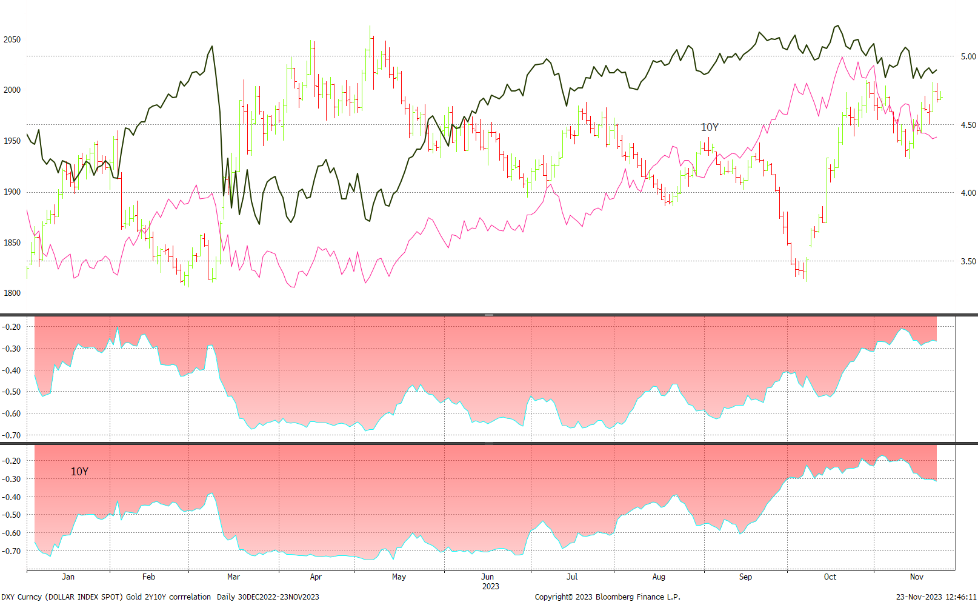
Once again, the Federal Reserve was a key financial focus of the professional market, but the Middle East took over and was a key influence for much of October, although by month-end the market was of the view that continued hostilities had been priced in. Obviously the market is closely watching developments. Meanwhile the Fed meeting that closed on 1st November did not really say anything that different from previously, apart from the fact that in his Press Conference after the meeting, in response to a question, Fed Chair Jay Powell said that the Fed is not talking about cutting rates and not even thinking [our italics] about doing so. It was abundantly clear that the “higher for longer” message remains unchanged. At some stage a change in direction is likely to become inevitable but Mr. Powell reiterated that this is not imminent. It Is worth noting here that for virtually all of the Fed’s current cycle the bond markets have been more benign than the rhetoric. Note also that the Fed is to continue “tightening” which suggests further quantitative tightening, i.e. letting bonds expire without rolling over, and this is naturally supportive for bond rates and reduces the perceived need for further hikes.
As far as trading patterns are concerned, the first week of October (the Hamas attack was on 7th) saw some lively action in both the swaps/forwards and options as the price bottomed out between $1,800 and $1,830, the lowest level since early March and thus attracting some forward buying interest and likely options activity at $1,850 and possibly higher. Spot was quiet. The price started rallying on 6th, in very slow conditions and the jump on Monday 9th, and then another on the 11th, looks as if they attracted some hedging as LLD volumes were boosted to almost twice the volumes that had October had seen that far.
Spot really sprang to life on 13th as gold drove from $1,869 to $1,932. This move attracted a lot of press attention given its size, but in reality it was only an intraday gain of 3.4%. What was of more significance really was that the background environment was merely propelling gold back into the $1,900-$2,000 range, which could be described as its comfort zone and which had previously prevailed from March through to late September, when the price broke down under surging US bond yields as the markets finally accepted that the Fed meant it when it said “higher for longer”.
For much of the rest of October spot was busy as safe haven buying ebbed and flowed, and prices crested $2,000 on the 27th, at which point the market was overbought and ran out of momentum.
Set against this bullish background the activity in swaps/forwards was patchy, with the only signs of real life developing on the approach to $2,000 and then again as the price turned downwards. Volatility in price clearly militated against any action in the options segment but at month end the hedging market sprang back into life as the magical $2,000 hove into view, then continued as the price topped out.
Gold and the key U.S. bond yields, year-to-date
Source: Bloomberg, StoneX
In the background, Exchange Traded Products saw inflows of 37.8t and outflow of 74.4t (World Gold Council figures) for a net outflow of 36.6t or $2.1Bn. The largest outflows came from US-based funds (27.5t or 1.7% of U.S. holdings) and Europe (11.9t, 0.8% of Europe holdings) while Asia and others were small net absorbers. On COMEX, Money Managers added 123t of long-side exposure and reduced shorts by 133t, taking the net position from a short of 24 to a long of 233t.
SILVER
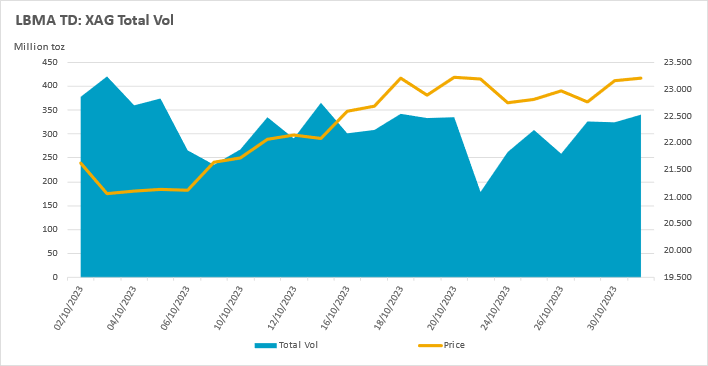
Spot silver volumes, October, M ounces
Source: LBMA
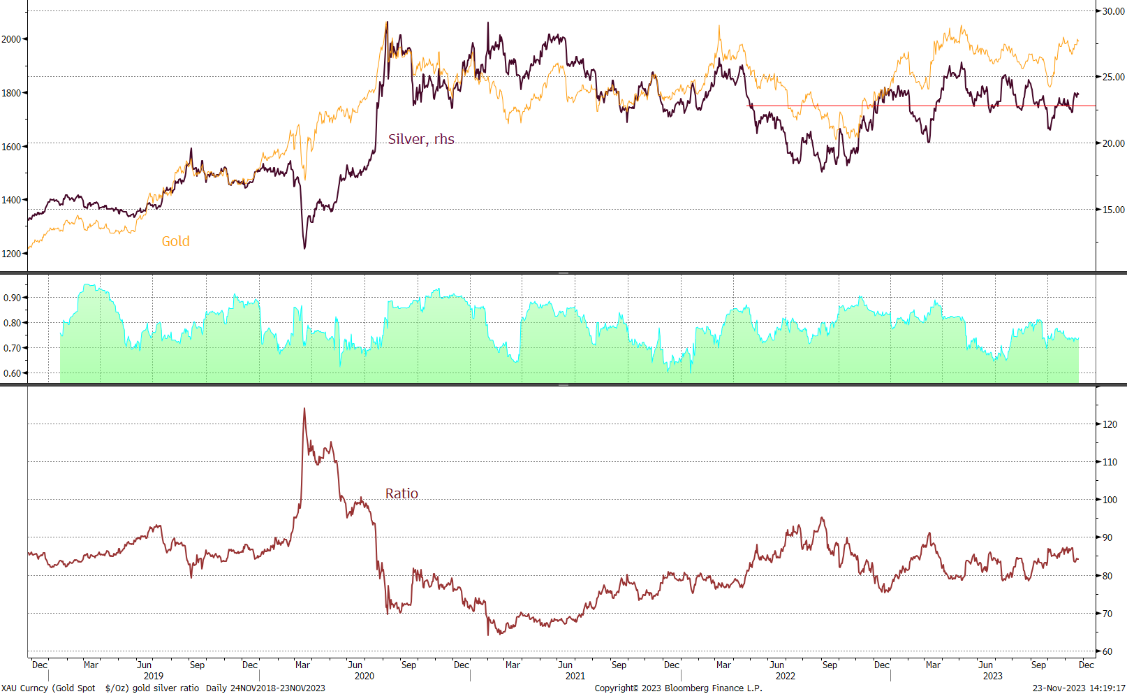
While gold and silver traced similar price profiles over October silver, as is more often than not the case, was more volatile. Although noted above that silver’s range was 15% against gold’s 3%, a multiple of five, silver’s net gain was 13%, a multiple of just 1.3, thus demonstrating how volatile and fickle this capricious metal can be. Silver’s loss in the first half of November was also proportionally larger than that of gold - but more of that next month.
While we have noted in these pages before, when gold is not showing much of a trend, silver will often look to the industrial metals, reflecting its 60% industrial demand base, and if gold is only rallying half-heartedly, silver may well not join in. This time, though gold’s allure was too powerful and silver therefore traded in response to the same forces outlined in the gold section above.
Gold, silver, the correlation and the ratio, five-year view
Source: Bloomberg, StoneX
The similarities extend to the fundamental physical side as well as the geopolitical, monetary and technical elements. Figures released in November showed a preliminary estimate of silver imports in excess of 1,000t into India during October, which is way above the longer-term monthly average (300-500t) and dwarfing the very low imports in the earlier months of 2023. Imports had understandably been low in 2021 2020 and 2021 then soared in 2022 as investors and silverware/jewellery purchasers flooded back into the market. Conditions have been very sluggish so far this year, however, but a good monsoon season plus pent-up investor demand, very probably compounded by demand for use in electric vehicles and solar cells, made for a very buoyant month.
Meanwhile, gold saw just eight days of ETP creations in August, silver ‘s pickings were even more meagre, at only six days of net creation. The result was a small net loss of 75t, or way less than 1% of the end-September total, leaving holdings at 22,135t, which compares with annual world mine production of roughly 26,200t.
Activity on COMEX differed from that of gold, and was dominated by substantial short covering, with the longs more or less netting out as neutral over the month. Longs did expand in the first half of October and then there was a sharp sell-off; while shorts contracted from 5,091t to 3,759t, a drop of 1,332t or 26%. In fact the final week of the month saw a few fresh shorts appearing. Silver’s short-covering rallies can be notoriously sharp because of its innate volatility – and that of course becomes self-fulfilling so any sizeable short covering can snowball. This is what happened here and goes a long way towards explaining the much wider range – and subsequently the start of the retreat that resulted in a narrow gain.
PLATINUM
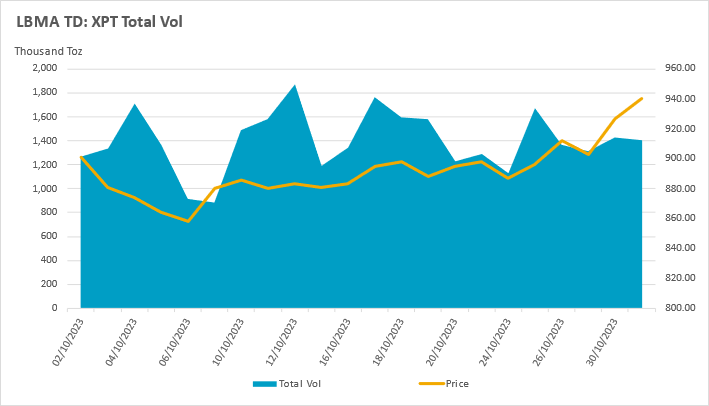
Spot platinum volumes, August, 000 ounces
Source: LBMA
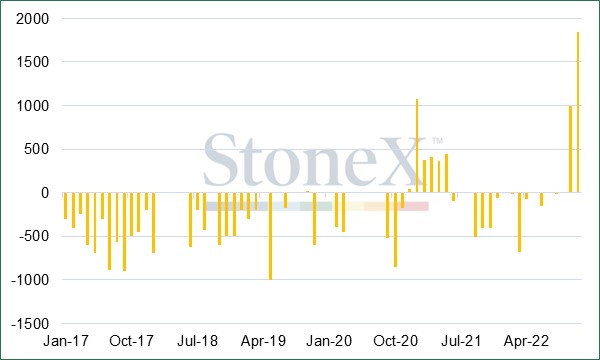
Platinum started October by continuing the downtrend that had been in place since late April before starting to turn higher in the second week. This is believed to be much more in tune with fundamental activity than the geopolitical elements that drove gold and silver – and as noted above, the dollar was in no strong discernible trend over the period. In this case it subsequently transpired that Switzerland was exporting heavy volumes of platinum to Hong Kong and China during October, with combined net exports of 1.65t in October against a monthly average over the rest of the year of 351kg going in the opposite direction. Independent forecasts for China’s vehicle production next year are reasonably robust so this import number may well reflect bargain hunting into the falling price in September and early October, then reflected in shipment flows. Equally it could merely be a question of inventory management via international trade, as (see the chart below) there had been some interesting outward flows to China earlier in the year and in late 2022 when prices had been higher.
Hong Kong and China; net platinum trade with Switzerland (kg)
Source: Swiss Federal Customs Administration, StoneX
The markets continue to focus on the prospect for platinum usage in fuel cells over the longer term as the vehicle fleet electrifies, while keeping an eye on the supply position in South Africa. The fundamental position is in a deficit for both this year and next and while there are reasonable amounts of above-ground inventories these are largely in firm hands. Supplies from South Africa have been relatively steady as, since any load shedding from Eskom has not gone beyond Stage Six the miners have been able to keep the mines operational and have reduced treatment activities when they have had to constrain power usage. As a result they have built up a (relatively small) degree of work-in-progress inventory that will eventually filter through to the market. If, as some are positing, the fundamental changes in power demand in South Africa combine with capacity changes at Eskom over the next couple of years, we can probably expect this metal to start coming through in 2024. But it is a big “if” and we should not bank on it yet.
Meanwhile last month’s trading activity saw a lively spot and forward market when compared with the twelve-month average for 2022, with gains of 17% and 16% respectively. Price action saw a fall from $920 to $855 in the first week and then a steady revival towards $910 before month-end, topped off with a final flourish in which spot traded a $902-937 range with in one day with a close near the high.
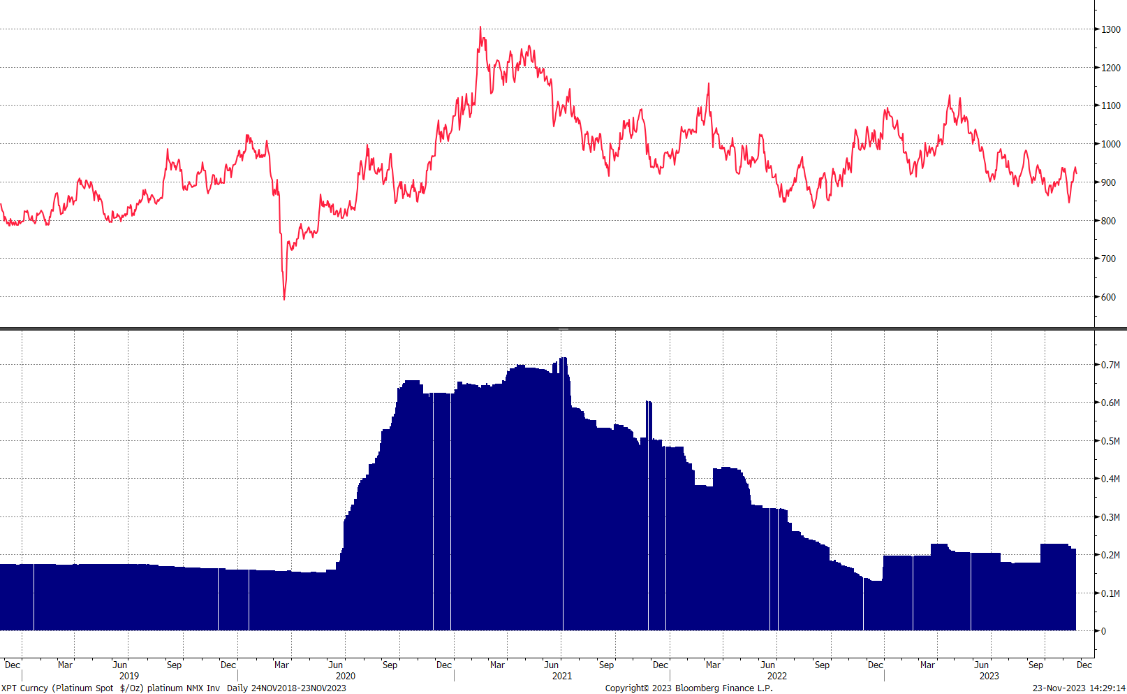
Spot platinum and NMYEX inventories, five-year view
Source: Bloomberg, StoneX
Spot was busy at the start of the month while the day that turned the trend higher (Friday 6th) was wide-range in low volume. This is slightly unusual in that trend-changers are normally heavy volume, but a wide range in one day often comes in thin conditions. Forwards were relatively thin at this point, while options were busy, and since the $900 level had just been severed to the downside this could reflect $900 puts going into place. As the gradual uptrend developed there were some lively days in the forward sector, which could well have reflected industrial interest. In addition as prices approached and then breached $900 to the upside the LLD market perked up, suggesting some hedging.
Month-end saw spot and LLD retreat to low volume, while forwards showed some light interest towards the high, which may have contributed to the resistance that developed at $940 before a sharp price fall in early November.
Exchange Traded Products saw some scattered buying during October, but sellers prevailed, for a net reduction of 0.56t (just 1% of end-September levels), leaving holdings of 91.8t, equivalent to between six and seven months’ world mine production.
On NYMEX, Money Managers increased positions on both sides of the market for much of the month, before an abrupt change at month-end; outright longs rose to 48.3t from 46.6t, and shorts expanded from 62.4t to 65.9t in the third week – and then there was a sharp short-covering move, taking 20t off the books in the final week and helping to boost prices from $883 to $932 over the week before a small correction.
So platinum continued to eke out gains, laying the foundation for a constructive outlook.
PALLADIUM
The clouds continue to hang over the palladium market as observers look to the long-term implications for the electrification of the vehicle fleet and the fact that, regardless of the fundamentals of the palladium market, the metal supply will (all other things being equal), continue to come into the market regardless. This is because roughly 85% of palladium mine production is a by-product either of platinum (South Africa, Zimbabwe) or nickel (Russia), mine supply will continue to be a function of the markets for those metals. The nickel market outlook is bright and while platinum will suffer from the changes in the auto sector, it has the benefit of fuel cell usage as something of a cushion. If we add scrap material into the equation, then primary palladium mines’ market share drops to just under 10% of total supply.
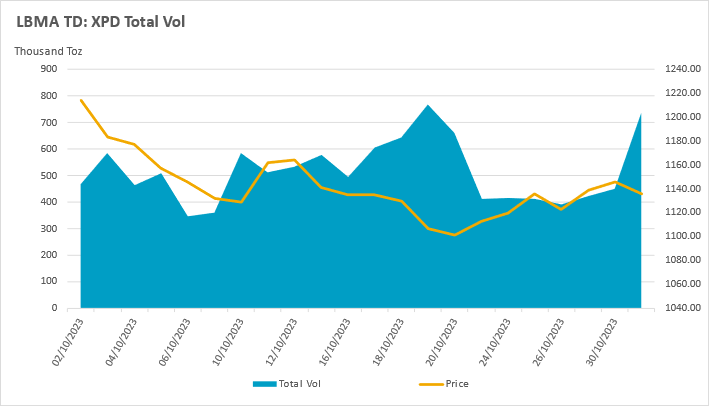
Palladium spot volumes, August, tonnes
Source: LBMA
Palladium may yet be able to benefit from the fuel cell market as there is research underway that would allow fuel cell electrodes made from a Pt-Pd alloy. At pilot stage this is looking promising, but still needs to be tested at a scaleable level.
Meanwhile the prospect for substantial resales of internal combustion engine (ICE) vehicles over the next fifteen years or so, coupled with much reduced purchase of new ICE vehicles as bans come into place, means that the auto sector, far from being responsible for over 80% of palladium demand currently, becomes a net supplier of metal into the market.
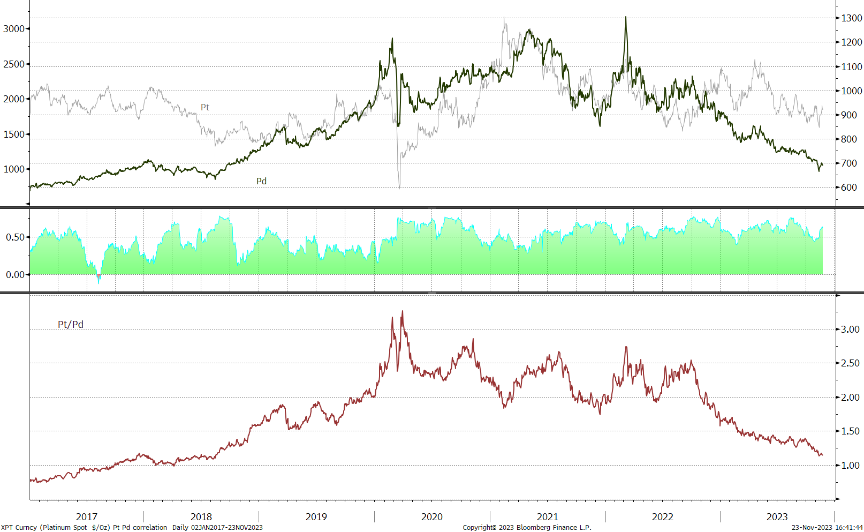
Consequently investors have been leaving the market and the Money Managers on NYMEX are running record outright shorts (see below).
So, as our other three metals posted gains, palladium continued to slither lower in October, shedding almost 11%, from $1,249 to $1,124. To be fair, the low was actually posted on the 23rd, at $1,088 as the second half of the month was effectively sideways trading from the 13th onwards, with $1,150 putting up resistance and $1,100 providing support.
Behind this price action we saw sluggish London-based trading for well-known reasons alluded to in the introduction. Spot was down 20% on the 2022 average, which itself had been hit as of April; against the daily average for 2021, October 2023 was down by 27%. Across the other sectors on the same basis, swaps/forwards were down 39%, options 77% and LLD, 26%.
October started with what looks like reasonably heavy spot liquidation along with some rare life in the options market, which could well have been targeting $1,150 as $1,200 gave way. Thereafter volumes were thin everywhere until spot and LLD started picked up tentatively as there was an attempt to consolidate just below $1,150, but the inability to rally after the sharp fall at the start of the month looks as if it brought about more stale bull liquidation. Mid-month saw a further retreat in price amid higher volumes in spot, swap/forward and LLD, which suggests that the resistance put up at $1,150 was encouraging some defensive forward sales activity.
Platinum, palladium, and the correlation
Source: Bloomberg, StoneX
Sentiment partially reversed after $1,100 had provided some support although the small rally towards $1,150 in the final week was again in thin and cautious conditions, ultimately generating more selling in spot as the prices traded briefly over $1,150 ahead, like platinum, of another hefty slide in early November.
In the background, the Exchange Traded Products saw some scattered buying, with just five days posting net creations (from a total of 22 days). The net change was a gain, just 0.08t, to a total of 15.4t, equivalent to just four weeks’ global mine production (of roughly 195t).
Managed Money on NYMEX actually saw steady fresh longs among the Money Managers, adding 2.4t or 23% to 12.9t – but the shorts were much busier, adding 5.8t (15%) to reach 43.7t, a then record, and which went on to be surpassed in early November.
A very cautious and illiquid market that will at some stage generate a short-covering rally, but the overriding sentiment is that any strength in price (barring exogenous shocks) will be generated by short-covering and nothing else.