

FX Weekly Overview (Brazil Issue)
Dollar to reflect US economic data, Central Bank minutes, inflation in Brazil, and the Middle East

Leonel Mattos
- Currencies
By: John Kicklighter, Head of Market Research
US indices have led sentiment to fresh highs this past week even as the fundamental backdrop struggles to present a solid foothold. Will thin liquidity aid or hamper the swell and what does the event risk ahead propose?
Talking Points:
There was little doubt that risk appetite managed to extend its reach this past week. Among the US indices, the S&P 500 took the symbolic lead with a 3.6 percent rally over the period that pushed the benchmark to fresh record highs, overtaking 7,600, on the biggest week’s rally in five months. With headlines this past week indicating the US-Iran ceasefire was holding, the Fed has reasonable data to cool rate hike pressures and criticism over AI infrastructure spending was easing; there were footholds for bulls to justify their reach. How much ‘relief rally’ is left in geopolitical uncertainties and monetary policy forecasting? Is AI regaining its mantel as a transformative technology for the economy and value creation? Those questions are open to interpretation and may simply constitute justification after the fact, but record highs – which require record cost to add to exposure – naturally draws greater scrutiny.
Chart of S&P 500 with Weekly Rate of Change and VIX – VIX 3 Month Spread (Weekly)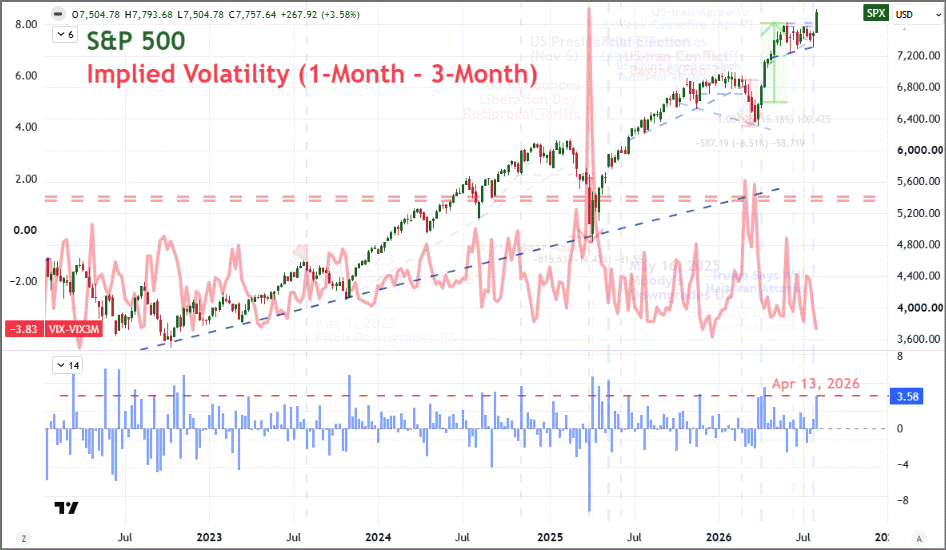
Source: TradingView.com; John Kicklighter
When it comes to sentiment as the foundation for market progress – versus a definitive theme or catalyst – success is generally correlated to breadth. It is rare that one subset of risk-oriented assets can continue to advance while broader markets are struggling and there aren’t solid, unique fundamentals to justify the outperformance. On this front, there is reason to be somewhat cautious on how much enthusiasm there is for establishing traction. While there seems to be a general ‘risk on’ bearing across the global markets, there isn’t nearly as much indulgence for progress from other regions or asset classes. The VEU ‘rest of world’ equity ETF hit a record high weekly close, but this wasn’t a norm amongst the major global indices. Meanwhile, emerging market, high yield fixed income, crypto and carry benchmarks barely registered positive performance on the week – much less record or even near-record highs. There will always be outliers, but it is unlikely that a drive can be sustained without foundational conviction to power the drive.
Risk Appetite Spectrum Measuring Direction and Intensity of Sentiment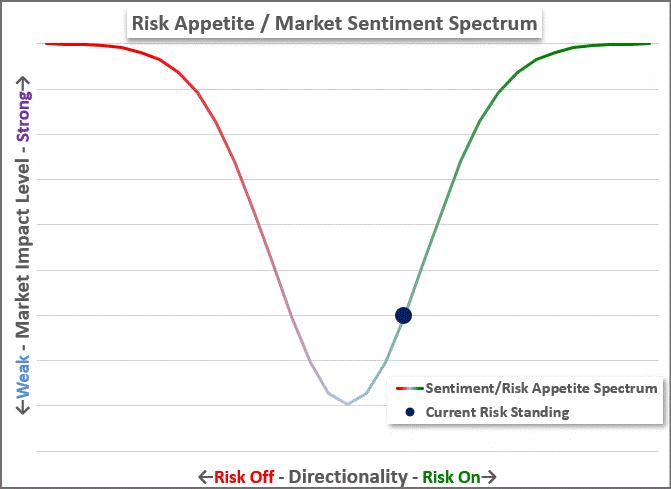
Source: John Kicklighter
Where a lack of breadth and added scrutiny around record highs are potentially limiting factors, there are genuine headwinds that the cautious bulls – or opportunistic bears – should be tracking. One of the most pressing challenges is determining what fundamental guide the markets will lash its ship. Leveraging news trends via Google as a measure, we are coming off a peak in ‘earnings’ interest. That is remarkable given that it came the week after the core Mag 7 companies reported – with generally disappointing initial responses that they subsequently recovered from. We have some corporate reporting ahead (including Nvidia towards the end of this month), but we are definitely on the off ramp for the season. Meanwhile, the headlines around US-Iran tensions and monetary policy have the capacity to feed further discount recovery, but the former has drawn a serious depth of ambivalence from the market and it remains to be seen how much premium can be extracted from throttling nascent rate hikes. Meanwhile, the threadbare interest around tariffs and trade wars only carries a negative potential with markets. The only familiar theme with outright bullish potential is a resurgence in AI speculation, but it may be a high bar to rouse the blind bid back to life.
Worldwide News Search for Key Themes Via Google Trends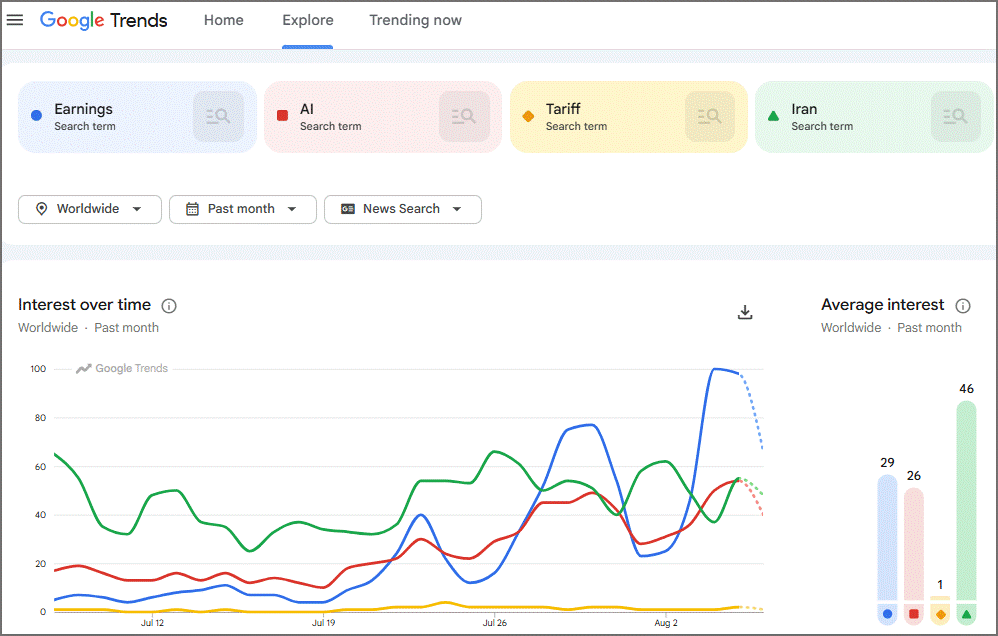
Source: Google Trends; John Kicklighter
If we fail to fix onto a clear theme to inspire conviction – or, less likely, to find the kismet of a concert of drivers that happen to align to distinct bullish or bearish progress – we are more likely to revert to market norms. Where the performance of a benchmark like the S&P 500 through the month of August (essentially unchanged over the past three-quarters of a century) is a product of variable and offsetting year-to-year instances, participation or volume is a more consistent foundational factor. On a trading-day adjusted basis, the month of August has established the lowest relative volume of the calendar year for the index – even more reserved than the year-end holiday period of December. If the markets are naturally questioning the ability to progress at already-record highs, the perception of a thin market will do little to favor bulls. Adding a structural consideration to this seasonal assessment, however, the 13 and 26-week (3 and 6-month) average volume for the S&P 500 stands around 5.7 billion shares, around the highest levels in 9 years.
Chart of S&P 500 Performance and Volume Seasonal Norms by Month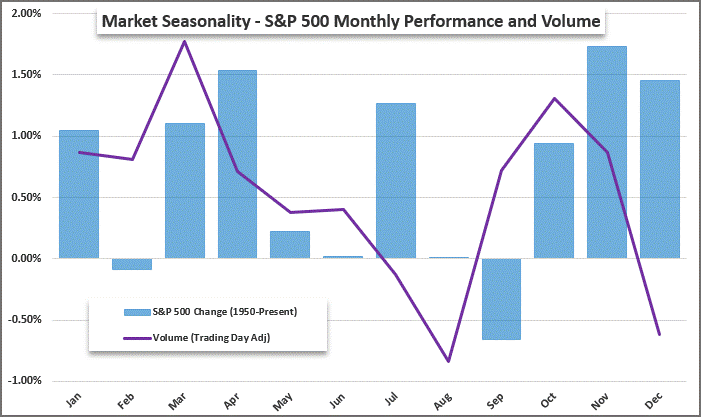
Source: Standard & Poor’s; John Kicklighter
Looking at the scheduled global macro calendar for the coming week, there are a range of listings that are important to interpret into the fabric of the broader market; but there are few stands outs that seem capable of catalyzing meaningful volatility in deep markets. Regionally, the US seems to be the most likely to find event-derived volatility due to its markets’ relative heights and releases like the July CPI update. For thematic-oriented processions, earnings will house few American standouts (though there is Applied Materials) but some top Chinese firms are due to report. Cutting through the back-and-forth in US-Iran headlines, the IEA’s monthly global oil report will present tangible figures. Monetary policy will also have a modest presence between the US, Chinese, Japanese, India and Brazil inflations reports…not to mention the expected RBA rate hold.
Calendar of Major Macro Economic Event Risk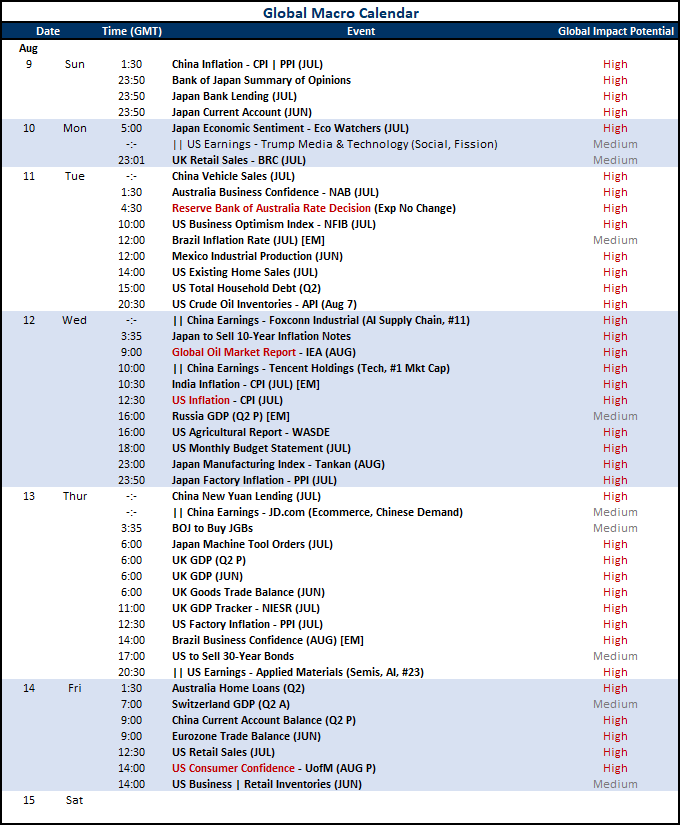
Source: John Kicklighter
For top, singular event risk over the coming week, the July consumer inflation readings for the United States due before the New York Wednesday are the statistics to watch most closely. Though new Fed Chair Kevin Warsh has spun up task forces that may very well alter the stated mix of the group’s mandates or the data feeding into that monitoring, we are still operating with a focus on natural full employment and a consumer inflation rate of approximately 2 percent. The Federal Open Market Committee (FOMC) hasn’t hiked rates in three years, but some central bank officials and the market have indicated expectation that a move to tighten may be ahead. Yet, those convictions have softened these past few weeks; and particularly after this past Friday’s NFP’s miss. The probability of a September hike dropped from 44 percent from 54 percent the day before the jobs report, and 82 percent (of at least 24bps) on July 23rd. It is noteworthy that while payrolls did contract, the jobless rate did drip back to 4.1 percent. This puts more pressure on the CPI figure to offer a definitive pressure one way or the other. Both headline and core inflation readings softened in June and are expected to tick lower further back in the July reading. So, while these readings are still above the Fed’s stated 2 percent target, the more recent curb in energy prices of late will likely amplify any realised moderation.
Federal Reserve Dual Mandate Historical Measures: US Inflation and Jobless Rate (Monthly)
Source: US Bureau of Labor Statistics; John Kicklighter
Another highlight from the US docket this week is the August update from the University of Michigan’s consumer confidence survey. As it is important to remind ourselves, the American consumer is the largest aggregate engine of growth in the world; so its macro influence is particularly weighty. Over the past couple of months, this sentiment survey has attempted to recover from a record low (44.8 in May) on the backdrop of the on-again-off-again US-Iran conflict ceasefire, moderating energy prices and resilient employment and stock market measures. The economist forecast for this update is projecting a retreat (55.2 to 54.6) in the headline figure, which would not read well in financial headlines. That said, the Friday 14:00 GMT release time will curtail the volatility potential from this report.
Chart of the University of Michigan Consumer Confidence and ISM Prices Figures (Monthly)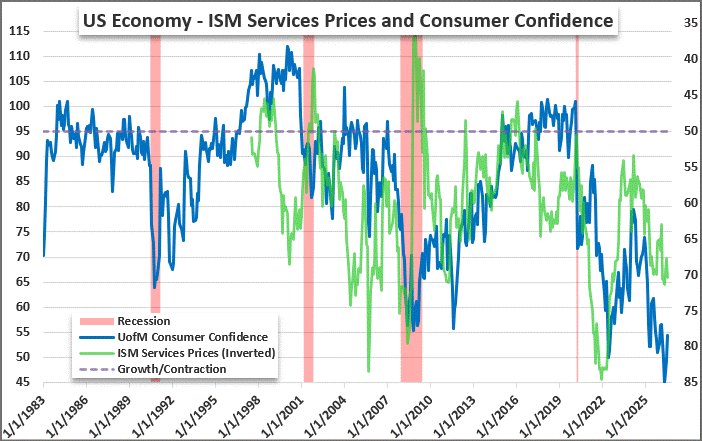
Source: University of Michigan; ISM
In highlighting a third stand out from the calendar, there is plenty to chose from. The RBA rate decision is the only major central bank due to update, but it is seen holding steady. The IEA’s August report is important but energy prices have eased, so the potency will be curbed. Chinese data (inflation, lending, current account and earnings) are worthy of monitoring, but the source naturally restricts its market impact due to international skepticism. One area where there has been unusual volatility that can in turn amplify scheduled event risk is the Japanese Yen and markets. Following Japan’s efforts at FX intervention and the July 30th dual effort between Japanese and US governments, it has become abundantly clear that there is a serious problem and (as yet) no operable solution. As USDJPY threatens to drift higher yet again, events/data like the Bank of Japan’s Summary of Opinions, EcoWatchers sentiment survey, JGB sales, machine tool sales and factory inflation (PPI) will offer small adjustments to add or remove potentially significant traction.
USDJPY Exchange Rate Overlaid with the US-Japan 2-Year Yield Spread and Hike Premium (Daily)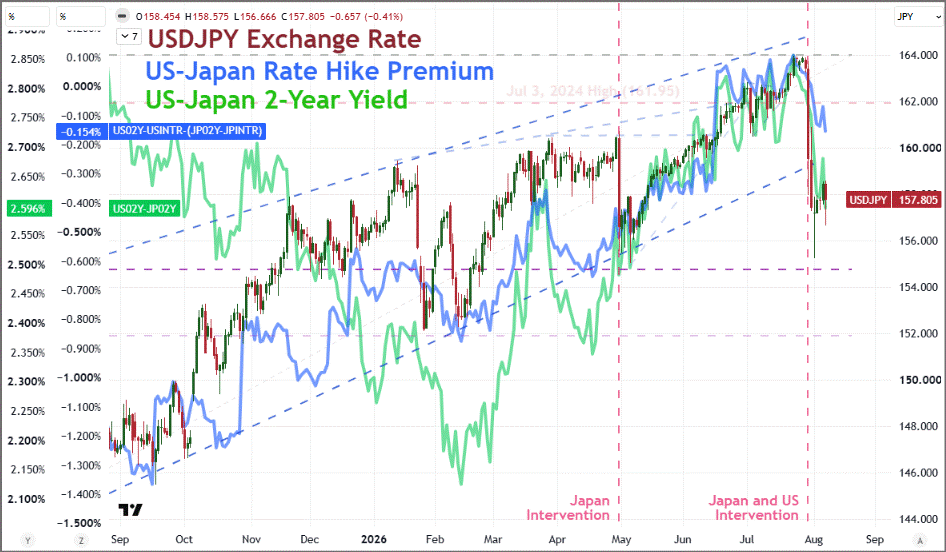
Source: TradingView.com; John Kicklighter
Stay connected to timely global macro analysis designed to help market participants navigate shifting economic conditions and evolving risk. Gain access to regular market commentary, updated quarterly forecasts, a comprehensive two-week forward economic event calendar, and specialized tools built to support informed trading and risk management decisions.
-- Written by John Kicklighter, Global Head of Content
The subsidiaries of StoneX Group Inc. provide financial products and services, including, but not limited to, physical commodities, securities, clearing, global payments, risk management, asset management, foreign exchange, and exchange-traded and over-the-counter derivatives. These financial products and services are offered in accordance with the applicable laws in the jurisdictions in which they are provided and are subject to specific terms, conditions, and restrictions contained in the terms of business applicable to each such offering. Not all products and services are available in all countries. The products and services offered by the StoneX Group of companies involve risk of loss and may not be suitable for all investors. Full Disclaimer. This content is not intended for residents of any particular country, and the information herein is not advice nor a recommendation to trade nor does it constitute an offer or solicitation to buy or sell any financial product or service, by any person or entity in any jurisdiction or country where such distribution or use would be contrary to local law or regulation. Please refer to the Regulatory Disclosure section for entity-specific disclosures. No part of this material may be copied, photocopied or duplicated in any form by any means or redistributed without the prior written consent of StoneX Group Inc. The information herein is provided for informational purposes only. This information is provided on an ‘as-is’ basis and may contain statements and opinions of the StoneX Group of companies as well as excerpts and/or information from public sources and third parties and no warranty, whether express or implied, is given as to its completeness or accuracy. Each company within the StoneX Group of companies (on its own behalf and on behalf of its directors, employees and agents) disclaims any and all liability as well as any third-party claim that may arise from the accuracy and/or completeness of the information detailed herein, as well as the use of or reliance on this information by the recipient, any member of its group or any third party.
© 2026 StoneX Group Inc. all rights reserved.
Our subscribers have access to comprehensive market analysis from StoneX spanning commodities, equities, currencies and more.
Dollar to reflect US economic data, Central Bank minutes, inflation in Brazil, and the Middle East

US indices have led sentiment to fresh highs this past week even as the fundamental backdrop struggles to present a solid foothold. Will thin liquidity aid or hamper the swell and what does the event risk ahead propose?


A softer run of U.S. data is doing more to move the U.S. dollar than any chart, with a jobs report and an inflation print set to land back to back. A cooler U.S. CPI report would hand the Federal Reserve room to ease, and that prospect is already loosening the dollar's grip.

Our market expertise, advanced platforms, global reach, culture of full transparency and commitment to our clients’ success all set us apart in the financial marketplace.
Reach
With access to 40+ derivatives exchanges, 180+ foreign exchange markets, nearly every global securities marketplace and numerous bi-lateral liquidity venues, StoneX’s digital network and deep relationships can take clients anywhere they want to go.
Transparency
As a publicly traded company meeting the highest standards of regulatory compliance in the markets we serve, our financials and record of accomplishment are matters of public record. StoneX’s commitment to “doing the right thing over the easy thing” sets us apart in the industry and helps us build respect, client trust and new partnerships.
Expertise
From our proprietary Market Intelligence platform, to “boots on the ground” expertise from award-winning traders and professionals, we connect our clients directly to actionable insights they can use to make more informed decisions and achieve their goals in the global markets.