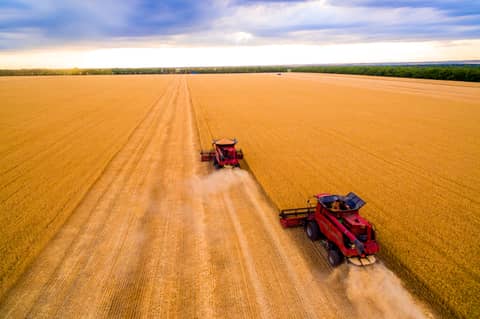
The Great Grain Rally

We will be hard pressed to ever find a time in history quite as extreme and interesting from a price discovery standpoint as the 2020/21 marketing year for corn and soybeans. At the height of the pandemic, we were looking at a 3 billion+ bushel carryout in corn and as late as August 2020, a 600 million+ bushel carryout in soybeans. Prices were at 10+ year lows and there was a real fear of pushing even lower.
As the year went on, surprise USDA adjustments lower on past year stocks, a flash drought in August, a derecho storm through Iowa and Illinois, and record China demand all helped to ignite what we’re dubbing the “Great Grain Rally”, taking prices to 7+ year highs. Think about that again… over the span of just 6 months we went from near decade lows to 7+ year highs! By early 2021, ending stocks have swung incredibly to 1.5 billion for corn and a shockingly tight120 million in soybeans (and record low 2.6% stocks to usage).
Figure 1: Soybean carryout vs. CO/USE RATIO has dropped to its lowest rate since 2013

Source: USDA WASDE
Fig. 2: U.S. Corn Carryout vs. CO/Use Ratio shows ending stocks began to outpace Carryout/Use in 2013

Source: USDA WASDE
Fig. 3: World soybean carryout vs. carryout/use ratio shows a near double digit decrease from 2018 highs. 
Fig 4: Global ending stocks in comparison to carryout

Source: USDA WASDE
USDA adjustments and losses from Mother Nature aside, what was behind China’s seemingly insatiable demand? Most analysts point to the stronger than expected recovery in its Hog Herd. While it is hard to pinpoint, our StoneX boots on the ground in China estimate hog feeding was down 60-70% from pre-ASF levels at the peak of the epidemic. We suspect that figure has since recovered 10-20%.
Often neglected and perhaps an equally important impact of China’s demand comeback could be the fact that the Chinese government eliminated food waste in rations. It is hard for the average Westerner to fully understand the size and scope of food waste feeding that was occurring prior to ASF, which is now banned. However, we must acknowledge all of that must be replaced with soymeal, corn, or alternative feeds. As such, we at StoneX believe USDA’s current soymeal demand estimates for this year have more upside risk, not even considering the continued growth of the hog herd.
Fig. 5: Graph illustrating Chinese soybean imports in metric tons increasing from 2004 through 2020

Source: USDA WASDE
Fig. 6: Line graph illustrating rise in U.S. soymeal demand from 1990 through 2020

Source: USDA WASDE
Fig. 7: Bar graph illustrating Chinese hog production in relation to year end stocks from 2008 through 2020

Source: USDA WASDE
As three typhoons ravaged China’s crop producing regions in September, the price of corn in its domestic (southern livestock) market shot up close to $12/ bushel! At the time, analysts estimated China’s corn crop to fall by up to 10 MMTs or nearly 4% (Reuters/ COFCO). However shortly after the storms, China’s Agriculture Ministry said damage from the typhoons was negligible, amounting to only about 1.8 MMT worth of lost production (totaling 265 MMT which was still up from its estimate for 2019/20 output). So, what gives?
As feed shortages became evident in the price of domestic corn, soymeal, and wheat, China’s imports of crops it usually hardly ever touches begins to grow. Is this all attributable to the hog herd recovery and according to the Chinese government, minimal crop damage from September’s typhoons? If so, why the extreme deviation from import levels prior to ASF?
Fig. 8: Line graph illustrating the price of China Dalian Corn Futures Raising steadily over from early 2020 to early 2021

Source: USDA WASDE
Fig. 9: Graph illustrating a rise in Chinese corn production by millions of metric tons from 1961 to 2019

Source: USDA WASDE
Fig. 10: Graph illustrating the doubling of Chinese corn imports in millions of metric tons from 2019 to 2020

Source: Bloomberg
In this next section, we are going to shift gears and discuss the important geo-political relationship between China and Taiwan. Our goal is to frame recent China feed demand within the context of that relationship to give readers of this article full context from which to assess potential risk factors in the U.S. commodity markets going forward.
China/Taiwan history
Following Civil War in 1949, the Chinese communist party forced the previous government to flee to the island of Taiwan. Thereafter, both sides set up governments claiming to be the true government of China, leading to decades of competition and hostility. Civic ties ceased to exist and the threat of military action was ever-present up until the 1990s. At that time, diplomacy allowed both sides to set aside the topic of sovereignty and focus instead on areas of economic cooperation (among other things). However, the underlying grudges were never fully addressed.
1949
Chiang Kai-Sheck’s Nationalists loses civil war to Mao’s Communist forces, setting up government-in-exile on Taiwan.
1971
Beijing assumes China’s seat at the United Nations, previously held by Taipei.
1987
After decades of hostility, Taiwan and China embark on cautious rapprochement, allowing for cross strait family visits.
1995
Taiwan President Lee enrages Beijing by making landmark, private trip to the U.S.
1998
Taiwan envoy Koo Chen-fu meets Jiang in China in highest level contact in nearly five decades.
2001
Taiwan opens direct but limited trade and travel links with China. In November, Taiwan partially eases decades-old curbs on Chinese visiting the island in a goodwill gesture.
2003
First Taiwan commercial flight to China for more than 50 years arrives in Shanghai, but had to travel via Hong Kong.
2005
China’s parliament passes anti-secession bill authorizing the use of force if Taiwan declares independence.
2010
China and Taiwan sign a sweeping Economic Cooperation Framework Agreement.
2014
China and Taiwan hold the first government-to-government talks since separation.
2016
Tsai Ing-wen, from the traditionally proindependence democratic progressive party, wins elections to become Taiwan’s first female president and does not acknowledge the “one
China” consensus.
2017
Trump’s administration approves US$1.4 billion worth of arms sales to Taiwan, prompting anger from Beijing.
2018
The U.S. adopts a law reinforcing ties with Taiwan, again infuriating China.
2020
Chinese warplanes breach Taiwan Strait’s median line as the conflict between Taiwan and China increases.
China/Taiwan today: Escalating tensions
Increasing Military Exercises China’s policy toward Taiwan in recent months has been defined as a “gray zone strategy” whereby it dispatches ships and planes on a regular basis to harass Taiwan’s civil and military leaders. While this may be the preferred policy for the foreseeable future, we cannot rule out the risk of more direct military action.
Examples…...
“Those who play with fire will get burnt”
– Ren Guiqiang, China Defense Ministry Spokesperson
September 18, 2020:
China holds military drill as US envoy visits Taiwan
“Tensions over Taiwan have risen sharply in recent weeks as Beijing has ramped up military pressure with its warplanes almost daily crossing the sensitive “median line” of the Taiwan Strait that normally serves as an unofficial buffer zone.”
October 11, 2020:
China Holds Military Invasion Drill Amid Tensions with Taiwan
“The United States government has so far announced $5.1 billion in arms sales to democratically ruled Taiwan in 2020, to the anger of China which claims the island as its own territory.”
December 7, 2020:
United States announced $5.1 billion in Arms Sales to Taiwan
“While the frequency of such drills has increased in recent years, the timing and the composition of the latest formations -- mostly fighter jets and bombers -- appeared intended to send a message to the new administration in Washington.”
January 23, 2021:
China flies warplanes close to Taiwan in early test of Biden
“…Taiwan independence means war.” – Wu Qian, China Defense Ministry Spokesperson
January 29, 2021:
China warns Taiwan that any attempt to seek independence "means war"
February 4, 2021:
Former US official warns Taiwanese may be forced to make sacrifice
February 5, 2021:
China’s latest weapon against Taiwan: the sand dredger
“The task of building a powerful navy has never been as urgent as it is today” – President Xi Jinping
March 5, 2021:
China Has Built the World’s Largest Navy. Now What’s Beijing going to do with it?
We would like to pause here and note that there are many factors that go into determining China’s foreign policy and we do not wish to raise alarm unnecessarily. Any potential military excursion into Taiwan would likely trigger very serious consequences from the international community and the Chinese government is aware of that. This paper aims to merely frame recent Chinese demand alongside the China/Taiwan relationship so that our Producer audience can have a fuller understanding of the big picture. The Great Grain Rally of 2020/21 was driven in large part by China demand, so we ought to be very closely monitoring any potential risk associated with disrupting that demand.
Step outside of market speculation and consider a similar analogy in the world of meteorology. The time to prepare for a significant weather event is done in the days and weeks ahead, based on a reasonable assessment of the risk associated to your property or loved ones. You do not want to be out boarding up windows in the middle of a hurricane or trying to get out to the gas station when there is a foot of snow on the ground. We look at hedging and controlling your market price the same way. With that in mind, let’s move on the next section.
Is China’s record corn/soybean buying a canary in the coal mine?
What is behind China’s historic demand for US feed ingredients? Is it truly just to feed a thriving hog industry or is it perhaps a stockpiling effort?
Here is what we know:
The soybean business is for real. China’s domestic soybeans are non-GMO for human consumption, so its crushing industry for livestock is at the port. Our people on the ground see no indication of notable movement toward storage inland, and port storage levels of soybeans are near seasonal levels.
Figure 11: Line graph illustrating Chinese Soybean Port Stock totals down from historic highs to 8.0 million metric tons in Feb 2021

Source: Bloomberg
China’s growing demand for corn is real as well, but that doesn’t translate into firm answers regarding its intentions. StoneX has consistently estimated this year’s corn deficit at 30 MMT. The Chinese government went from 15 MMT, to now up to about 28 MMT in deficit. However, it has already filled that for the current year with wheat releases from its reserve into the feed grain market, along with grain sorghum and barley imports.
Fig. 12: Bar graph illustrating a substantial increase weekly wheat auction totals in millions of metric tons traded in 2021

Source: National Grin Trade Center
Here is what we don’t know:
Why did China bundle its recent record corn sales (5,860,400 MT of US Corn sold to China week ending February 4, 2021)? Historically, it likes to spread out purchases over time to minimize market impact, and bundled announcements like this are typically meant for political purposes. We note that China sometimes takes delivery of large purchases, but other times will cancel and opt for a cheaper origin later or roll the purchase forward to the next marketing year. Another question we are left asking is why do this when the ruling Communist Party continues to publicly speak out against big corn imports that would hurt its ability to be self-sufficient?
Fig. 13: Graph illustrating new vs old crop weekly export sales between 2012 and 2021

Source: Bloomberg
Fig. 14: Graph comparing 2019/20 to 2020/21 progress in the U.S. soybean export inspection process

China is a student of history
The line of thought in this paper concludes with us asking the question – is China stockpiling corn knowing that its suspected plans for attacking Taiwan could result in an U.S. grain embargo? This has not been talked about much in the United States media, but China has seen that tendency among Democratic U.S. Presidents in the past so we aim to take that under consideration.
As risk managers, we must hope for the best but also plan for the worst.
Over the near term there are several reasons to view support for the ag markets over the coming months, most notably the need to attract substantial acres and extreme shortage of soybeans for domestic processors come summer. However there also appears to be enough uncertainty in the air to at least raise the question if China, expecting international backlash and a potential trade embargo, is stockpiling feed ingredients ahead of a planned Taiwan military intervention? If the worst-case scenario plays out and demand suddenly dries up, where does that leave the US ag markets?
Current managed money position is historically “long” CBOT grain and oilseeds and position limits are set to expand further on March 15. That will open the door for even more speculative length, but it also heightens the risk for volatile markets if something negative for price were to occur, whether it be geo-political in nature or something else.
Other risks we are actively monitoring and advising clients on include:
- Recent outbreaks of African Swine Fever in China (ASF),
- Currency weakness in the Brazil Real vs USD and impact on ‘21/’22 planted acres in Brazil,
- La Nina impact on the US growing season,
- Mexican government decision to phase out GMO corn use over the next 3 years and the potential impact
Fig. 16: Soybeans, managed futures vs. price 2019-2021

Source: CFTC
About the authors
Tom Dosdall specializes in working with commercial participants in the agriculture industry, both growers and merchants, to better manage price risk and opportunity for the commodities they buy or sell. As a Series 3 licensed futures and options broker with over a decade of experience, Tom has focused expertise in the corn, soybeans, wheat, cattle, dairy, and lean hog markets. Tom’s extensive brokerage experience includes intertwining physical/cash markets and client profit margins with the intricacies of futures and options strategy execution. Technical price chart analysis used to professionally manage risk or create leverage, as market conditions dictate, is a key component of Tom’s daily interaction with clients. With deep ancillary knowledge of currencies, energies and feed usage, Tom offers his clients a well-rounded perspective and comprehensive guidance.
In addition to serving as a broker, Tom is the creator and publisher of Technical Ag Knowledge, a video e-newsletter spotlighting technical chart formations in the agricultural futures markets.
Phone: 312-706-7631 • Email: Thomas.Dosdall@StoneX.com
Arlan Suderman is the Chief Commodities Economist for StoneX Group Inc. – FCM Division, a financial services provider for global markets. Suderman oversees the company’s commodity market intelligence efforts. He provides unique market insight on global macro-economic trends and their implications for the commodity markets.
Suderman is a leading commentator in the Ag commodity sector, with expertise in the interaction with the broader markets.
Previously, Suderman served as Senior Market Analyst at Water Street Solutions, an agricultural consulting firm.
Prior to that, Suderman was a Market Analyst for Farm Futures magazine and FarmFutures.com, while also providing written daily market commentary for Farm Progress Companies’ family of state and regional publications and websites.
Suderman started his career with the Kansas Extension Service, developing educational programming focused on crop production, marketing and risk management. He later worked for a private consulting service helping farmers with marketing and risk management.
A graduate of Kansas State University, with a degree specializing in Animal Science & Industry, Suderman has an expertise and passion for the markets that gives him valuable insight into the realities of macro-economic trends and how they influence the commodity markets. He shares his market commentary daily on Twitter with 33,000 followers, as well as on StoneX’s Market Intelligence Web site. Arlan can be heard daily on many radio stations across the Midwest as well as on Sirius XM Rural Radio and weekly on RFD-TV’s Market Day Report.
Phone: 816-410-3305 • Email: Arlan.Suderman@StoneX.com