The Santa Claus rally is one of the most ubiquitous seasonal trends in markets, where investors often associate the seasonal cheer to underlying performance. What really leads to these expectations and what other ‘seasonal trends’ are there?
Talking Points:
Seasonality refers to recurring patterns in liquidity, volatility, and market behavior tied to specific points in time
Seasonality isn’t just a consideration through a typical year - there are volume and open interest norms intraday (sessions), intra-week (pre- and post-week) and intra-month (expiries)
Most common in this category are changes through a calendar year tracking societal norms like typical vacation periods or accounting time frames such as fund rebalancing
To sign up for the Trading Global Macro podcast, find it on your preferred podcast platform: Apple Podcasts, Spotify, or YouTube.
What is Seasonality
Market behavior may not be as random as many suspect. Prices move in response to fundamental news, central bank policies, shifts in sentiment, and ongoing global macro forces. But there is another influence - often less appreciated by market participants and analysts - that shapes the backdrop for all other analysis: seasonality.
Seasonality refers to recurring patterns in liquidity, volatility, and market behavior tied to specific points in time. These patterns can play out within a single trading day, across days of the week, around monthly or quarterly cycles, or as broader annual tendencies recognized by generations of traders.
Drivers of these tendencies includes structural and external forces such as:
Liquidity cycles
Institutional behavior and accounting periods
Derivative flows such as ETF rebalancing and derivatives expirations
Behavioral biases and societal events (such as school schedules and holidays)
Other macro themes that align with typical timing conventions
Annual Seasonality: From the January Effect to Santa Claus
Some of the best-known seasonal trends unfold over the full calendar year.
The January Effect
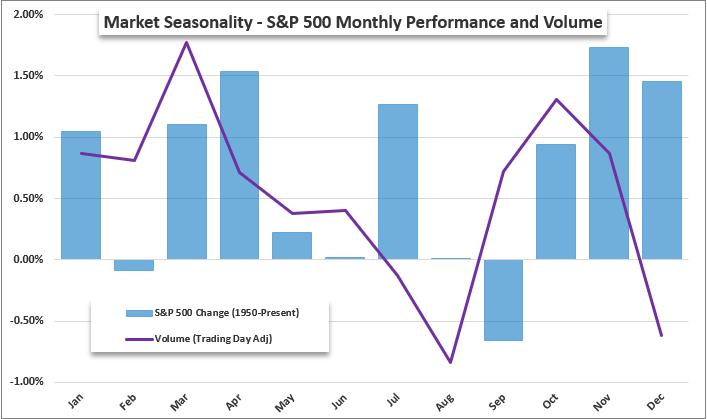
Historically, U.S. equities - particularly small caps - have shown strength early in the year as investors buy back stocks they sold at year-end for tax purposes. While the magnitude of this effect has faded over time, it remains broadly engrained in the collective outlook and seems to average out in benchmark market measures’ performance.
Sell in May & Go Away / The Summer Doldrums
As the Spring gives way to Summer (for the Northern Hemisphere) participation tends to deflate with volume and open interest fading into the holiday period. In some cases, the reduced activity can leave markets little moved or there can arise a tepid bullish bias to remain ‘exposed’ to a yield-oriented setting. Leading into the approach of quiet has led to the ‘Sell in May and Go Away’ setting and the subsequent months before the US Labor Day holiday (as a loose turning point) can see relatively exaggerated quiet, as extreme as what was witnessed in 2017.
The Santa Claus Rally
Perhaps the most recognizable seasonal pattern, the Santa Claus Rally, refers to the final trading weeks of December carried over into the opening days of the subsequent January. Historically, this window has produced above-average equity returns. While some ascribe the climb to the same ‘good vibes’ as is expected with the holiday, more pointed explanations range from performance chasing by fund managers to benign liquidity conditions and lower macro headline risk.
Chart of S&P 500 Monthly Seasonality for Performance and Volume Over Past 75 Years
Source: John Kicklighter, Standard & Poor’s
Monthly & Quarterly Patterns: Rebalancing and Expirations
As we tighten the timeframe, structural drivers become more prominent.
Fund Rebalancing
Institutional investors rebalance portfolios monthly or quarterly, depending on mandate. When equities have significantly out- or under-performed bonds, or vice versa, mechanical rebalancing flows can create measurable price pressure at month-end.
Derivatives Expirations
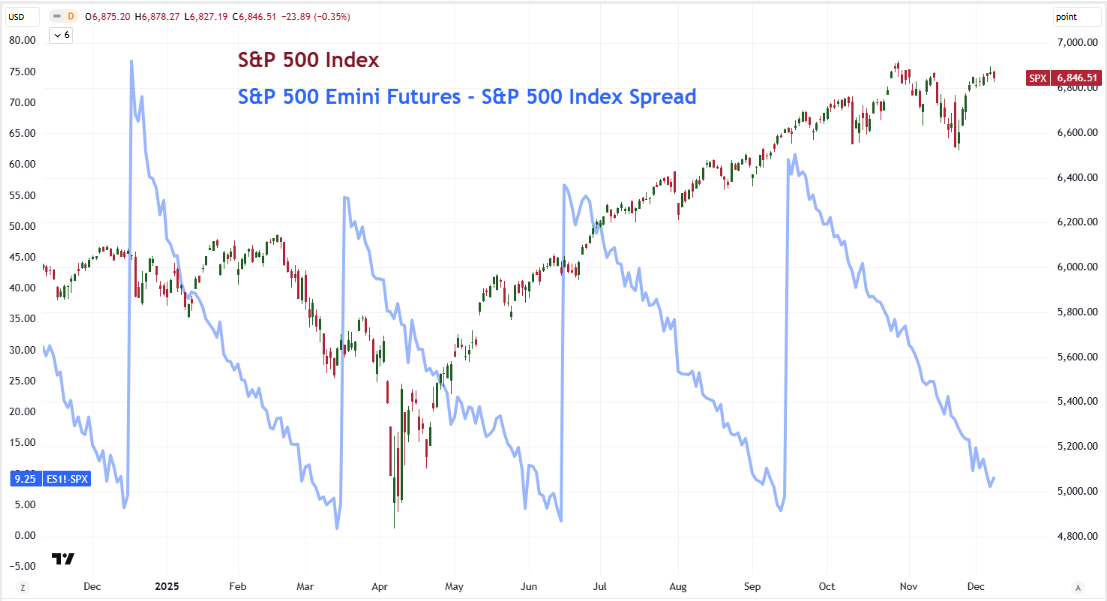
Futures and options contracts tied to major indices, commodities, and FX products expire on predictable schedules. Quarterly expirations - especially the period of convergence in expiries called ‘triple/quadruple witching’ - can bring pronounced volatility and volume spikes as positions unwind or roll to the next contract.
These flows are structural, recurring, and often powerful enough to influence both spot and derivative markets.
Chart of S&P 500 and Futures-Index Price Difference (Daily) Source: TradingView, Standard & Poor’s, CME
Weekly Seasonality: The Impact of the Trading Cycle
A similar rhythm plays out across the trading week. Market behavior often shifts into predictable phases:
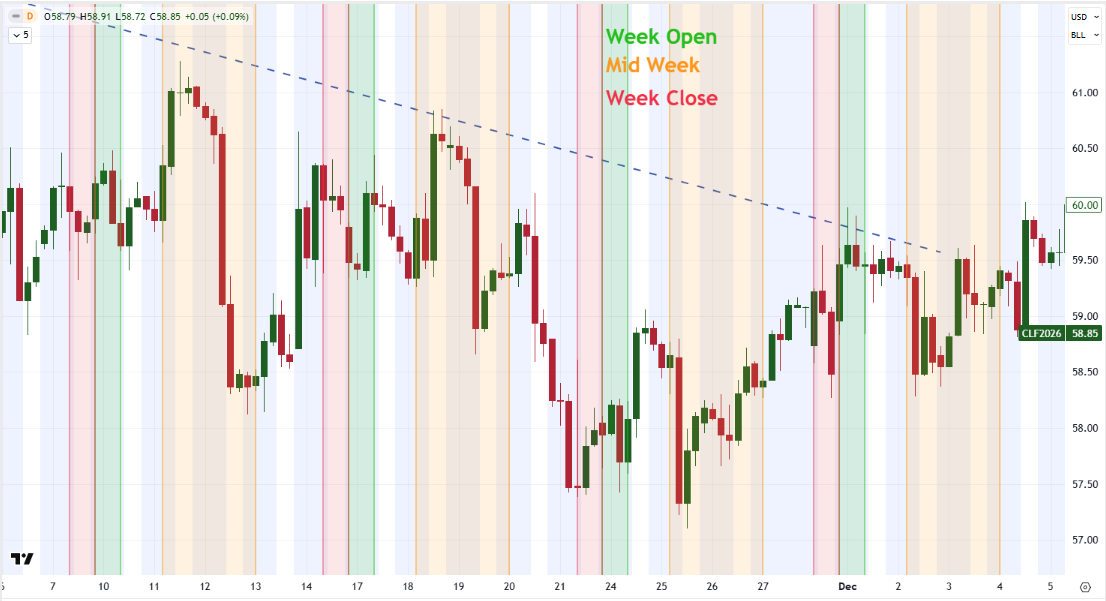
Mondays: Heavy repricing as two to three days’ worth of news – over the weekend – necessitates a one-time repricing upon the Monday open.
Mid-week: Historically higher liquidity and trend continuation as traders become more vested into the systemic/thematic narratives of the week.
Fridays: Position squaring, profit-taking, and risk reduction ahead of weekend event risk by those with shorter holding periods or have lost conviction in an extended move.
These patterns are driven far more by ‘trader’ behavior and risk management constraints than by macroeconomic forces, but are frequent markets norms that arise all the same.
Chart of Crude Oil Chart Through Multiple Weeks (8 Hour) Source: TradingView.com, CME, John Kicklighter
Intraday Seasonality: The Rhythm of Global Sessions
While traders often think of seasonality in terms of annual or monthly cycles, some of the most consistent, time-based norms in price action occur within a single 24-hour cycle.
Global markets follow the sun as new financial centers come online and more eastern locations eventually close for the day. In chronological order, the major liquidity centers are Tokyo (Asia Pacific hours), London (European hours), and New York (Americas hours); and each carries its own contribution to the global rhythm.
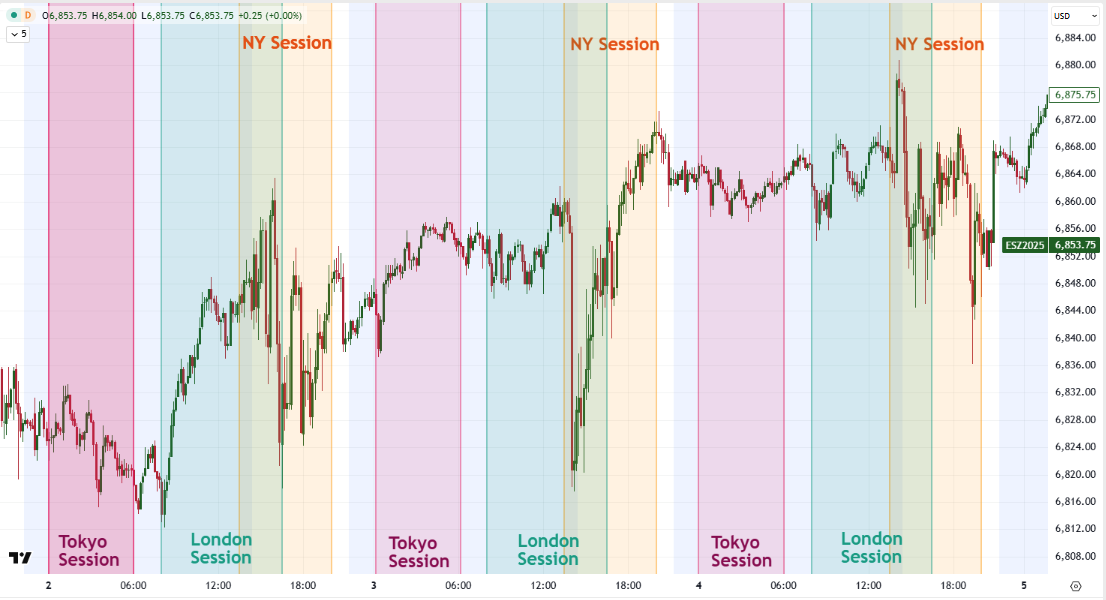
Tokyo session: The start of the ‘trading day’ following a gap since the US close with adjustment to previous day systemic fundamental developments. No real overlap to exchange hours in major European and American financial centers. Event risk concentrated near the open of the session and near the close.
London session: The cumulative liquidity of mainland Europe, African and UK exchanges sees a significant increase in total liquidity. There is carry over interest from Asian investors looking to participate in Western/European markets for higher rates with higher credit rating in comparable assets. The afternoon session overlaps with the New York morning hours where the heaviest participation, turnover and volatility are realized in a standard day.
New York session: The morning hours of the New York session (just before the official exchange open and including the first hours of trade) host the typical release of the most market-influential US event risk. This is where the greatest volatility is also realized. There is volatility into the afternoon session and close, but it tends to be significantly less.
These session-based patterns are not unique to equity indices. They are very much echoed in FX pairs, commodities, fixed income and more. So, while these are not often referenced as “seasonal” patterns, they carry the key factors and should be appreciated by market participants.
Chart of S&P 500 Emini Futures Divided into Major Global Financial Sessions (10 Minute)
The subsidiaries of StoneX Group Inc. provide financial products and services, including, but not limited to, physical commodities, securities, clearing, global payments, risk management, asset management, foreign exchange, and exchange-traded and over-the-counter derivatives. These financial products and services are offered in accordance with the applicable laws in the jurisdictions in which they are provided and are subject to specific terms, conditions, and restrictions contained in the terms of business applicable to each such offering. Not all products and services are available in all countries. The products and services offered by the StoneX Group of companies involve risk of loss and may not be suitable for all investors. Full Disclaimer.
This content is not intended for residents of any particular country, and the information herein is not advice nor a recommendation to trade nor does it constitute an offer or solicitation to buy or sell any financial product or service, by any person or entity in any jurisdiction or country where such distribution or use would be contrary to local law or regulation. Please refer to the Regulatory Disclosure section for entity-specific disclosures.
No part of this material may be copied, photocopied or duplicated in any form by any means or redistributed without the prior written consent of StoneX Group Inc. The information herein is provided for informational purposes only. This information is provided on an ‘as-is’ basis and may contain statements and opinions of the StoneX Group of companies as well as excerpts and/or information from public sources and third parties and no warranty, whether express or implied, is given as to its completeness or accuracy. Each company within the StoneX Group of companies (on its own behalf and on behalf of its directors, employees and agents) disclaims any and all liability as well as any third-party claim that may arise from the accuracy and/or completeness of the information detailed herein, as well as the use of or reliance on this information by the recipient, any member of its group or any third party.
Currencies
StoneX TV content is created, produced, and distributed solely by StoneX Media Ltd (“StoneX TV”) and is provided for informational and educational purposes only. StoneX TV does not provide investment, financial, legal, or tax advice and does not make any recommendation or endorsement of any investment strategy, transaction, or financial instrument. Nothing in this content constitutes, or should be construed as, investment advice or a recommendation to buy, sell, or hold any financial instrument, including securities, futures, derivatives, digital assets, foreign exchange products, or CFDs. This content does not constitute an offer, invitation, or solicitation to engage in any investment activity. The information presented is general in nature and is not tailored to the financial situation, investment objectives, or risk tolerance of any specific person. You should not rely on this content as a substitute for independent professional advice. Investing and trading in financial instruments involves significant risk of loss and is not suitable for all investors. Past performance is not indicative of future results. Any views or opinions expressed are those of the presenter at the time of publication and are subject to change without notice. Such views may not necessarily reflect those of StoneX Media Ltd or its affiliates. StoneX Media Ltd and its affiliates, including StoneX Group Inc., may from time to time have positions in, or engage in transactions involving, the financial instruments referenced. This content may include general market commentary and opinion. It does not constitute independent investment research and has not been prepared in accordance with legal requirements designed to promote the independence of investment research. StoneX Media Ltd is not authorised or regulated to provide investment services and does not act in a fiduciary capacity. StoneX Media Ltd is incorporated in Ireland and operates in accordance with applicable Irish law. It is a wholly owned subsidiary of StoneX Group Inc. and is a separate legal entity from other subsidiaries within the StoneX Group, which may be regulated in various jurisdictions. StoneX Media Ltd does not act on behalf of, or provide services for, any regulated affiliate. This content is not directed at, and may not be distributed to, any person in any jurisdiction where such distribution would be contrary to local laws or regulations. Supporting documentation for any claims, comparisons, statistics, or technical data may be made available upon reasonable request, where applicable.
Discover more insights
Our subscribers have access to comprehensive market analysis from StoneX spanning commodities, equities, currencies and more.
Our market expertise, advanced platforms, global reach, culture of full transparency and commitment to our clients’ success all set us apart in the financial marketplace.
Reach
With access to 40+ derivatives exchanges, 180+ foreign exchange markets, nearly every global securities marketplace and numerous bi-lateral liquidity venues, StoneX’s digital network and deep relationships can take clients anywhere they want to go.
Transparency
As a publicly traded company meeting the highest standards of regulatory compliance in the markets we serve, our financials and record of accomplishment are matters of public record. StoneX’s commitment to “doing the right thing over the easy thing” sets us apart in the industry and helps us build respect, client trust and new partnerships.
Expertise
From our proprietary Market Intelligence platform, to “boots on the ground” expertise from award-winning traders and professionals, we connect our clients directly to actionable insights they can use to make more informed decisions and achieve their goals in the global markets.