Market Seasonality Report – May 2025: Sell in May and Go Away…Or Nay?
Key Talking Points:
- The S&P 500 has risen in 9 of the last 10 Mays, suggesting that the classic aphorism “Sell in May and Go Away” may need to be revisited, or at least delayed
- The VIX typically declines in May heading into the proverbial summer doldrums before volatility picks up again in Q3
- The long-term seasonal trend suggests gold may be well positioned to extend its historic rally amidst still-falling interest rates globally, trade uncertainty, and a well-established uptrend
The beginning of a new month marks a good opportunity to review the seasonal patterns that have influenced the markets since 1990.
As always, these seasonal tendencies are just historical averages, and any individual month or year may vary from the historic average, so it’s important to complement these seasonal leans with alternative forms of analysis to create a long-term successful trading strategy. In other words, past performance is not necessarily indicative of future results.
S&P 500 Seasonality – S&P 500 (Price-Only)
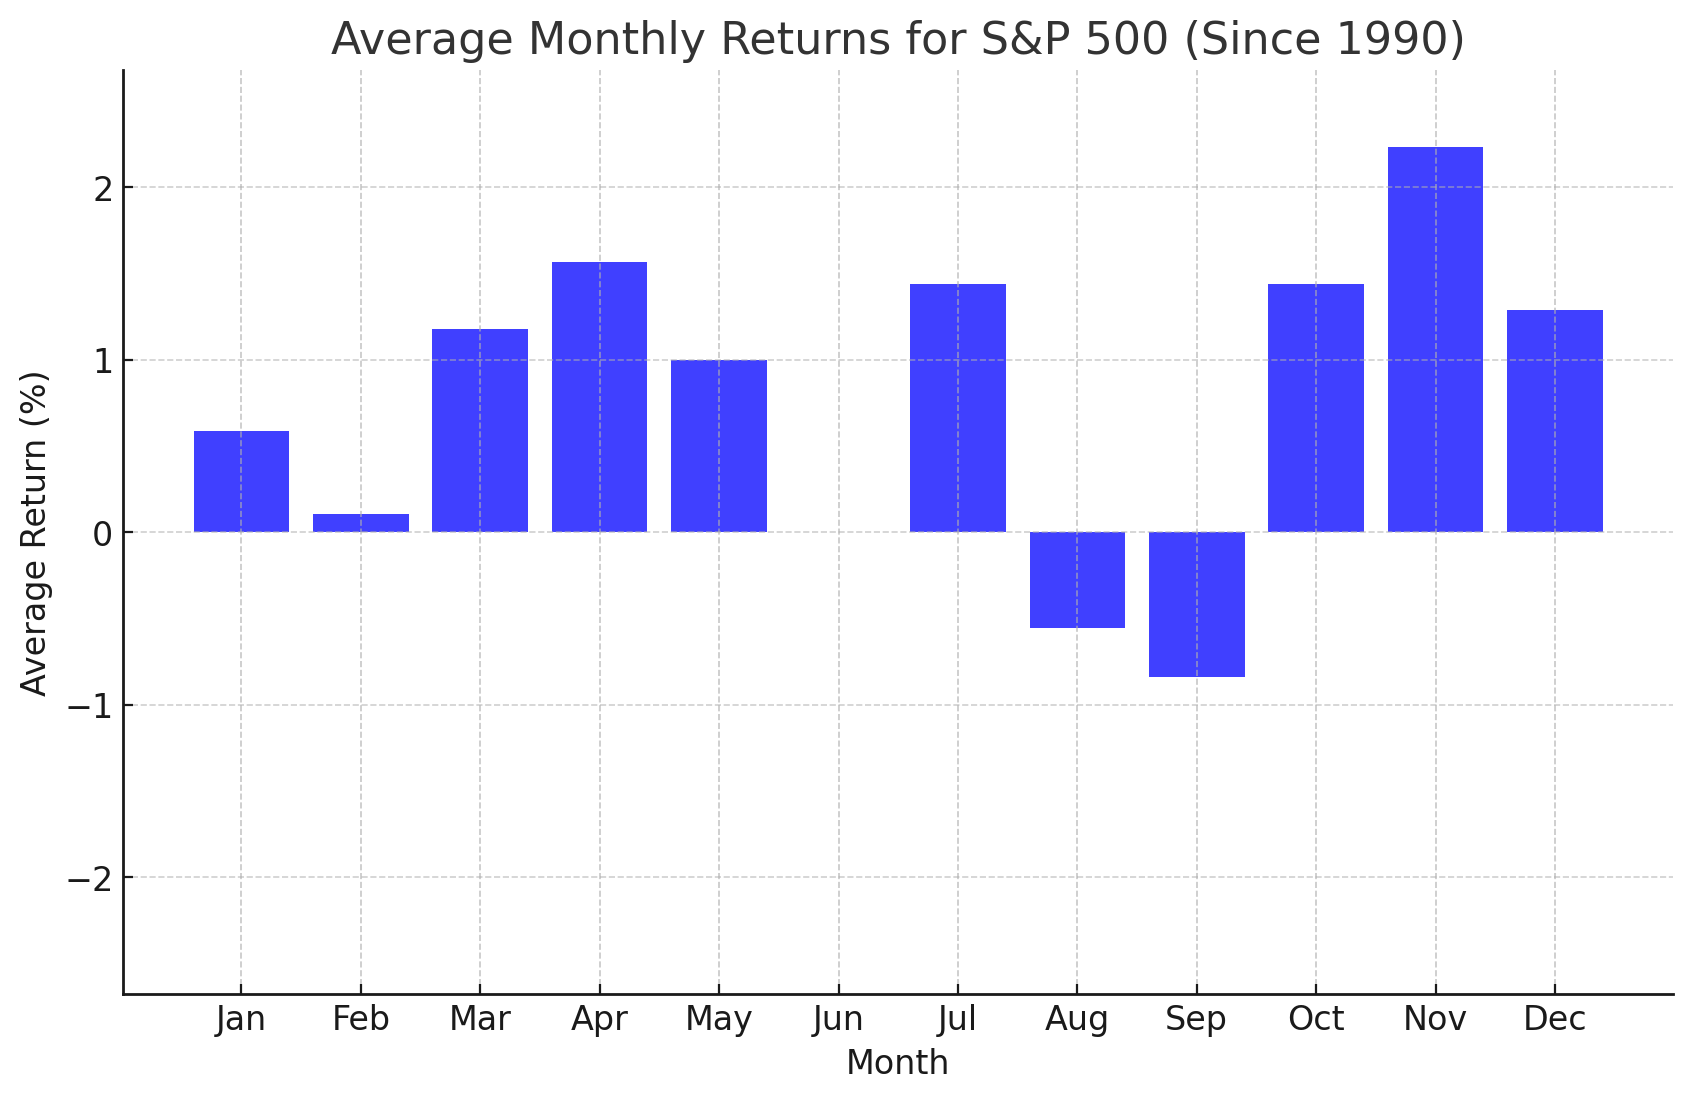
Chart Source: TradingView, StoneX.Please note that past performance is not necessarily indicative of future results.
Historically, May has been a solid month for US stocks, with the broad S&P 500 index sporting an average (price-only) return of +1.0% over the last 35 years. Following on the back of an absolutely WILD, but ultimately only slightly bearish April, it’s admittedly difficult to paint a bullish picture for stocks given the overhang of lingering tariffs and imminent supply chain disruptions. That said, it’s important to remember that the market is always forward looking and perhaps progress toward trade deals – especially between the US and China – could lead to a rising market. While it may be even more tempting than usual to “Sell in May and Go Away”, it’s worth noting that the S&P 500 has only fallen in one of the past 10 Mays.
Nasdaq 100 Seasonality – NDX (Price-Only)
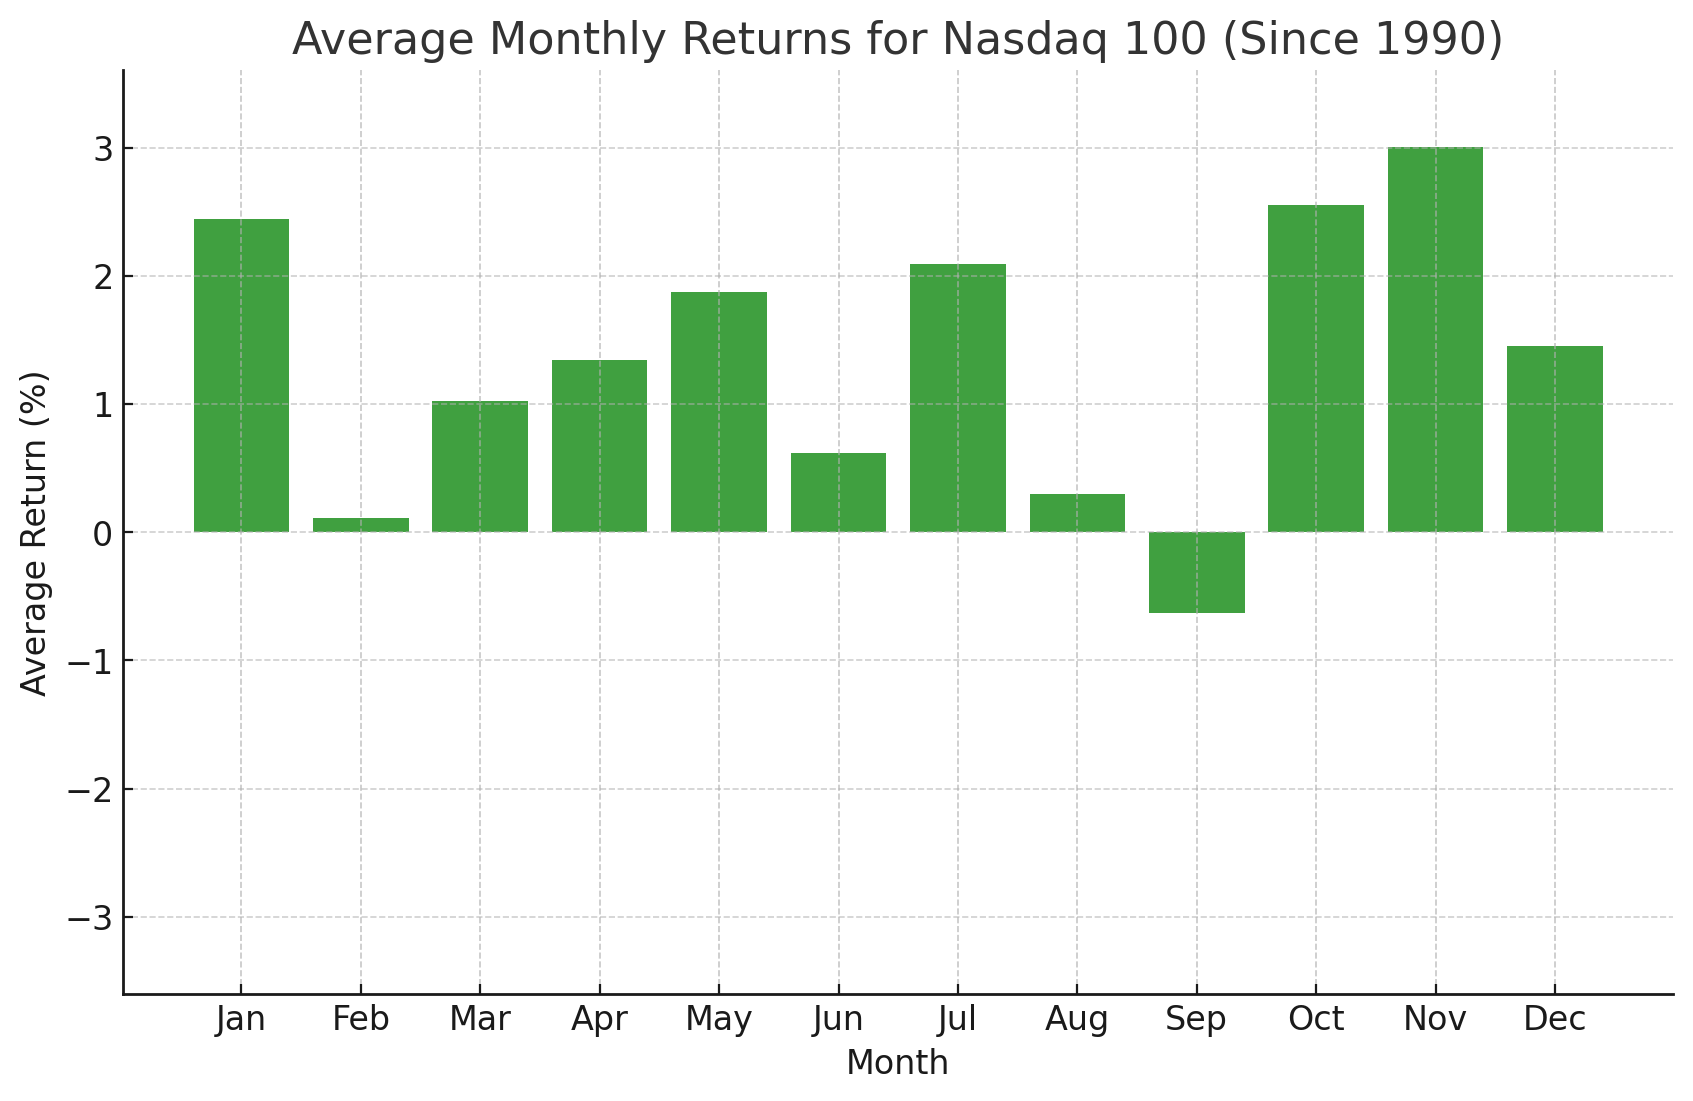
Chart Source: TradingView, StoneX. Please note that past performance is not necessarily indicative of future results.
Looking at the above chart, the Nasdaq 100 has historically rallied in May as well, to the tune of +1.9% since 1990. Long the leader among the US indices, the Nasdaq 100 is seeing the worst performance of the major US indices year-to-date as the shine comes off the AI-driven “Magnificent Seven” trade, including the quintessential AI darling, Nvidia, which reports earnings on May 28th.
Volatility Index Seasonality – VIX
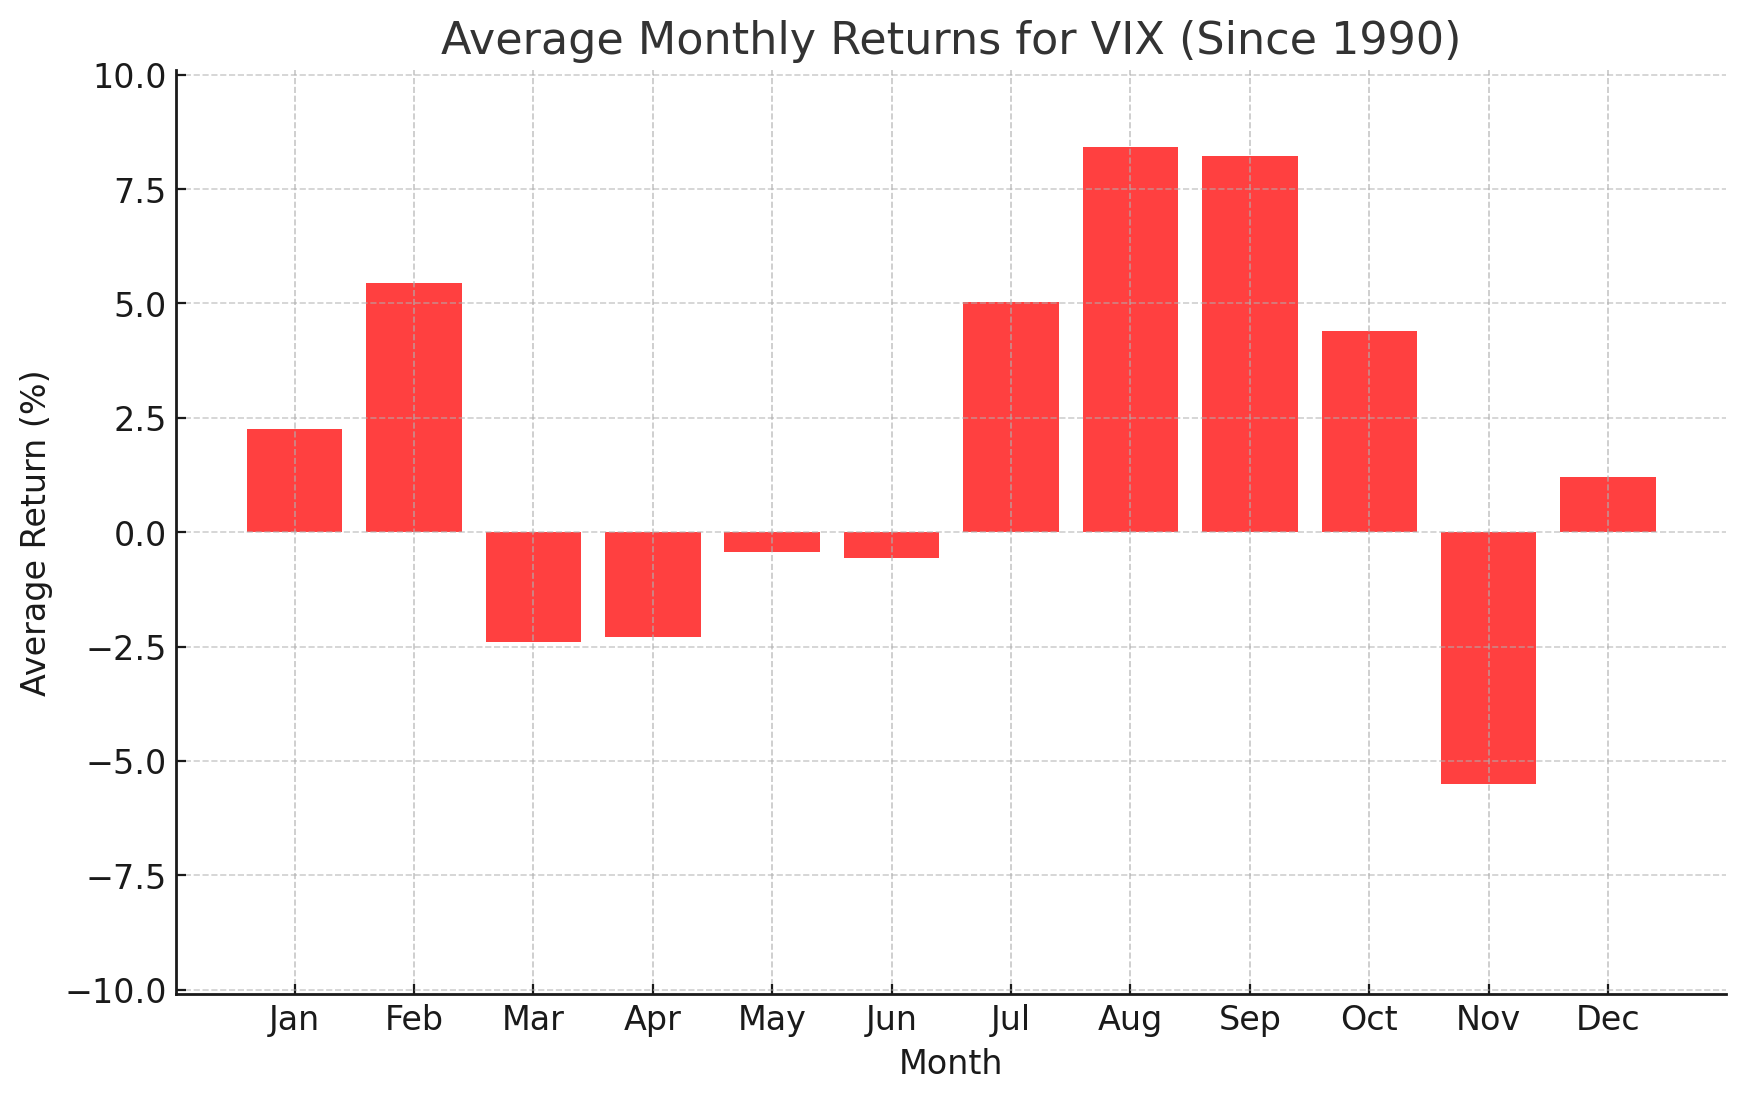
Chart Source: TradingView, StoneX. Please note that past performance is not necessarily indicative of future results.
Like April, May has historically been a month where stock market volatility falls, with the VIX index contracting by an average of -0.4% since 1990. That said, Wall Street’s proverbial “fear gauge” bucked the seasonal trend last month, rising to about 25 as of writing primarily on the back of the uncertainty driven by US trade policies. If those show signs of resolving and allowing businesses to plan future investments, volatility could decline in an early start of the classic summer doldrums.
Gold Seasonality – XAU/USD
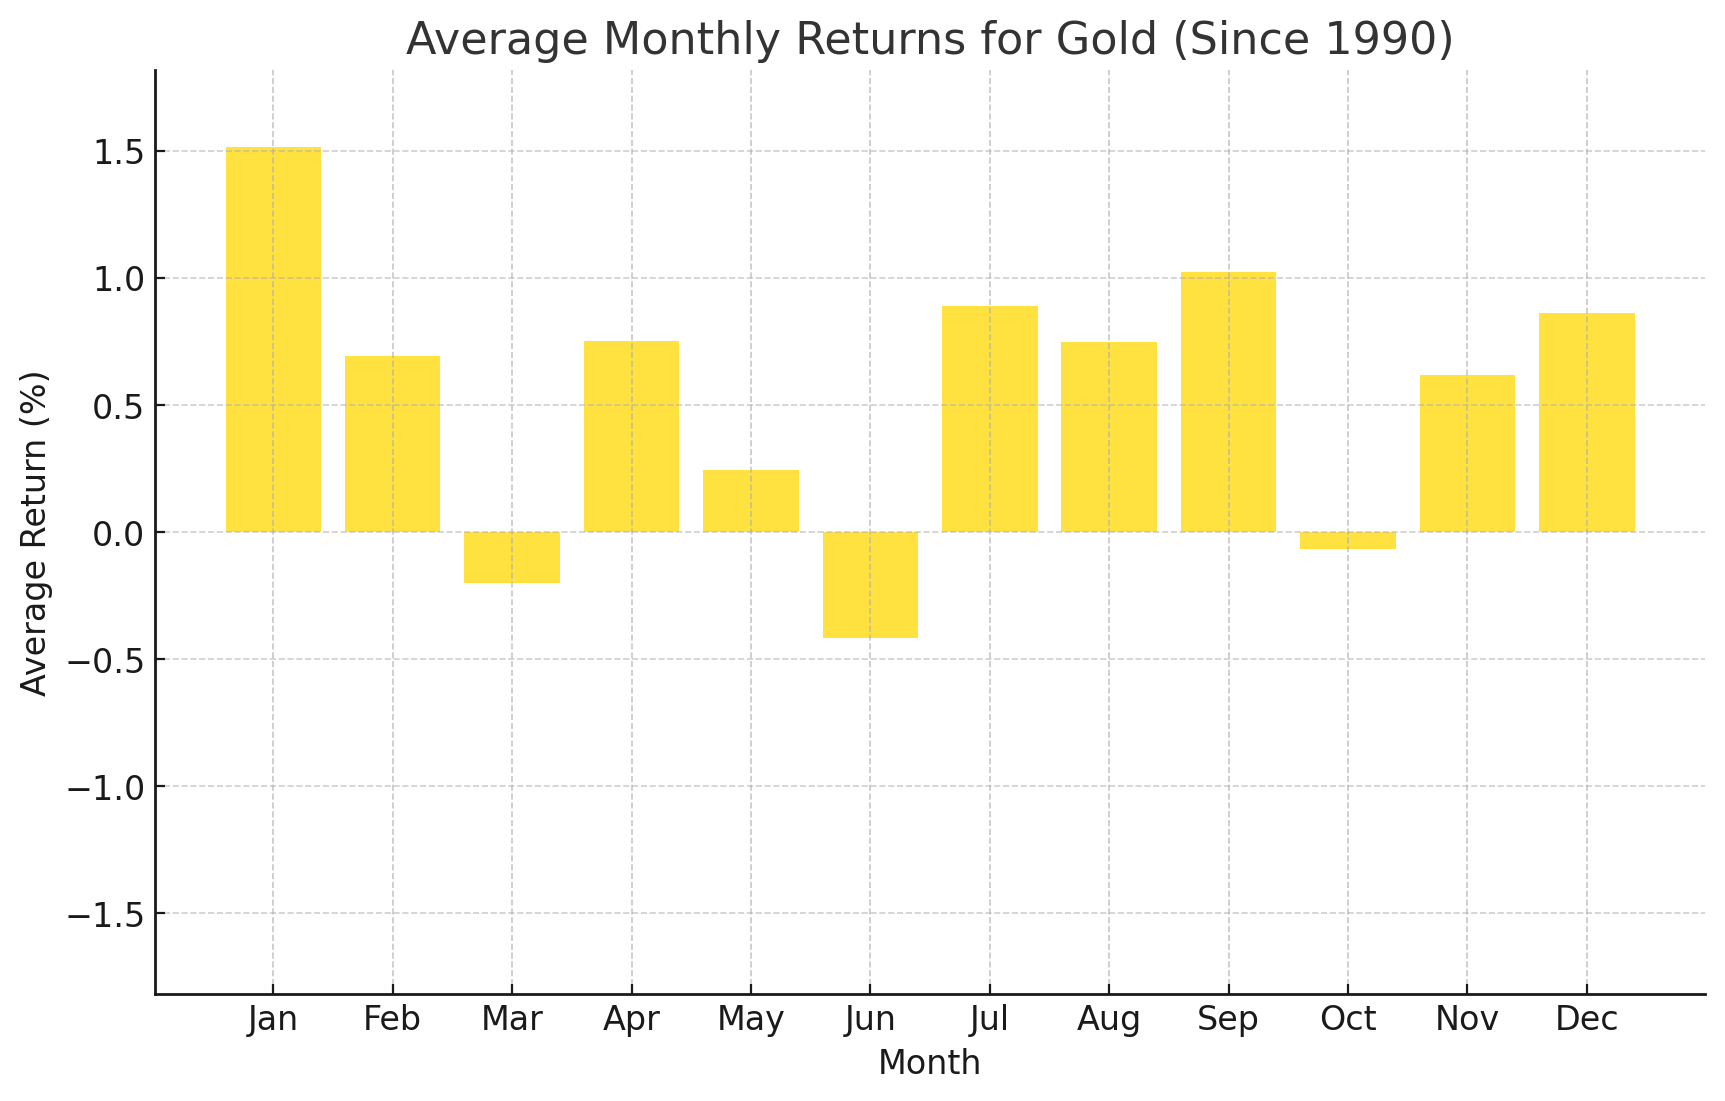
Chart Source: TradingView, StoneX. Please note that past performance is not necessarily indicative of future results.
Turning our attention to commodities, May has been a mediocre month for gold performance, with an average gain of 0.2% going back to 1990. The yellow metal once again reached record highs last month, topping out near $3500 before pulling back and consolidating in the lower-$3000s over the last week of the month. As we noted last month, gold appears well positioned to extend its historic rally amidst still-falling interest rates globally, trade uncertainty, and a well established uptrend going back to late 2022.
WTI Crude Oil Seasonality – WTI Chart
Source: TradingView, StoneX. Please note that past performance is not necessarily indicative of future results.
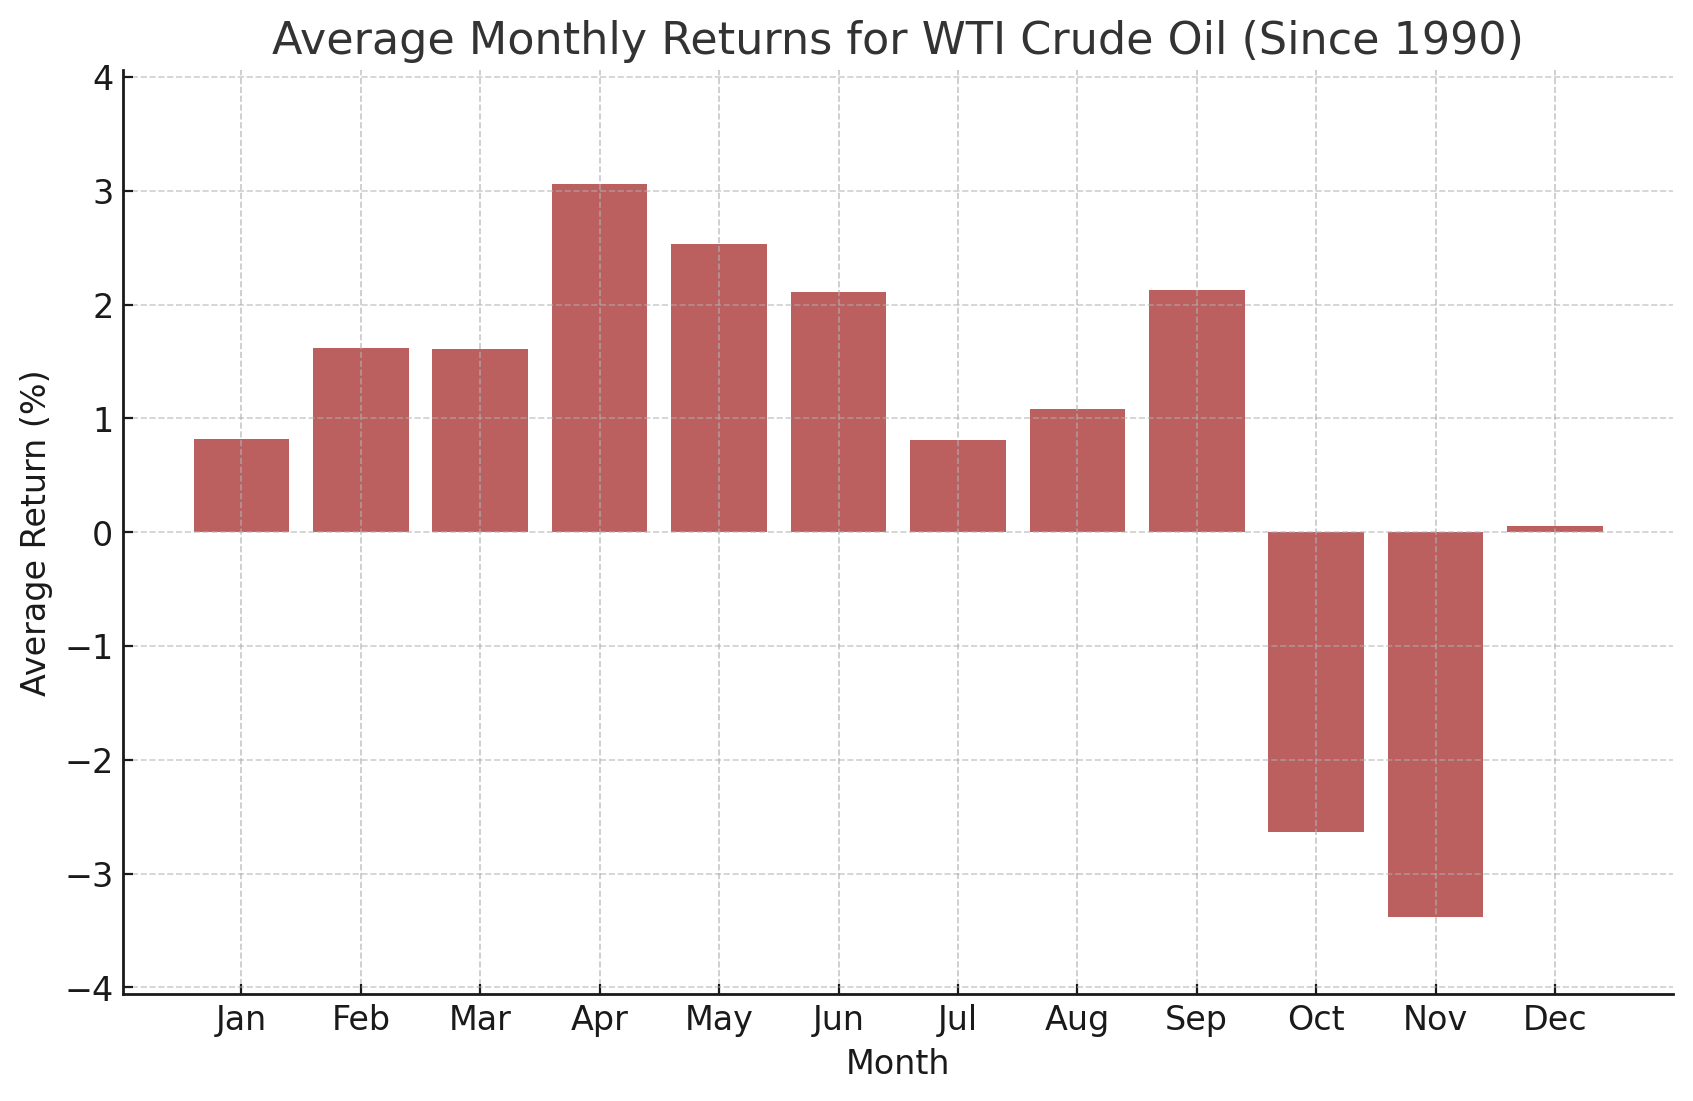
Last but not least, WTI Crude Oil has historically seen strong performance in May, with an average gain of +2.5% over the last 35 years. WTI bucked its seasonal trend in April this year, falling to multi-year lows amidst global recession fears and continued high production from OPEC and Saudi Arabia in particular, and those themes will likely be far more significant than the long-term seasonal trend again this month. As always, we want to close this article by reminding readers that seasonal tendencies are not gospel so it’s important to complement this analysis with an examination of the current fundamental and technical backdrops for the major markets and the global economy.
Follow the Global Macro Calendar
What are the major events and indicators on tap for the global economy that could charge volatility in markets and reshape deeper fundamental themes? Sign up for the updated Global Macro Calendar updated each week with a two week look ahead of the top events!
Sign Up
-- Written by: Matt Weller, Global Head of Research