Gold Price Forecast: Gold Stall at $3500 as Bitcoin Prints Another ATH
Gold Talking Points:
- It’s been a blistering bullish trend in gold for 15 months now as the metal has gained as much as 75% from the February 2024 low up to last month’s high
- The natural question now is whether the move is exhausted as there’s only been two red months in that span; and more recently bulls have shown fatigue at $3350 after the $3500 level marked the high point last month
Monthly bars can be informative. They may not seem very actionable as they’re so infrequent, printing only 12 times a year which could seemingly make them disconnected from shorter-term trends, but using just simple multiple time frame analysis can allow for a bigger picture look that could eventually carry impact into those more frequent chart time frames.
Take as an example the U.S. Dollar: As we came into 2025 the currency had just finished one of its strongest quarterly outings in years. With the Trump election and equity markets ripping, there was the U.S. exceptionalism trade that had made its mark known around-the-world.
But curiously, the USD posted a doji for the month of January, as did EUR/USD despite the widespread calls for parity in the major pair. And then February saw sellers start to swing a slightly stronger weight, and in EUR/USD, there was a second consecutive monthly doji.
By the time we got to March, USD bulls and EUR/USD bears were stalled enough that each market led into sizable profit taking moves, with the USD selling-off aggressively and EUR/USD starting to rally, which largely continued through April trade as the pair pushed up to a fresh three-year-high.
There’s some of this case in gold, as well. Gold spent three and a half years resisting around the $2,000/oz level. Interestingly, this lasted through a varied fundamental environment, as the ‘pedal to the floor’ FOMC policies in 2020 and 2021 led to the rate hike campaign of 2022.
Gold Weekly Chart
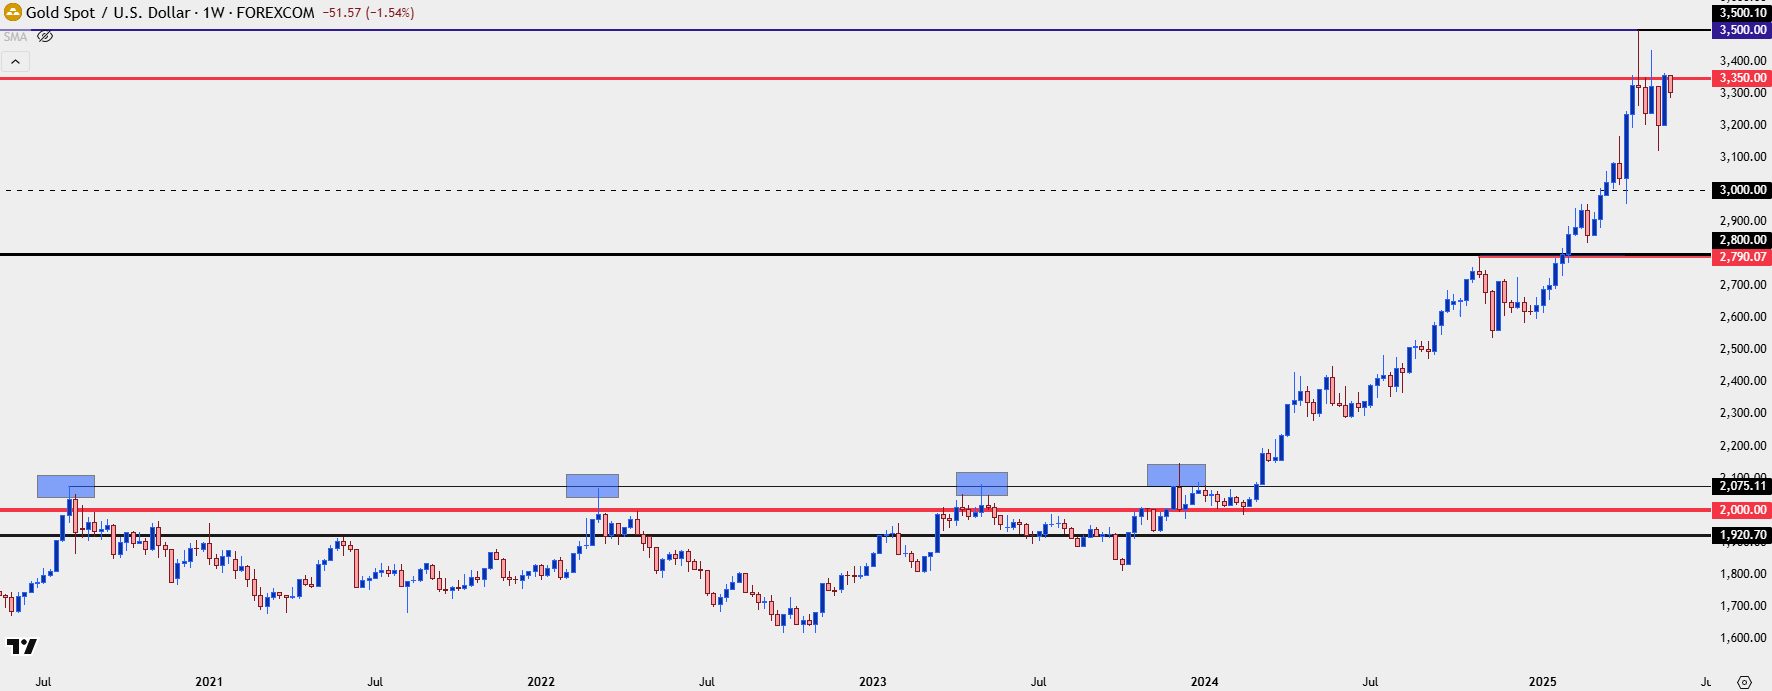
Chart prepared by James Stanley; data derived from Tradingview
Gold Breakout After CPI, February 2024
What ultimately led to the lasting breakout above $2k/oz was the FOMC push towards lower rates last year. Even as inflation remained elevated, the Fed continued to talk up rate cuts and it’s perhaps no coincidence that the two days that gold traded below $2k last year was on February 13th and 14th, on the heels of a higher-than-expected CPI report. Initially, that brought question to the Fed’s rate hike plans but when that was shrugged off by Chicago Fed President Austan Goolsbee, gold went vertical, and never really stopped as the rally continued into October of that year before finally calming for a bit. The exact quote was, “Let’s not get amped up on one month of CPI that was higher than it was expected to be.”
It wasn’t just one month as that data point had printed above expectations the prior month, as well, and for three of the previous five months. But, seemingly shrugging off this data point illustrated the Fed’s intent and that was to moderate policy. Lower rates with high inflation mean lower real rates, and for gold investors, that’s a bullish driver as the opportunity cost of capital is lessened.
Gold Daily Chart

Chart prepared by James Stanley; data derived from Tradingview
Gold: The Fundamental Argument
Since that breakout started back in February of 2024 there have only been two red months for the metal, both of which appeared after the U.S. Presidential election last year. But even that had some formality as the price action took on the shape of a symmetrical triangle, which when combined with the prior bullish trend made for a bull pennant formation. And that then rallied in a very big way as we came into 2025, filling in the formation beautifully.
At this stage, several technical indicators suggest overbought conditions. But that’s not all too different than what had showed last year. Which then begs the question as to the ‘why’ behind the move.
Simply, higher rates draw capital away from non-interest bearing investments. We can see this in the 21% sell-off that took over in gold from March of 2022 into October of that year as the Fed finally hiked rates to address inflation. But perhaps more to the point are real rates, as rates being eroded by even higher inflation makes for a less attractive alternative; and, instead, can drive capital into gold or other non-fiat instruments as markets prepare for bigger picture capital dilution.
As the Fed talked up rate cuts even with inflation remaining elevated above their target early last year, this spoke to the capital dilution aspect of the matter and made the premise of investing in interest bearing investments less attractive, as lower rates could further feed inflation. This sparked a historical move in gold that technically hasn’t pared back yet. But, given that pullback that showed in Q4, there may be a competitor of note that could potentially spark a pullback scenario in the metal.
Gold Daily Chart
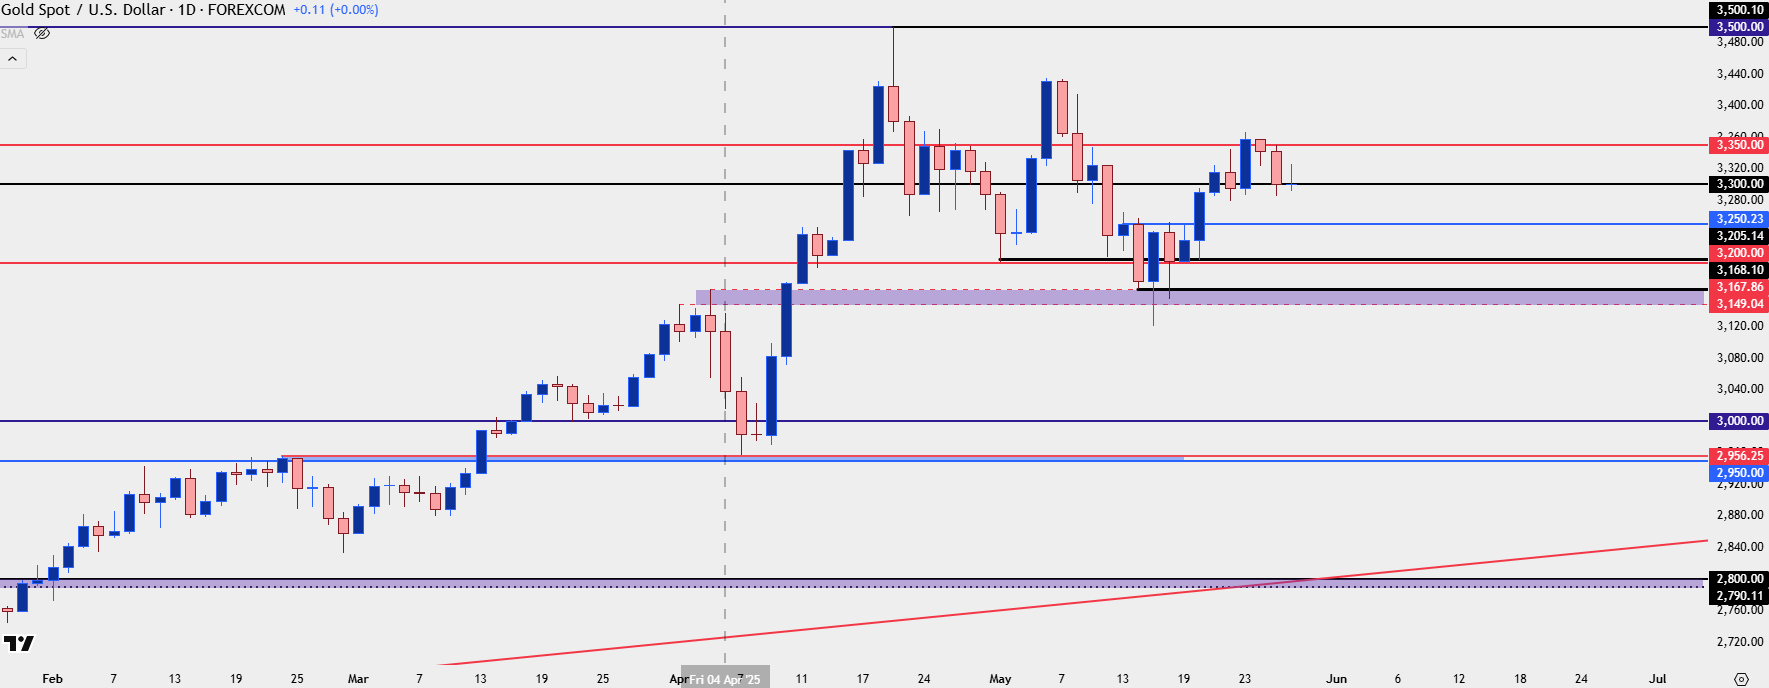
Chart prepared by James Stanley; data derived from Tradingview
Gold v/s Bitcoin
Interestingly, as gold stalled at $2k/oz back in the summer of 2020, Bitcoin started to come back to life. Initially in August of 2020 BTC was struggling to get back above $12k. But as the range in gold built so did the breakout in Bitcoin, until eventually the cryptocurrency was trading above the $60k figure.
As the Fed geared up to hike rates and, eventually started to tighten policy, Bitcoin fell all the way down to below $16K, once again illustrating how interest bearing investments can draw capital away from non-interest bearing investments during higher rate scenarios.
Similar to gold, Bitcoin began to rally more aggressively on February 14th of last year, around the time of that Austan Goolsbee comment. BTC broke out above the 50k level that day for the first time since bottoming, and then a month later had set a fresh all-time-high above the $73k level.
And then when gold did calm around the U.S. Presidential election, Bitcoin bulls took over again, driving another fresh all-time-high as the cryptocurrency finally mounted above the $100k level.
It seems as if there was a push into an alternative vehicle for anti-fiat capital flows, driven by the expectation that expanding US budget deficits will, inevitably, lead to more capital dilution of the USD. It’s not just the USD though, as there’s not much for austerity amongst developed economies around-the-world, with massive spending campaigns in China and Europe to go along with the United States.
Gold Weekly Chart (Red) with Bitcoin Overlaid (Blue)
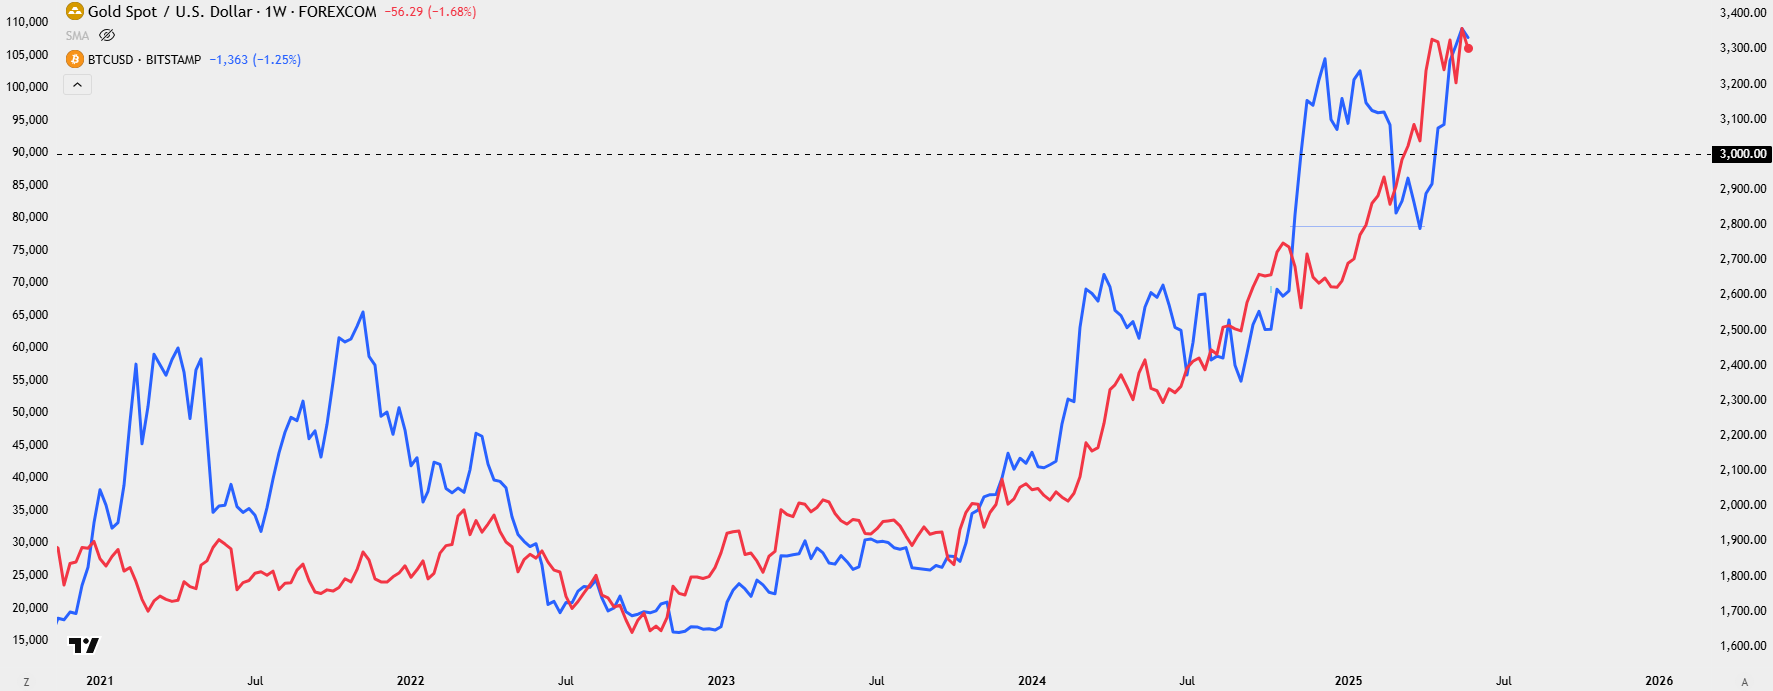
Chart prepared by James Stanley; data derived from Tradingview
But for gold investors and traders, a rally in Bitcoin, such as we saw in Q4, could present a bit of opportunity, as it could be reason for investors to divert flows away from gold near a major point of resistance at $3500/oz, and towards Bitcoin.
Or – if from a fundamental perspective, we see inflation cratering to the point that 5% 30-year Treasury rates are attractive, that could similarly prod a push of capital out of non-interest bearing vehicles, which, similarly, could create that pullback opportunity.
In gold, it’s the $2800 level that I think is attractive for pullbacks. This was a clear and well-defined point of resistance last year that, to date, hasn’t been tested as support. The $3k level could similarly suffice as it was the $2950 area that held the lows in April, although I would consider that support from a shorter-term perspective.
Gold Weekly Chart

Chart prepared by James Stanley; data derived from Tradingview
The Gold Monthly Chart
Back to the opening line of this article, monthly bars can be informative. And while there’s only been two red months over the past fifteen, we’re beginning to see an element of stall in gold that has not shown in some time, I would suggest since back when the $2k/oz level was still holding as resistance.
If gold does complete the month as a doji, which suggests indecision, the context of that indecisiveness after a massive 75% rally could illustrate pullback potential, and this is why I would look for some element of reaction at longer-term points of possible support, such as $2,800/oz, or perhaps even $3k.
With Bitcoin breaking out to fresh all-time-highs and the current administration showing such favor to cryptocurrencies, there could be a fundamental arguments for anti-fiat flows to be shifted away from gold in the near-term, and towards crypto, such as we saw after the election last year.
Gold Monthly Chart
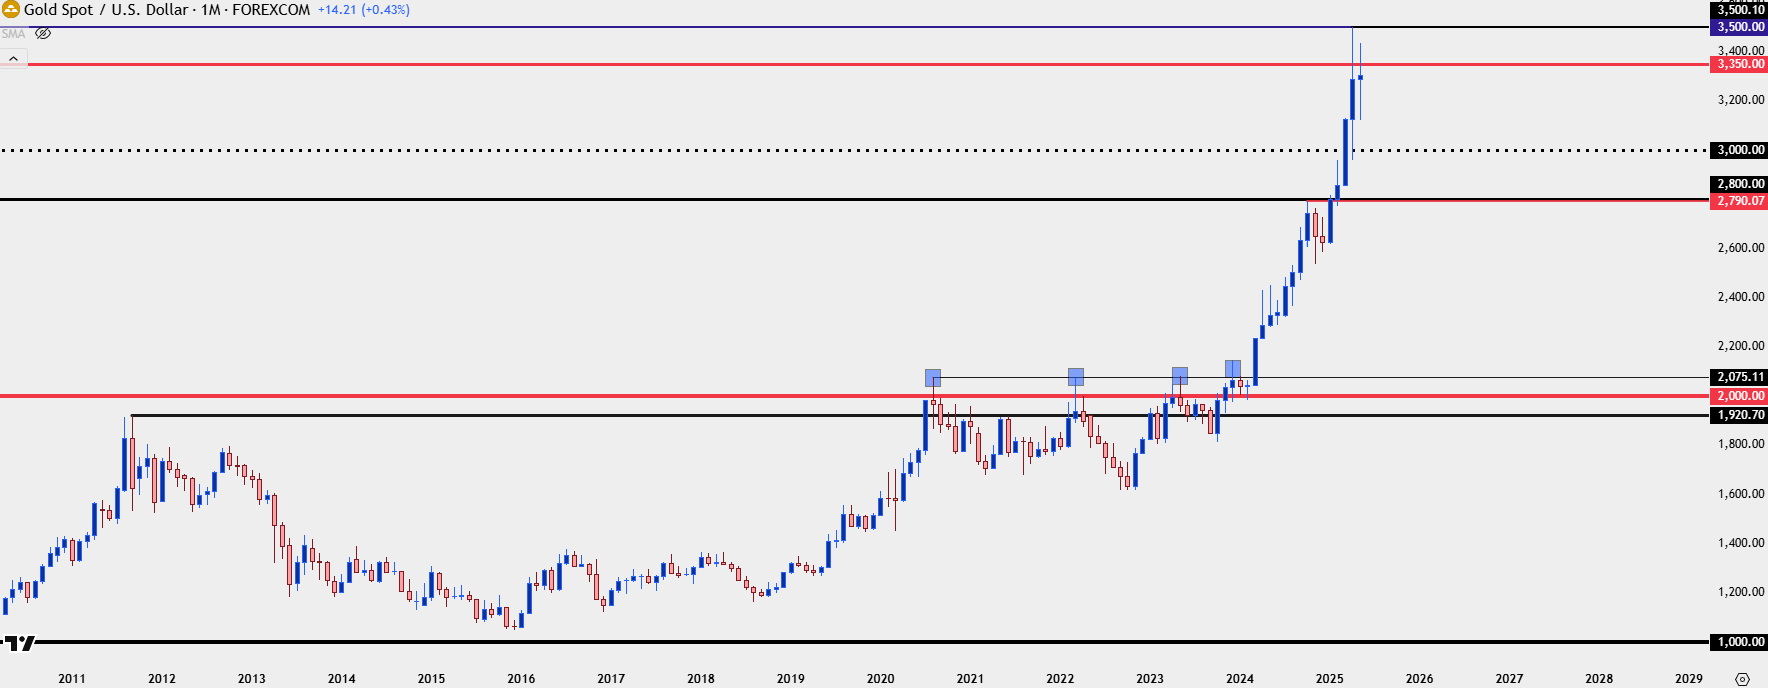
Chart prepared by James Stanley; data derived from Tradingview
Follow the Global Macro Calendar
What are the major events and indicators on tap for the global economy that could charge volatility in markets and reshape deeper fundamental themes? Sign up for the updated Global Macro Calendar updated each week with a two week look ahead of the top events!
Sign Up
---Written by: James Stanley, Senior Strategist