The perception of market sentiment heading into the new trading week can be very different depending on where you look. On the one hand, the Dow closed at a record highs and the S&P 500 posted its biggest rally in months on Friday. On other, volatility is picking up in frequency and intensity.
Talking Points:
Last week’s volatility was a notable pick up in ‘unwanted’ charge to a level not seen since November
While the Dow moved above 50,000 and Nasdaq 100 broke its congestion support, the big picture still does not register a clear and motivated trend
Event risk ahead skews towards the US with the retail sales and business confidence; a delayed NFPs and update to CPI arm of the dual mandate
Watch the Full Video
A Rebound to End the Week but Lingering Concern Over Volatility
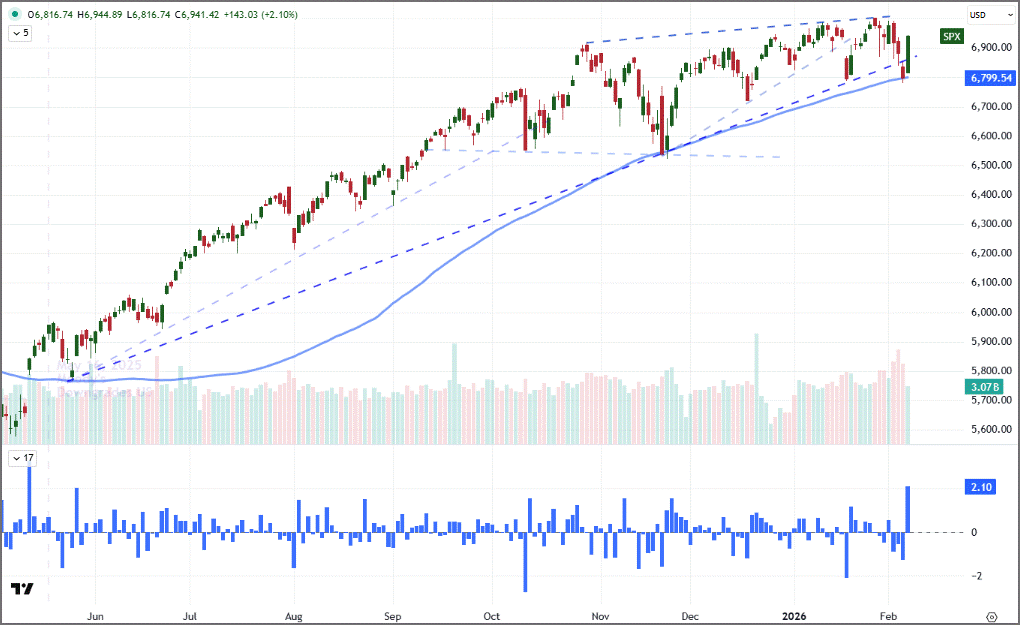
The global markets were a mixed bag this past week. US indices closed out the period with a strong rally that saw the Dow clear weeks of congestion to close at a record high above 50,000, while the S&P 500 mounted its biggest single-day rally in eight months. That said, this bid would not likely have arisen without the notable tumble that preceded the rebound with benchmarks like the S&P 500 and Nasdaq 100 first crashing below prominent support levels. So, through all this back and forth, what are we ultimately left with as far as a go-forward view of speculative conviction? The aforementioned indices present different technical standings. More broadly, if we look outside the popular bubble of US equities, the jolt of fear was far from universal. On the extreme bear side, we witnessed an extended tumble from crypto markets and even precious metals as they took on a speculative (rather than haven) bearing. Alternatively, global equities held up well via measures like the VEU ‘rest of world’ (non-US) ETF while emerging markets and yen-backed carry trades climbed.
Chart of S&P 500 with 100-Day Moving Average and 1-Day Rate of Change (Daily) Source: TradingView.com; Standard & Poor’s; John Kicklighter
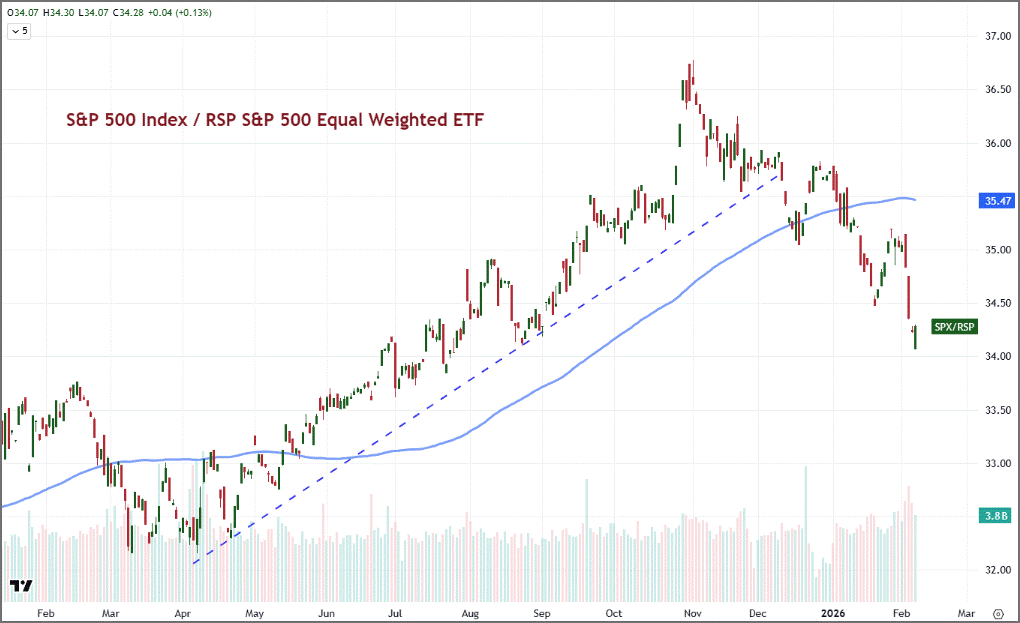
There are meaningful fundamental threats to risk aversion if speculative appetite were to untether from balloons of complacency and instead attach to the systemic anchors. A more finely tuned gauge for sentiment is the relative appetite for risk assets. In favorable conditions, market participants tend to prefer assets with the greatest absolute potential for capital gains – with a lesser consideration to yield income. Conversely, when those high beta benchmarks are retreating relative to their peers, it suggests that confidence may not be as robust as a singular measure may suggest. Consider the ratio of the Nasdaq 100 to the Dow Jones Industrial Average (tech-oriented mega cap stocks versus stoic blue chips) which dropped to an 8 month low or the S&P 500 relative to the RSP equal-weighted SPX component index which dropped to a 5-month low.
Chart of S&P 500 to RSP Equal Weighted S&P ETF Ratio (Daily) Source: TradingView.com; Standard & Poor’s; John Kicklighter
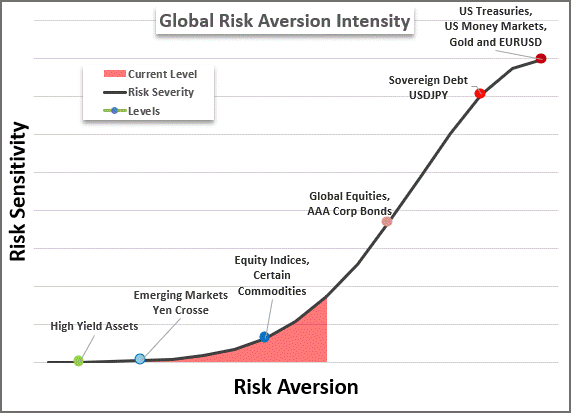
There is a transition away from the best performing – or alternatively, ‘most expensive’ – pace-setters even if there isn’t yet a universal unwind. Furthermore, there is a backdrop of increasingly frequent and larger scale periods of volatility. Concern of (and hedging against) unfavorable moves in long-only markets is the preceding step to a more sweeping move, though it does not always signal a market-wide unwind. Ultimately, the best measures of a true ‘risk off’ swale is a broad (as well as highly correlated) and ‘significant’ retreat in sentiment-oriented markets.
Chart of Risk Aversion Intensity Scale Source: John Kicklighter
A Calendar Skewed Towards the US and Without Clear Undercurrents
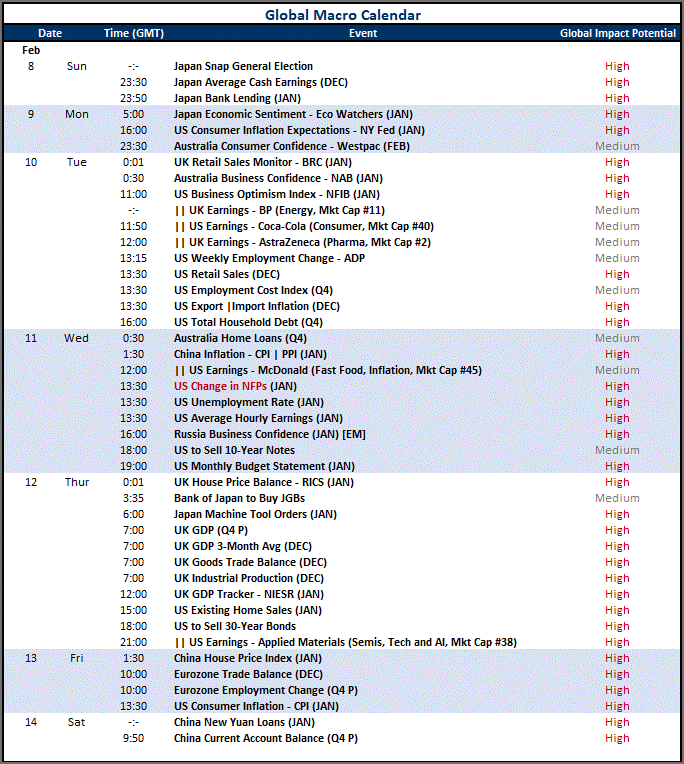
With sentiment unclear for both direction and momentum while the global macro calendar dials back the top listings, it is important to adjust our expectations around the potential for event risk. While it is always possible that a release happens to hit when risk appetite is charged or the surprise is so substantial that it can override the market’s engrained inertia, those are low probability circumstances.
As such, it is more likely that the top listings on tap will see most of their influence through regional and naturally higher volatility assets. Outside of the run of high visibility indicators scheduled for release on the US economic docket and listings from the earnings calendar, there is little top shelf event risk that won’t be overridden by mitigating circumstances – Japan’s Eco Watchers and lending by the snap election, UK GDP by political headlines and China’s data by long-standing doubt over its accuracy.
Calendar of Top Global Macro Event Risk Source: John Kicklighter
What is the Lynchpin in the US Economic Engine?
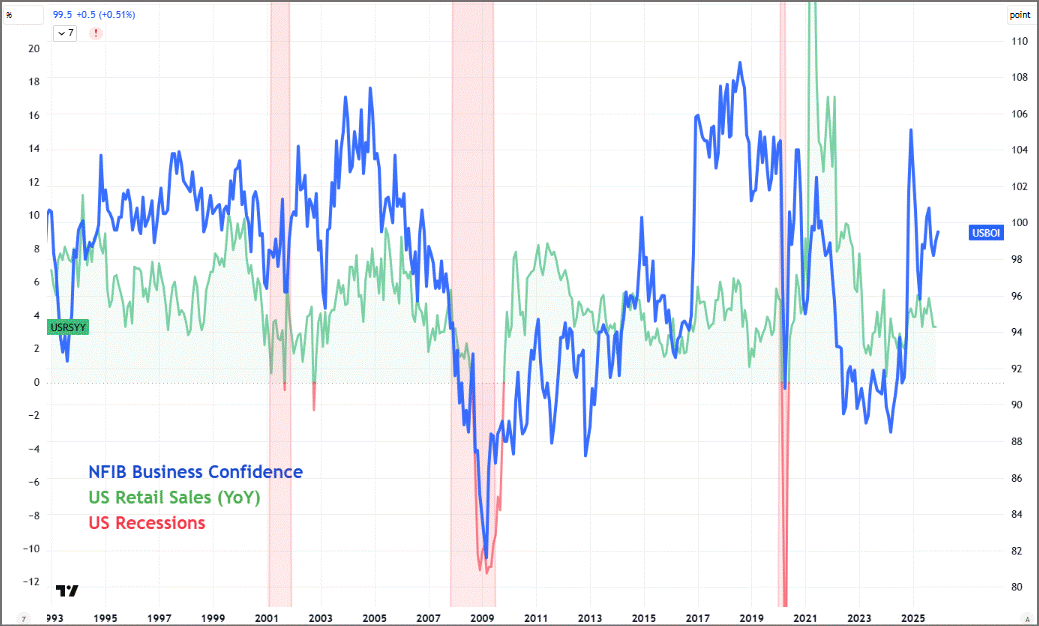
The first round of event risk with meaningful potential comes Tuesday. Setting aside the run of earnings on the day (BP, Coca Cola, AstraZeneca, Ford) considering the Mag 7 failed to establish market-wide guidance, the combination of US small business confidence and consumer spending will provide an important, timely and upstream read on the world’s largest economy. The NFIB’s Small Business Optimism Index will update on the health of the largest source of US employment and arguably the most sensitive node to tariff-influenced raw material costs, interest rates, tax rates and volatile consumer demand.
The reading has held well above its five-year average (94.8) with last month’s reading at 99.5. This is in stark contrast to consumer confidence via both the University of Michigan and Conference Board measure. Which is leading and lagging? Which the true measure of economic health moving forward? Consumer spending figures is likely the lynchpin in this cycle, but retail sales has not collapsed, though the surge in credit through the month of December raises reasonable concern.
Chart of US NFIB Small Business Confidence, US Retail Sales and US Recessions (Monthly) Source: TradingView.com; NFIB; US Census Bureau; John Kicklighter
A Delayed NFPs and More Data to Consider
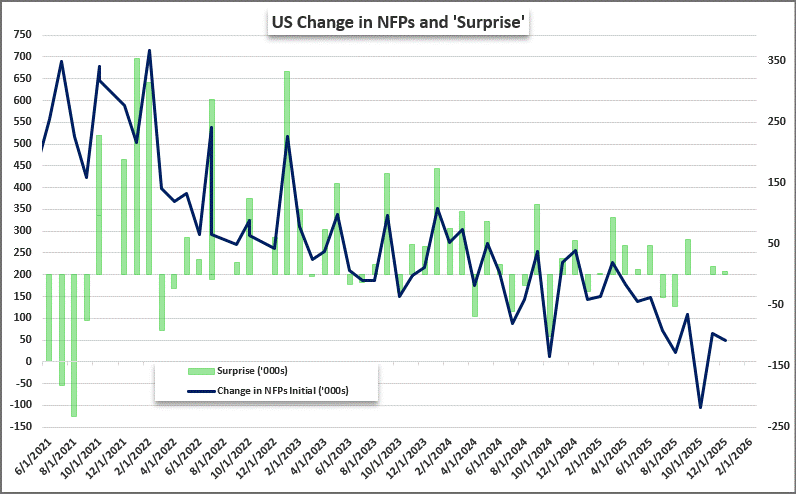
If you missed it last week, the Bureau of Labor Statistics did not release their January labor report due to the short-lived, partial shutdown of the federal government (again). The revised release date was set to Wednesday at the standard 13:30 GMT release time. While the general circumstances haven’t changed much from what we had to consider heading into the original release time, there has been some external labor data this past week that can add some context to expectations (the economist consensus is for a 40K net addition in payrolls).
The ADP private payroll report fell short of forecasts (22K added versus 35K expected), the ISM service sector employment component weakened unexpectedly (51.7 to 50.3), Challenger reported the largest number of January job cuts since 2009 (108.4K) and job openings in the JOLTs report fell to (6.54 million) the lowest level since September 2020. This does not bode well for the US labor market.
Chart of Change in NFPs and Surprises (Monthly) Source: John Kicklighter; Bureau of Labor Statistics
Inflation and the President Will Add Key Pressure to Rate Forecasts
Depending on whether NFPs amplifies the concern around the trajectory of a weakening labor market or temporarily curbs its, there will be a material impact on how much influence the Friday consumer price index (CPI) report for December has on markets like the US indices and Dollar. Debate around the Federal Reserve has eased recently following the January hold on rates by the FOMC and President Trump’s announcing his support for Kevin Warsh as the next Chairman of the central bank - taking over for Jerome Powell in May. Naturally, the President made provocative statements to the effect that he expects Warsh to cut rates when he takes office, but the markets have not meaningful increased forecasts for cuts in 2026.
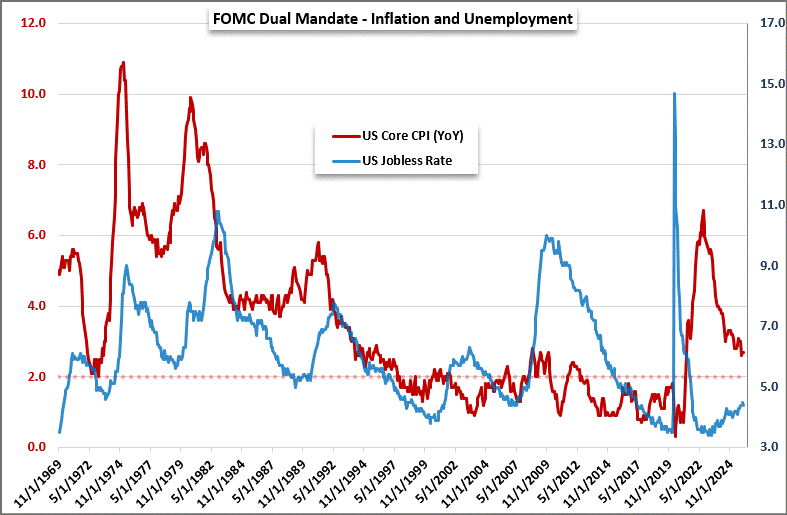
Many believe Warsh will be data dependent as well, which means that the balance of the dual mandate (moderate inflation and full natural employment) will still take precedence. While the average job additions have slowed over time, the jobless rate is still very low on a historical basis. Meanwhile, inflation is still elevated above the 2 percent stated inflation target. Headline and core annual CPI rates are expected to slow – 0.1 ppt to 2.5 percent and 0.3 ppt to 2.4 percent respectively – which would raise the potential of more and faster cuts.
Chart of Fed Dual Mandate - US Jobless Rate and Core CPI (Monthly) Source: John Kicklighter; Bureau of Labor Statistics
Access More Global Macro Insights, Forecasts and Tools
Stay connected to timely global macro analysis designed to help market participants navigate shifting economic conditions and evolving risk. Gain access to regular market commentary, updated quarterly forecasts, a comprehensive two-week forward economic event calendar, and specialized tools built to support informed trading and risk management decisions.
The subsidiaries of StoneX Group Inc. provide financial products and services, including, but not limited to, physical commodities, securities, clearing, global payments, risk management, asset management, foreign exchange, and exchange-traded and over-the-counter derivatives. These financial products and services are offered in accordance with the applicable laws in the jurisdictions in which they are provided and are subject to specific terms, conditions, and restrictions contained in the terms of business applicable to each such offering. Not all products and services are available in all countries. The products and services offered by the StoneX
Group of companies involve risk of loss and may not be suitable for all investors. Full Disclaimer.
This content is not intended for residents of any particular country, and the information herein is not advice nor a recommendation to trade nor does it constitute an offer or solicitation to buy or sell any financial product or service, by any person or entity in any jurisdiction or country where such distribution or use would be contrary to local law or regulation. Please refer to the Regulatory Disclosure section for entity-specific disclosures.
No part of this material may be copied, photocopied or duplicated in any form by any means or redistributed without the prior written consent of StoneX Group Inc. The information herein is provided for informational purposes only. This information is provided on an ‘as-is’ basis and may contain statements and opinions of the StoneX Group of companies as well as excerpts and/or information from public sources and third parties and no warranty, whether express or implied, is given as to its completeness or accuracy. Each company within the StoneX Group of companies (on its own behalf and on behalf of its directors, employees and agents) disclaims any and all liability as well as any third-party claim that may arise from the accuracy and/or completeness of the information detailed herein, as well as the use of or reliance on this information by the recipient, any member of its group or any third party.
Currencies
The subsidiaries of StoneX Group Inc. provide financial products and services, including, but not limited to, physical commodities, securities, clearing, global payments, risk management, asset management, foreign exchange, and exchange-traded and over-the-counter derivatives. These financial products and services are offered in accordance with the applicable laws in the jurisdictions in which they are provided and are subject to specific terms, conditions, and restrictions contained in the terms of business applicable to each such offering. Not all products and services are available in all countries. The products and services offered by the StoneX Group of companies involve risk of loss and may not be suitable for all investors. Full Disclaimer. This content is not intended for residents of any particular country, and the information herein is not advice nor a recommendation to trade nor does it constitute an offer or solicitation to buy or sell any financial product or service, by any person or entity in any jurisdiction or country where such distribution or use would be contrary to local law or regulation. Please refer to the Regulatory Disclosure section for entity-specific disclosures. No part of this material may be copied, photocopied or duplicated in any form by any means or redistributed without the prior written consent of StoneX Group Inc. The information herein is provided for informational purposes only. This information is provided on an ‘as-is’ basis and may contain statements and opinions of the StoneX Group of companies as well as excerpts and/or information from public sources and third parties and no warranty, whether express or implied, is given as to its completeness or accuracy. Each company within the StoneX Group of companies (on its own behalf and on behalf of its directors, employees and agents) disclaims any and all liability as well as any third-party claim that may arise from the accuracy and/or completeness of the information detailed herein, as well as the use of or reliance on this information by the recipient, any member of its group or any third party.
Our market expertise, advanced platforms, global reach, culture of full transparency and commitment to our clients’ success all set us apart in the financial marketplace.
Reach
With access to 40+ derivatives exchanges, 180+ foreign exchange markets, nearly every global securities marketplace and numerous bi-lateral liquidity venues, StoneX’s digital network and deep relationships can take clients anywhere they want to go.
Transparency
As a publicly traded company meeting the highest standards of regulatory compliance in the markets we serve; our financials and record of accomplishment are matters of public record. StoneX’s commitment to “doing the right thing over the easy thing” sets us apart in the industry and helps us build respect, client trust and new partnerships.
Expertise
From our proprietary Market Intelligence platform, to “boots on the ground” expertise from award-winning traders and professionals, we connect our clients directly to actionable insights they can use to make more informed decisions and achieve their goals in the global markets.