

The intention of the below graphs are not to use to say "my price should be X based on this graph". These prices are derived from an FOB price point average. The intent is to show major global price movement trends. Your values will likely have significant basis difference (similar to your local grain price being different than the traded market price).
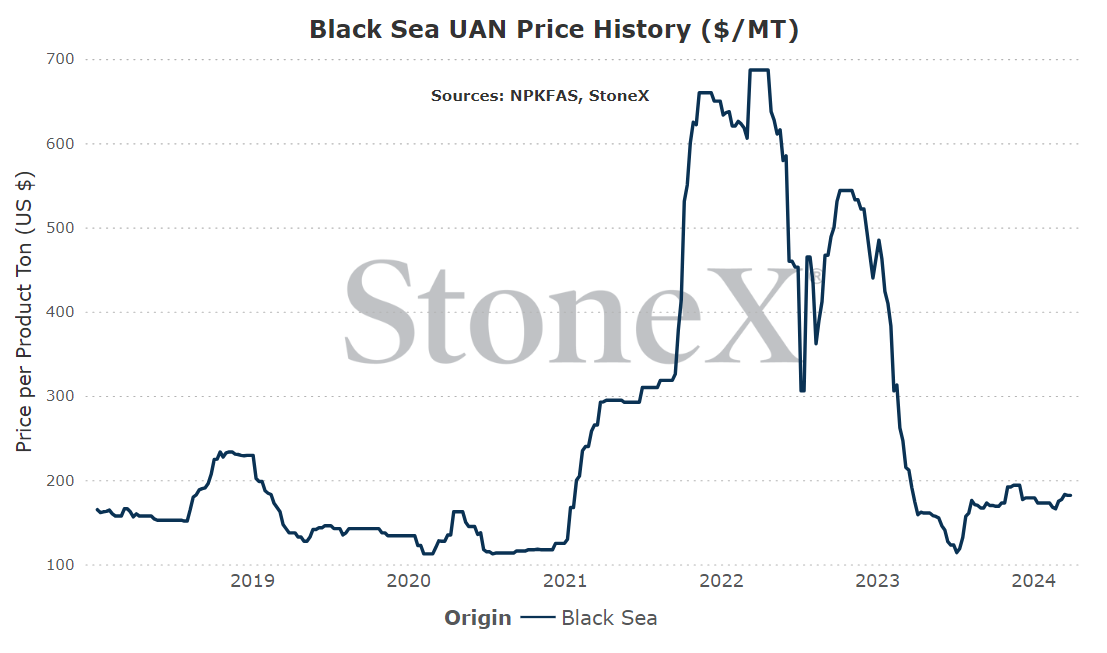
This graph is labeled as MT in USD currency.
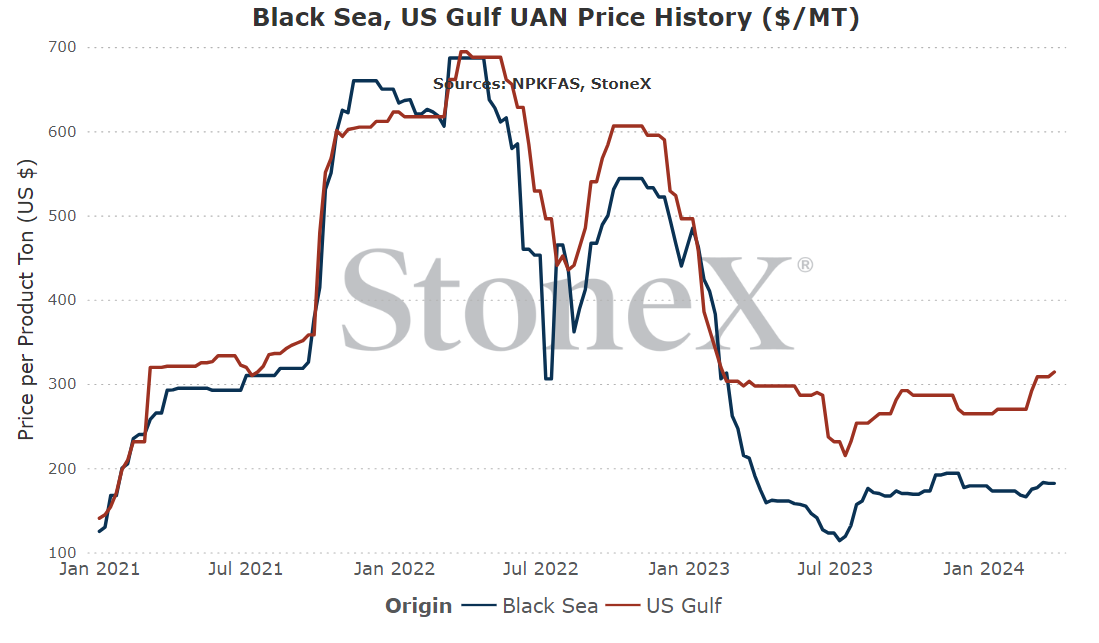
A lot of the UAN demand is right in front of the market, but it is hard to ignore what is happening in the urea sector.
Tough call this month but I think by the time I write the May newsletter, we will see UAN price flat and then bearish.
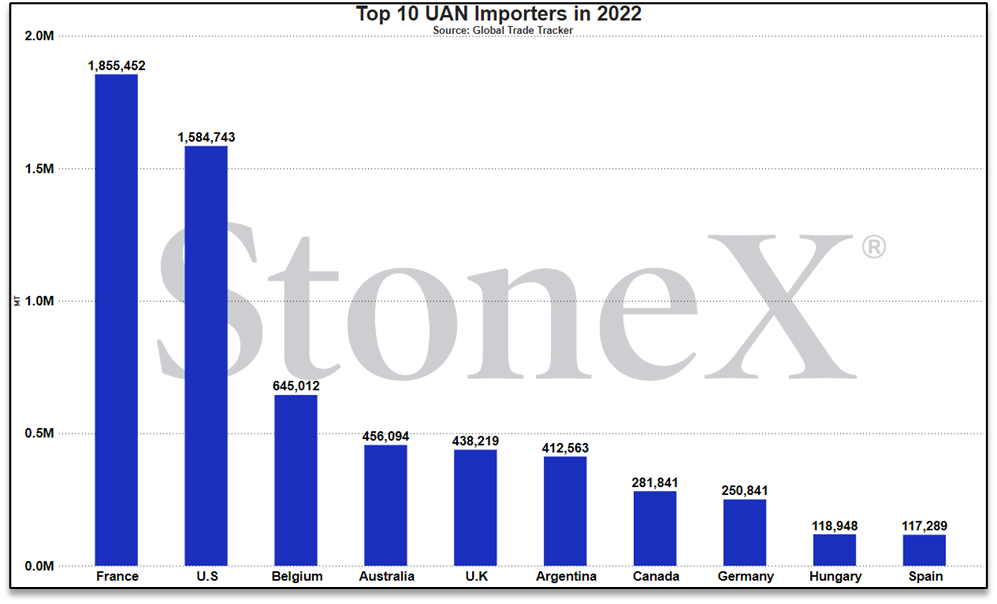
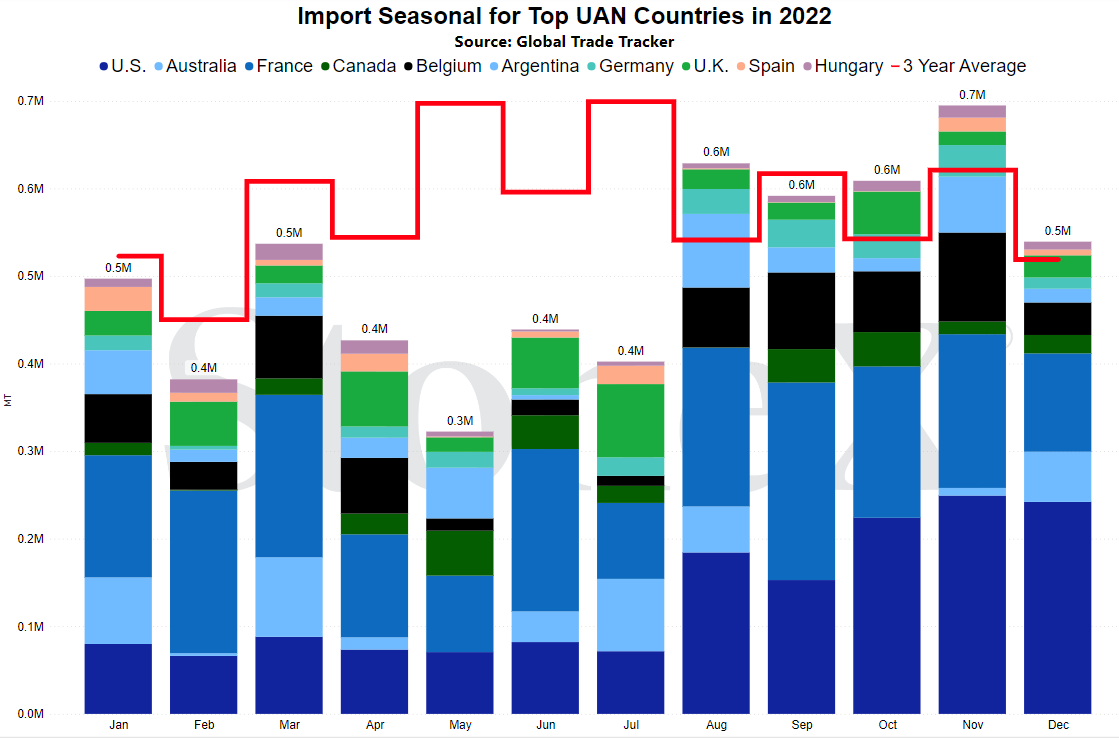
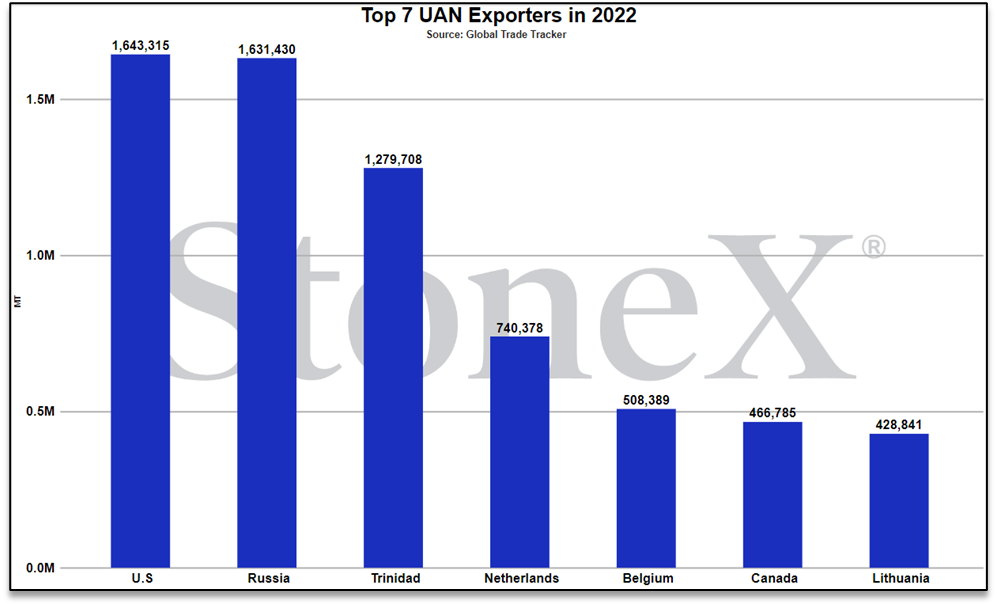
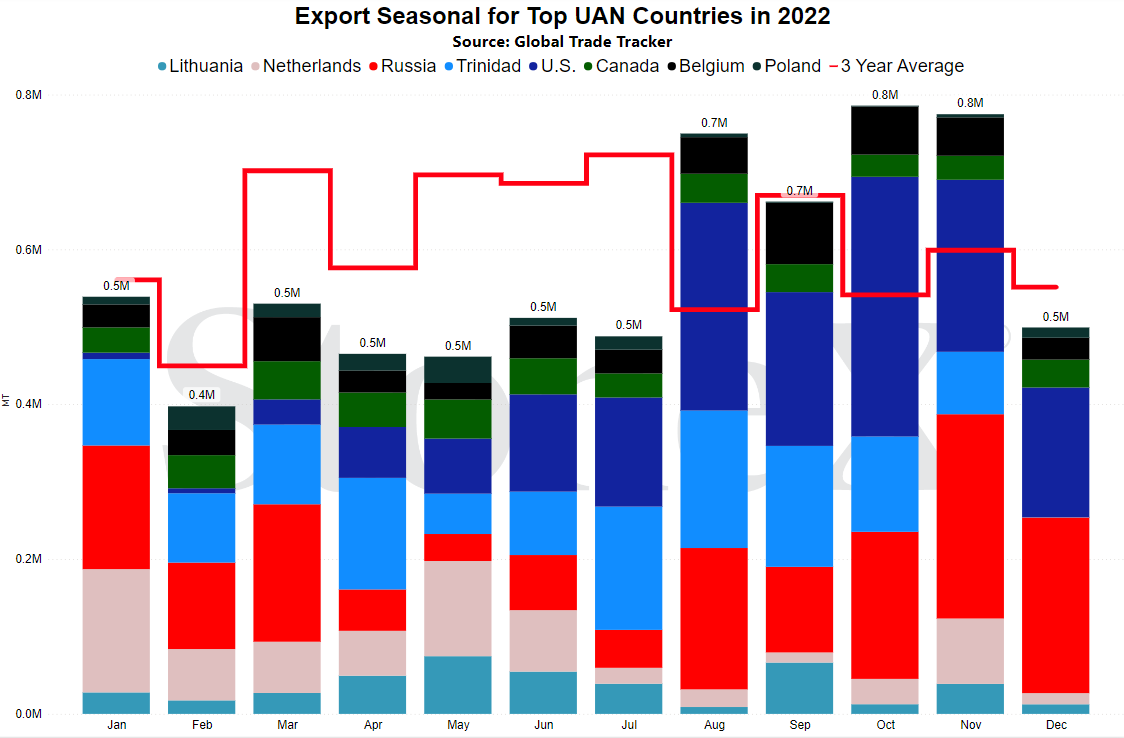
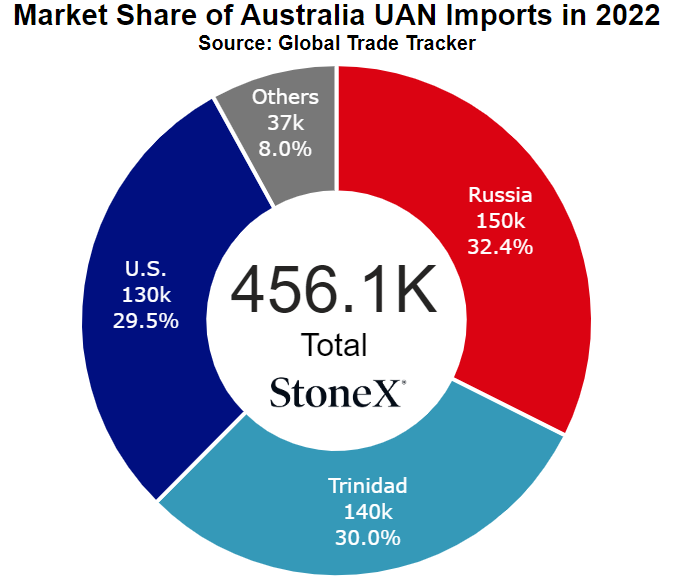
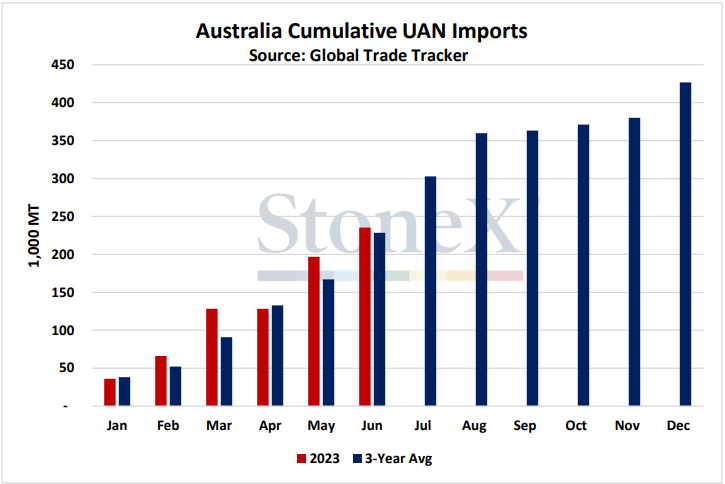
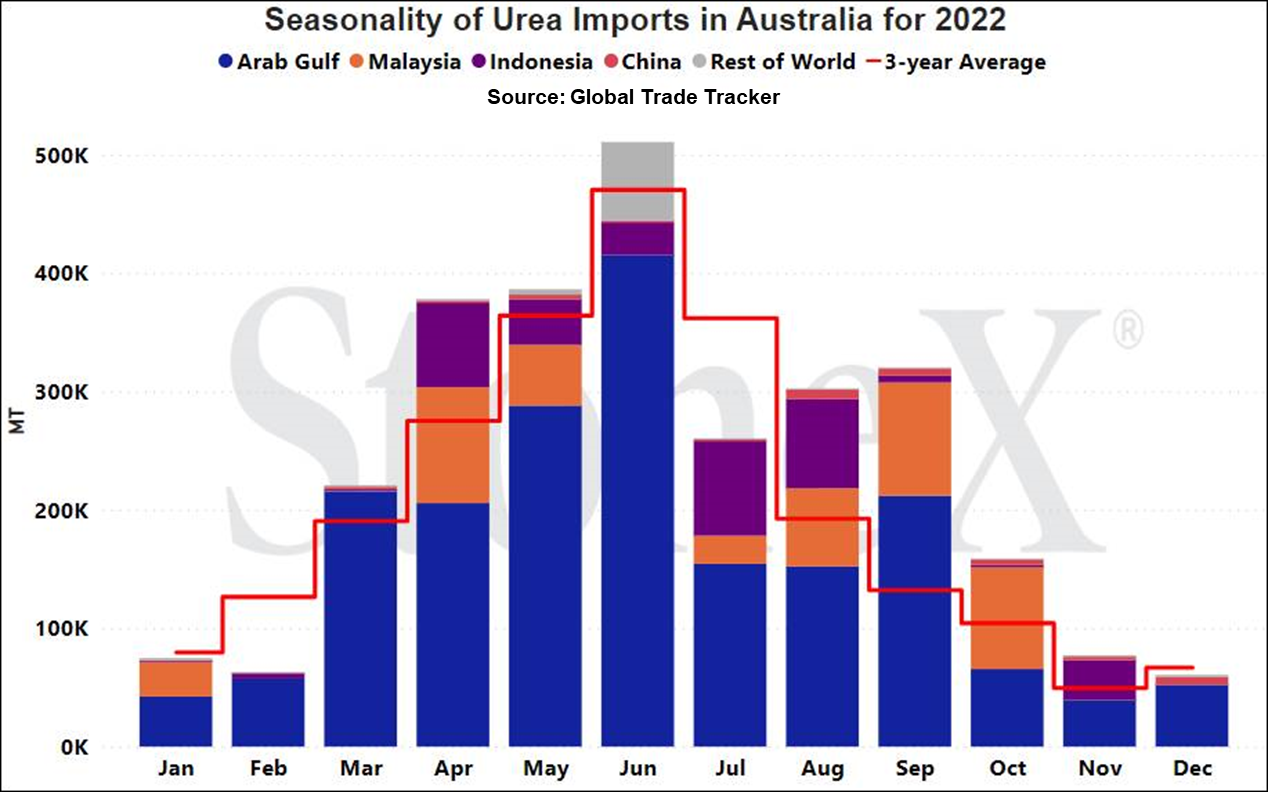
North American values jump on tight inventories
This was discussed in the outlook piece above, but there have been several reasons that inventories are already tight for North America, and spring has barely begun:
- Started the fertilizer year low on inventories - last spring, we went into application season thinking corn acres would be 92M. That number eventually jumped a couple million and helped to drain the UAN market. We started fertilizer year 2024 (FY 24) very empty. There were a lot of tanks to fill...
- Imports/exports didn't gain us much - for the most part, every ton that was imported ended up being exported. Normally, we could gain inventories from imports outpacing the export flow but not this year...
- Production issues were bigger than we thought - unfortunately, this is part of the process. There were plants that went down due to normal production issues (expected). There were plants that stayed down longer than expected due to complications (unexpected). Some producers reported wider outages due to the arctic blast this winter (really not expected). We were going to be tight on inventories anyways...unfortunately, this only compounded the issues.
The result is that we have barely begun spring application season for UAN...and we are already hearing inventory issues. If it is this tight already, please have conversations with your retailer sooner than later. Hopefully they have product already ready for you but if they do not, they will have more time to start sourcing.
Why does this matter to Aussie farmers?
When the bulk of your UAN supply comes from the U.S., what happens there happens here. As long as North America is struggling thru its inventory situation, values should hold. If inventories are tight and values hold/push higher, why would they export product halfway around the world at a discount?
Maybe other origins can start to be sources during this time of stress but I need to see it before I believe it.
NOLA/New Orleans, Louisiana
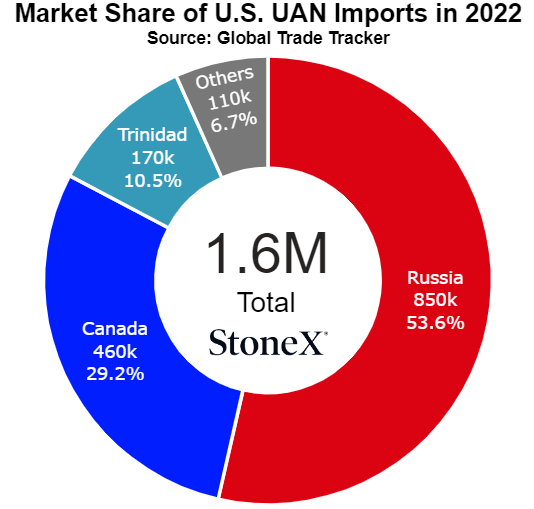
Number 2 global importer in 2022
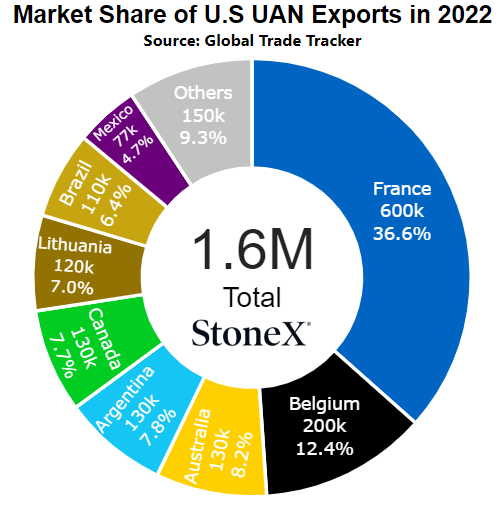
Number 1 global exporter in 2022
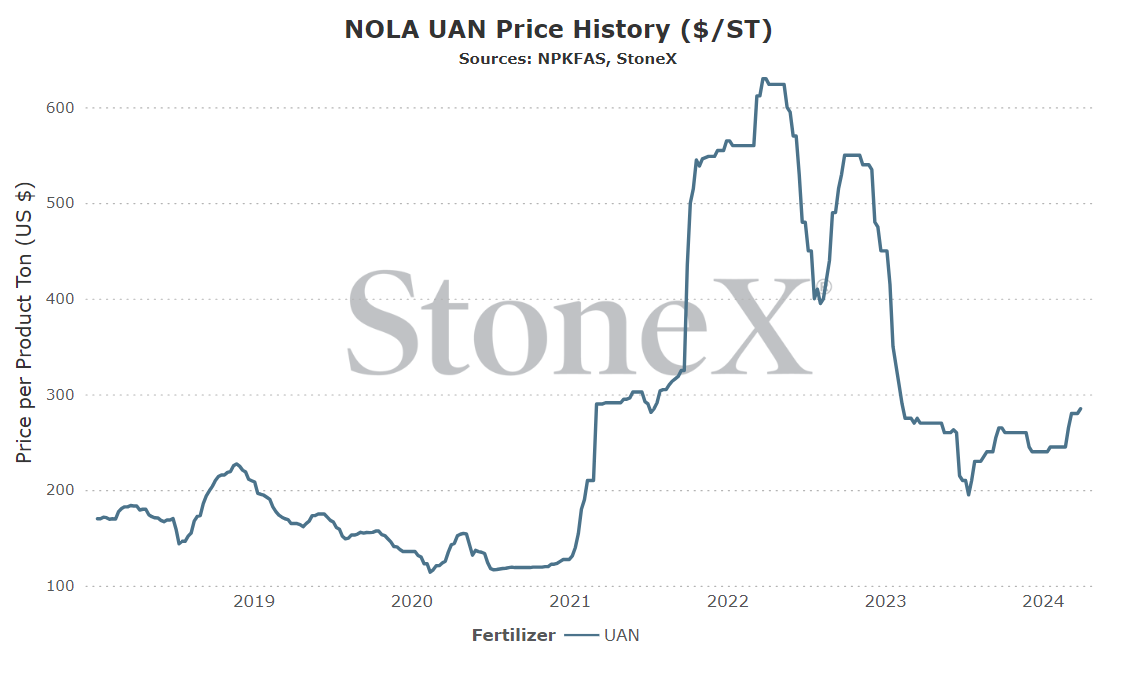
Price comparisons
Vs 30 days ago - +8% or approximately $20 higher
Vs 90 days ago - +19% or approximately $45 higher
Vs 6 months ago - +8% or approximately $20 higher
Vs 1 year ago - +6% or approximately $15 higher
Black Sea (Russia)
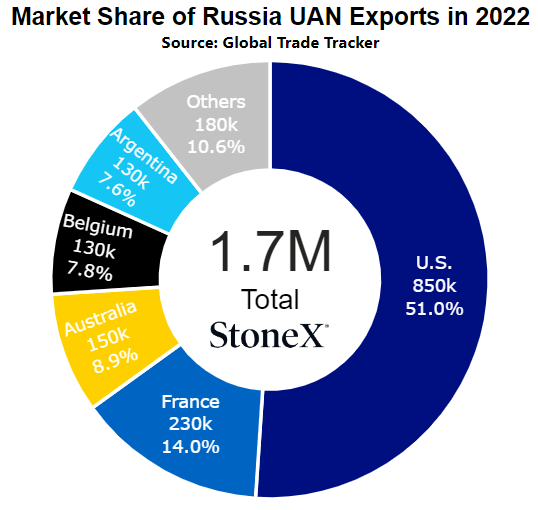
Number 2 global exporter in 2022
Price comparisons:
Vs 30 days ago - +4% or approximately $7 higher
Vs 90 days ago - +2% or approximately $4 higher
Vs 6 months ago - +7% or approximately $13 higher
Vs 1 year ago - +5% or approximately $8 higher
- Tight N.A. inventories – things are already snug in parts of the U.S./N.A. in terms of UAN supplies...and spring has barely begun. Hopefully we will see the market get ahead of demand from a supply POV, but that is VERY hard to do at this point on the calendar. If inventories remain tight, you know what manufacturers/suppliers will do...
- Lack of origin options - the U.S./N.A. region is struggling thru tight inventories and spring is nowhere near done. Russia remains shut off from Australia due to government policies. The list of options gets really narrow past that point...
- Urea prices are falling – while UAN should be a premium priced N, especially with the inventories issues at hand, the market will not want to get too out of sync with urea or risk losing last minute demand. If urea continues to fall, UAN could move with it.
- U.S. corn acre estimates dropped on last USDA report – last week's acreage report by the USDA was a surprise, with corn acres falling to 90M (we had been using 92.1M and then 91.5M recently). That is a large chunk of N demand that just dissipated...if it is truly gone. If this number holds, it is a large amount of nitrogen demand that has dissipated and may leave manufacturers/suppliers scrambling for alternative destinations...like Australia.
We believe that only looking at the flat price of either grains or fertilizer can be misleading:
-
Only selling grain can hurt you if fertilizer prices rise substantially
-
Only buying fertilizer can hurt you if grain prices fall
We look at the ratio "value" to get a better indication of where we are or how many bushels of X does it take to pay for 1 ton of fertilizer.
Would you rather:
-
Spend 100 bushels to pay for 1 ton of UAN
-
Spend 60 bushels to pay for 1 ton of UAN
When we compare the current ratio value against recent years, we start to see if we are high or low.
YOUR VALUES MAY LOOK DIFFERENT
This graph looks at the NOLA UAN price vs the flat grain price. There are no logistics on either product. Your location will look different due to fertilizer logistical costs, grain basis, etc.
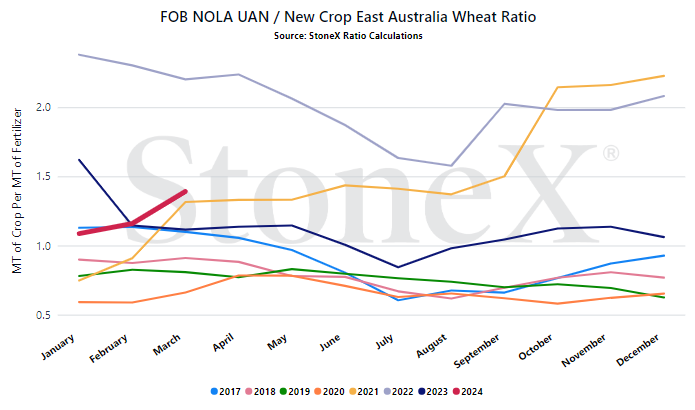
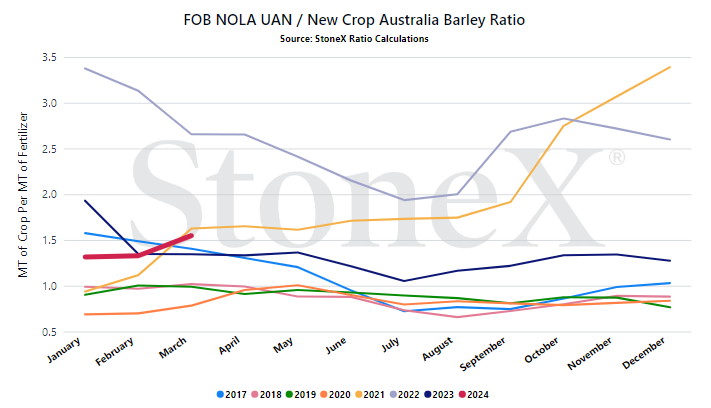
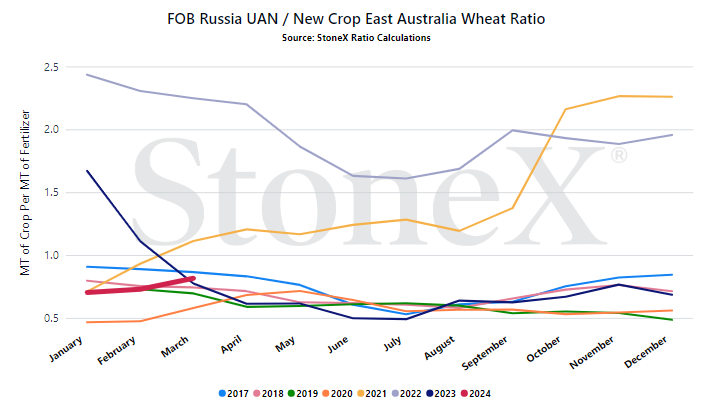
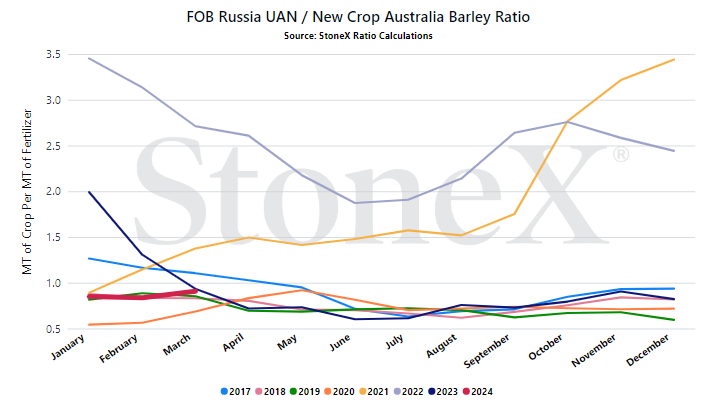
- Global nitrogen price directions vs tight N.A. inventories - globally, urea values have been under decent price pressure since the India tender was announced. That should mean that the whole of the nitrogen complex should get cheaper...but that isn't the case for UAN which continues to hold due to tight inventories. This is even more true for N.A. who is so tight on inventories and has so much demand in front of it that it is getting difficult to find product. It largely does not matter if other values are falling. If there is not enough locally, it doesn't matter.
- Continued lack of sources with Russia largely blocked - Australia is out of options for where to source product. It used to be able to leverage Russian producers against U.S. producers. Now, the Aussie government has blocked Russia. Aussie farmers know that. Aussie importers know that. Guess who else knows that...U.S. manufacturers. However, if this blockage were to change...
StoneX Ratio Calculation
The ratio calculation is derived from Bloomberg historical grains values as well as fertilizer values from StoneX, NPKFAS, and Argus.
The calculation is simply dividing the fertilizer price by each grain price.
All data was sourced from StoneX unless otherwise noted.




