

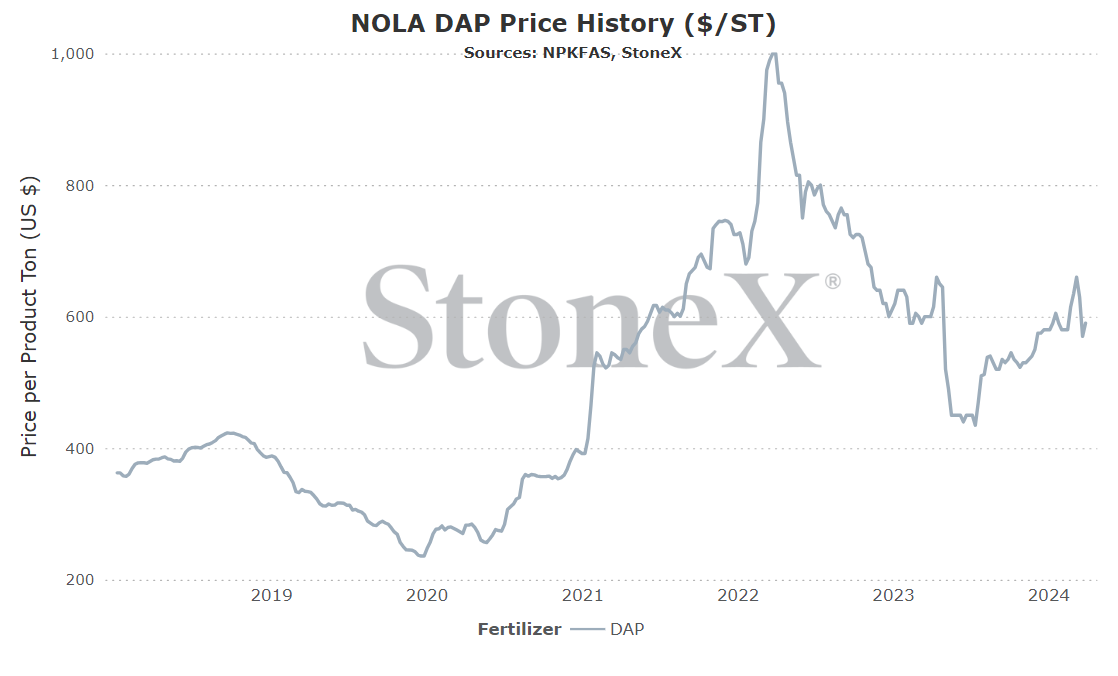
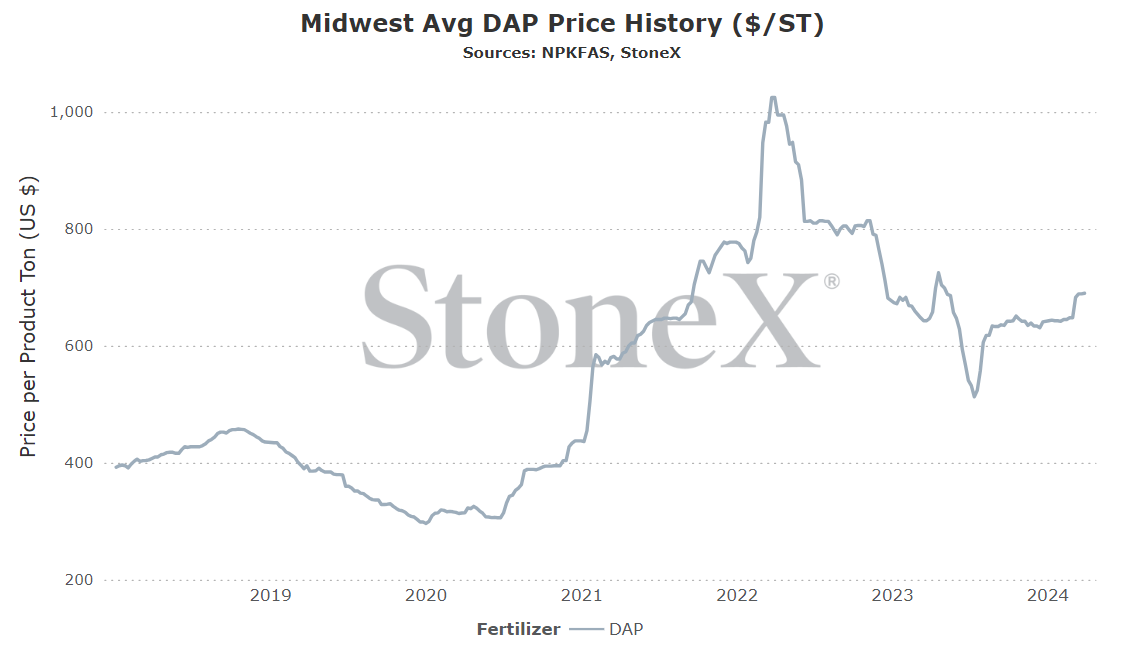
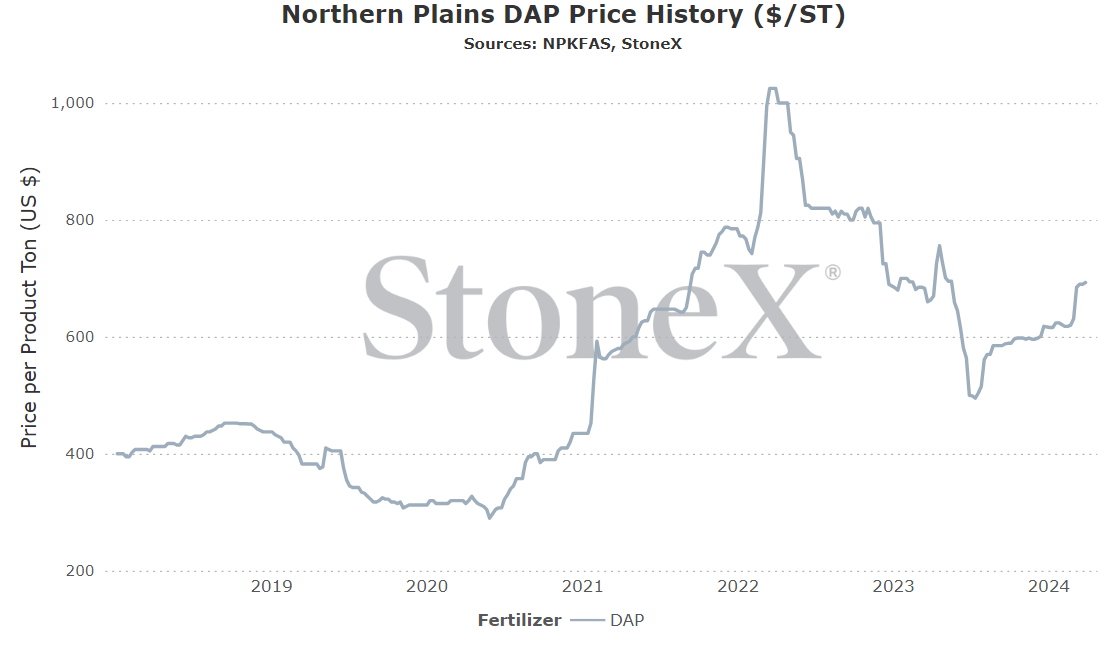
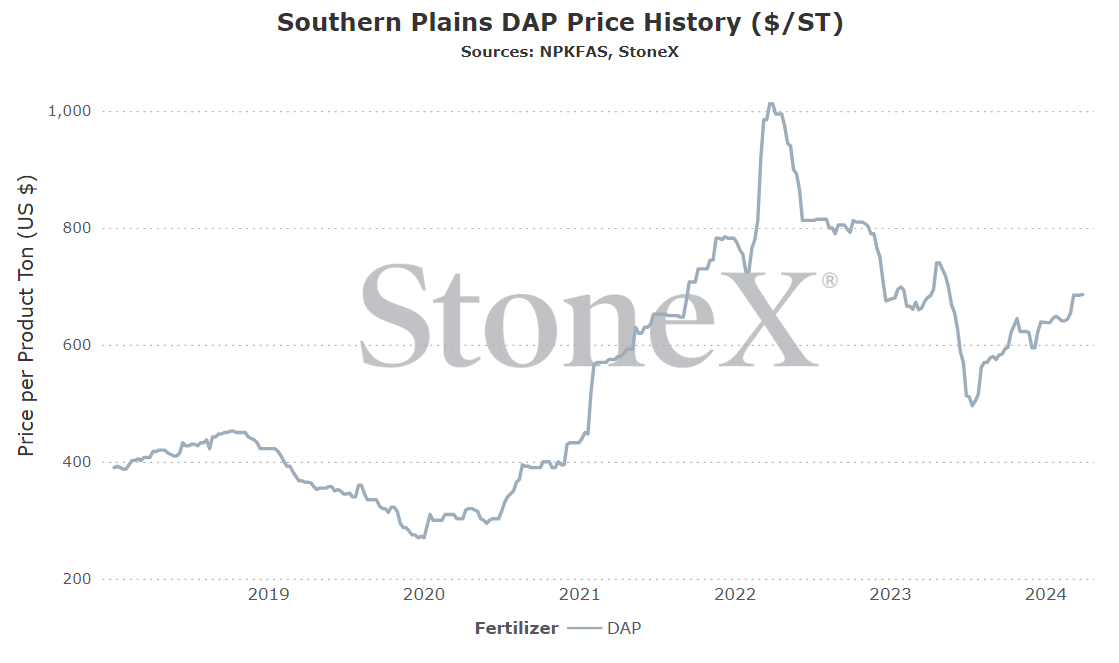
I will say this now and will say it going forward to eternity: these are the flat price graphs for each individual location. Your price where you are is going to be different. There are logistics. There is the cost of storage/interest/insurance/etc. These graphs should not be taken as "it shows the price at $700, why isn't my price $700". These graphs should be used to give an appreciation for price movements.
All values are in metric tons and USD currency.
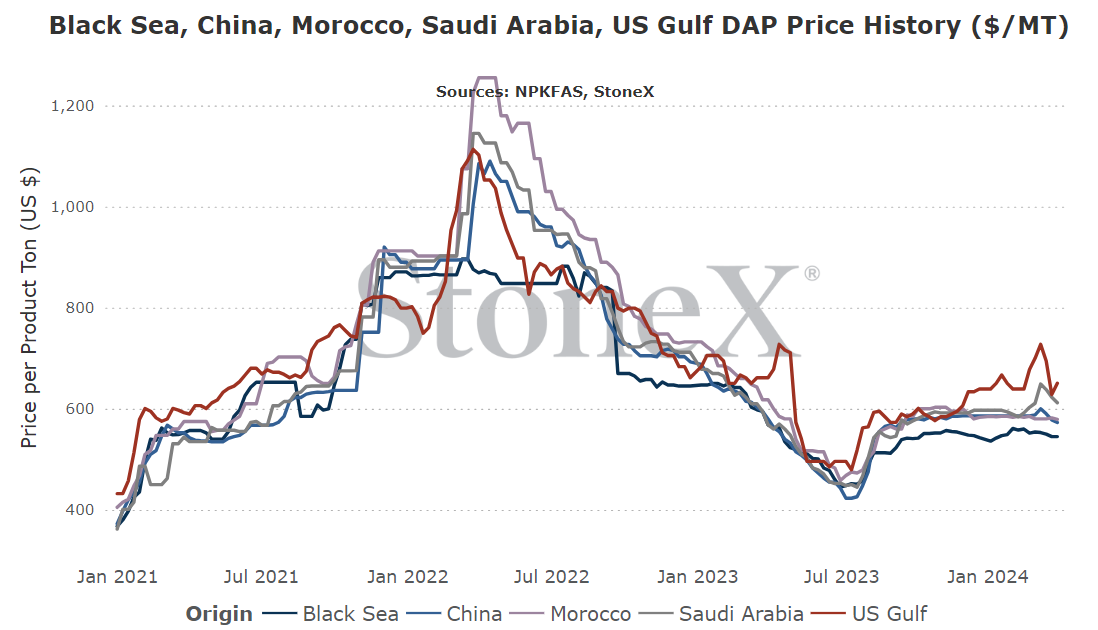
Global
Summer demand lull is coming. Appears that Chinese exports are set to return early May. Global grain prices should not have buyers in a rush to step forward.
Lot of signs are pointing to phosphate prices starting/continuing to fall.
North America
It is April which means it is that magical time of year when farmers slow down their thinking on phosphate applications and turn their minds and tractors to planting!
Yes, there are still pockets of demand out there and those pockets should continue to see tight inventories. That means that values should remain supported until resupplies arrive. However, the NOLA/global complex appears to have turned a corner.
Inland N.A. values should remain high as just in time logistics and low in place inventories keep up the support, the reset is starting to take shape with NOLA values appearing to continue to be soft for the coming weeks/months.
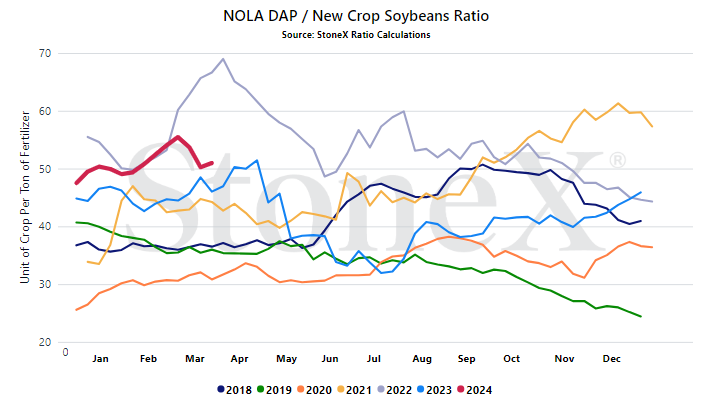
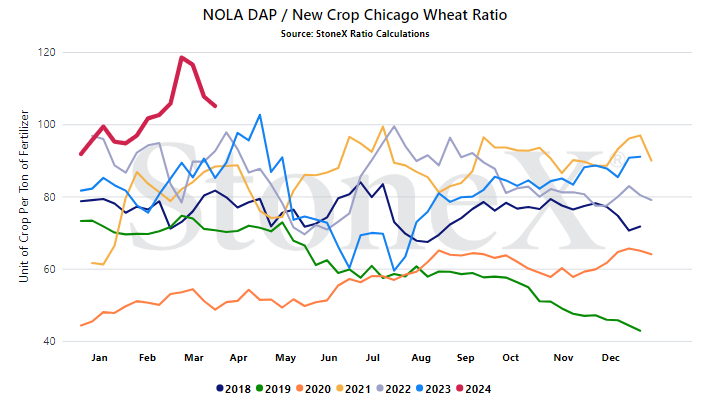
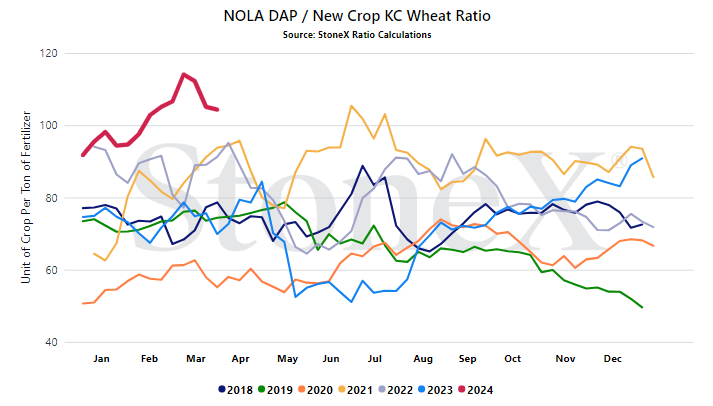
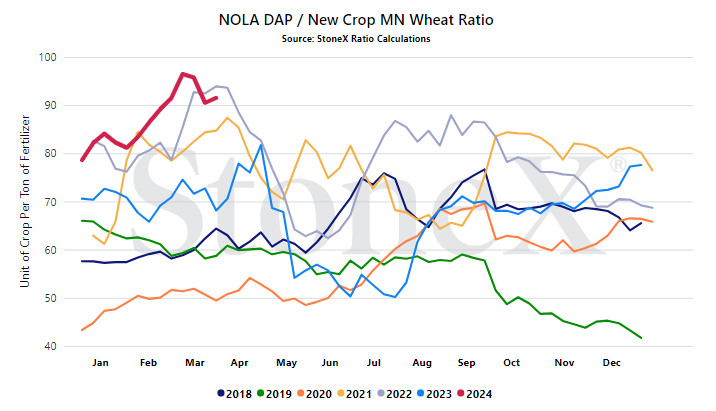
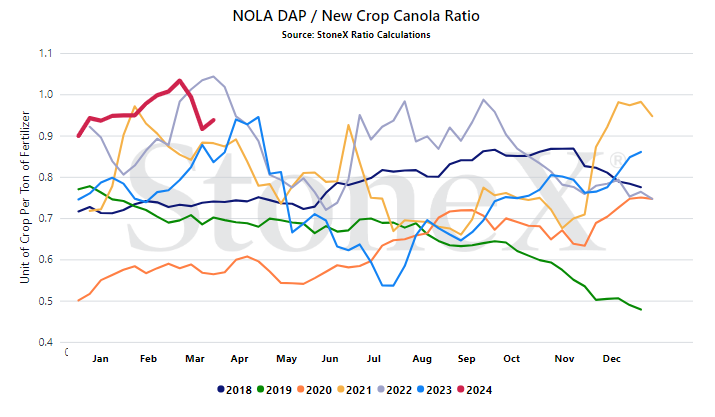
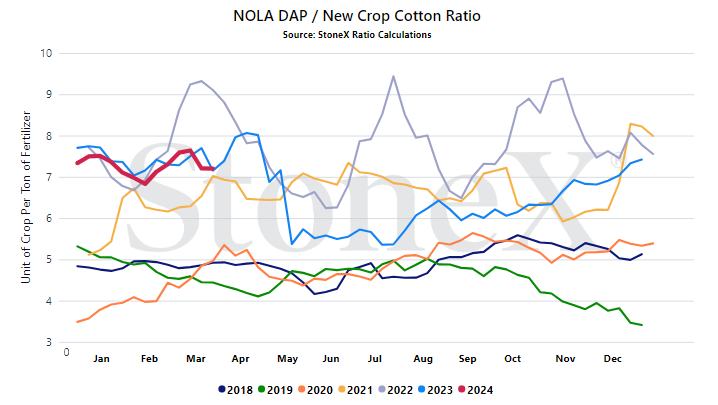
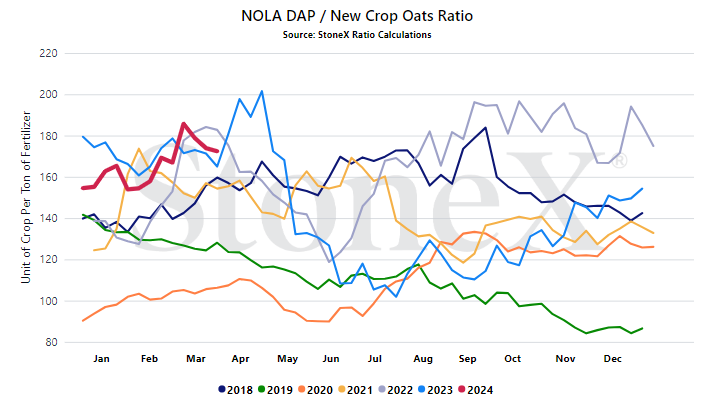
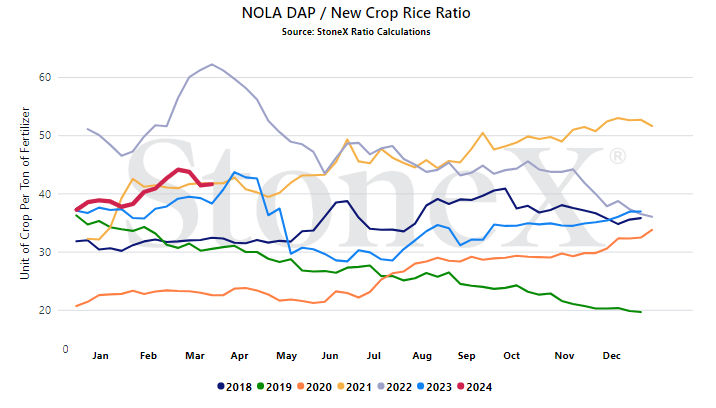
The interesting part to watch will be how manufacturers/suppliers approach summer fills. We expect low ending inventories which means plenty of holes to fill. However, it does not feel as though buyers will be in a rush to step forward unless there is a significant change in the market. Taking a look at the ratio charts below, seems like there is more work to be done by the supply side than the demand side.
While the fertilizer futures market is far from as liquid as its grain counterparts, it is still active and gives us an insight into what the market is thinking.
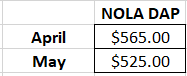
Please note that the values below can and will change daily. This is merely a look at where they are as of writing:
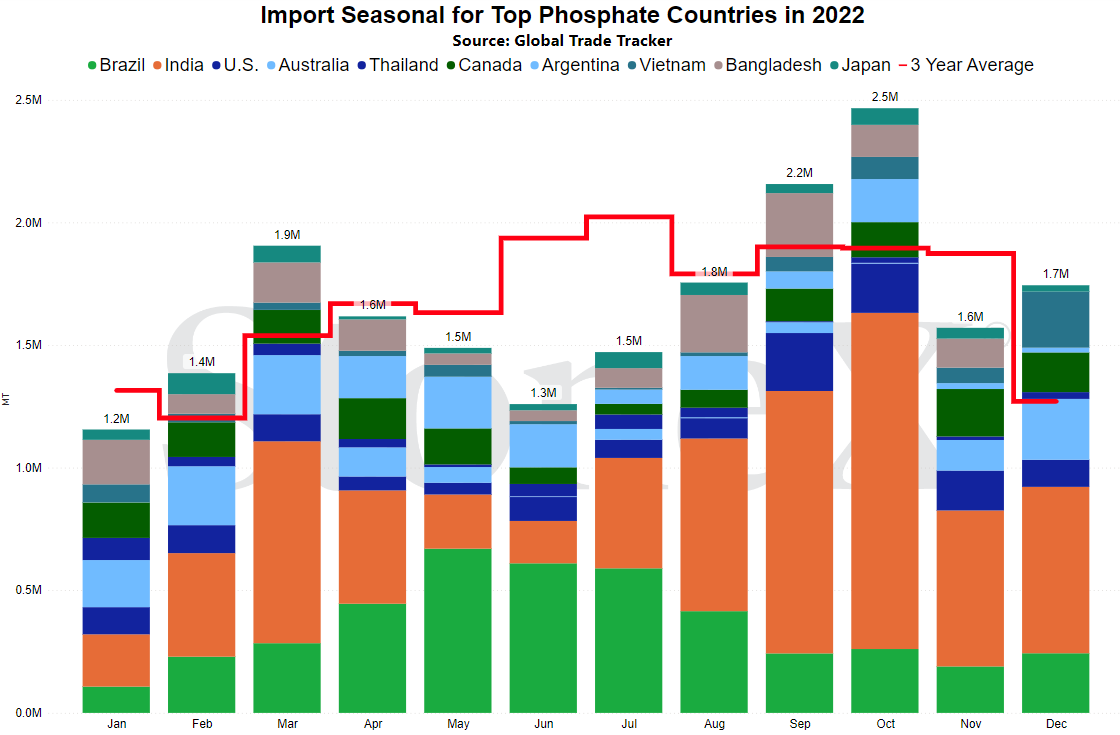
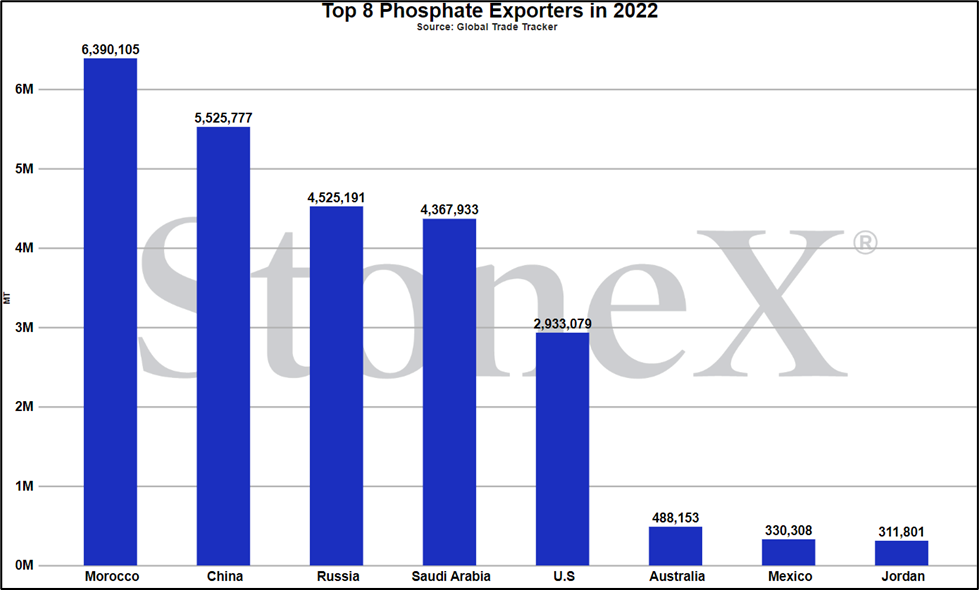
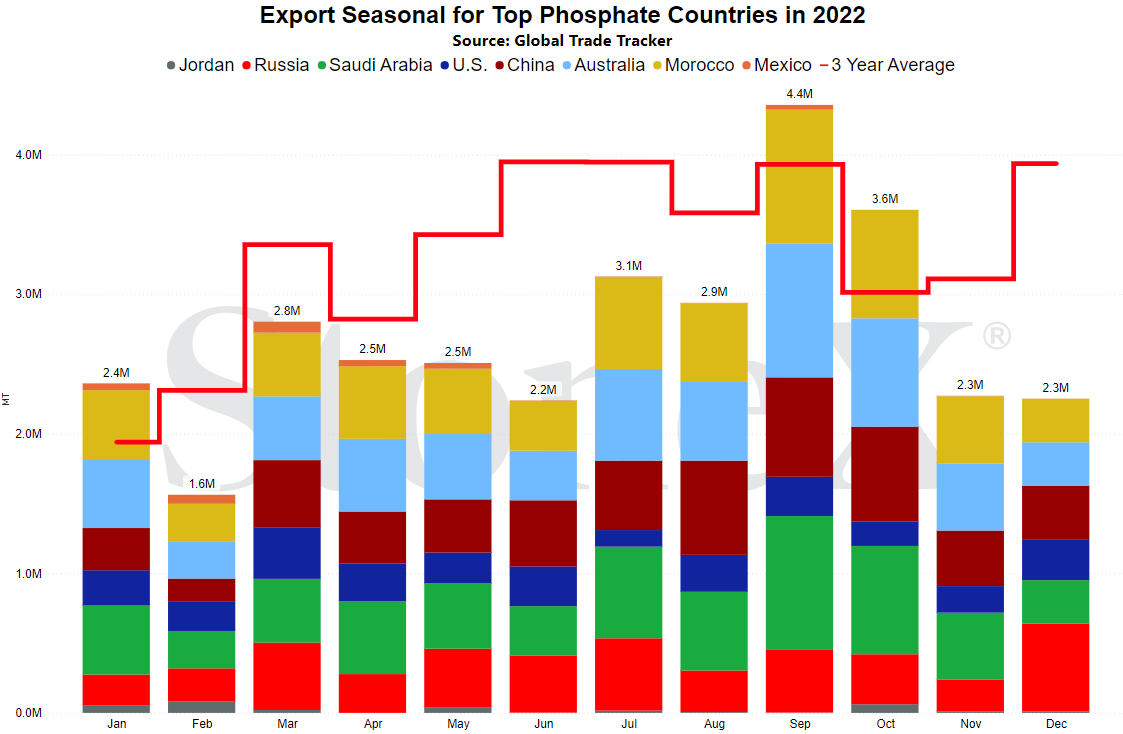
Continues to look like Chinese exports are returning
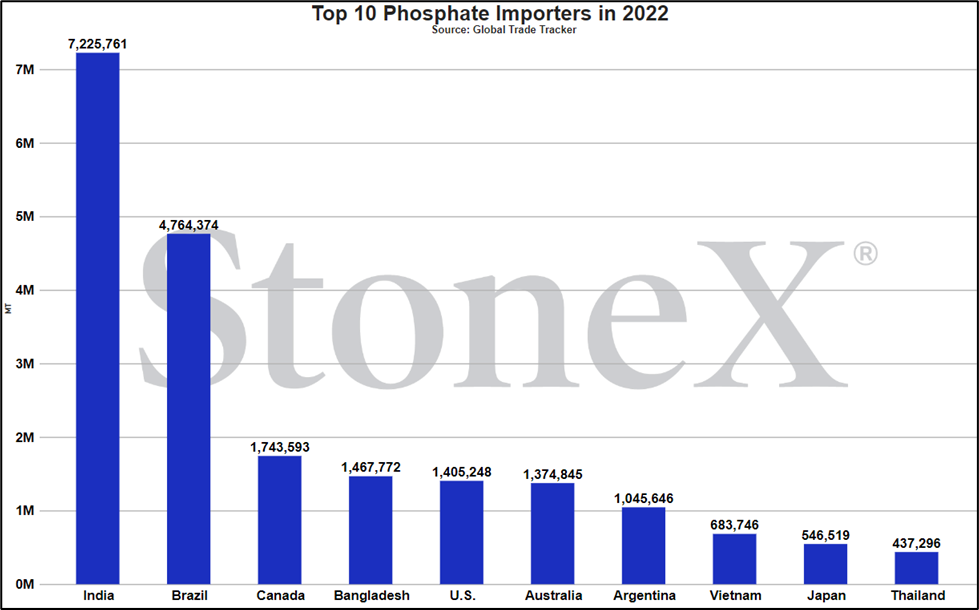
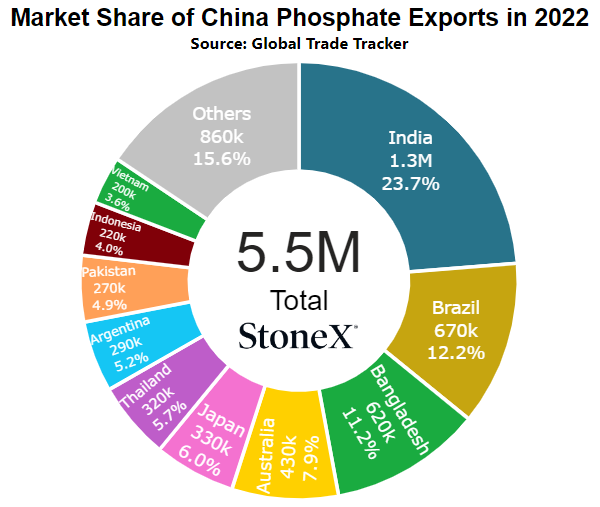
In case anyone is wondering why this is worth talking about, take a look at the above list of top global DAP/MAP exporters. China sits at number 2 on global rankings for 2022, and that was with export restrictions. Historically, they are the largest and one of the most important exporters for the world.
A large reason, from our POV, as to why global phosphate values have remained high is due to China's "absence". For those that are new to this newsletter, when the world got into a bad way with global values extremely high and inventories extremely tight, the Chinese government stepped in to reduce the number of tons that could be exported. The thought process was that this step would keep adequate inventories in place and lower values for Chinese farmers.
Today, with many of the world Black Swan events in the rear view mirror, the Chinese government is starting to loosen those restrictions.
If their absence helped global values to rise, their return should help global values to fall...at leas that is the hope.
As with everything China, we need to watch closely for any sign of change. They have done a 180 before and it would be irrational to think it will not happen again. That said, hopefully they adhere to this new approach which will hopefully help values to fall in farmers favor.
India reduces phosphate subsidies
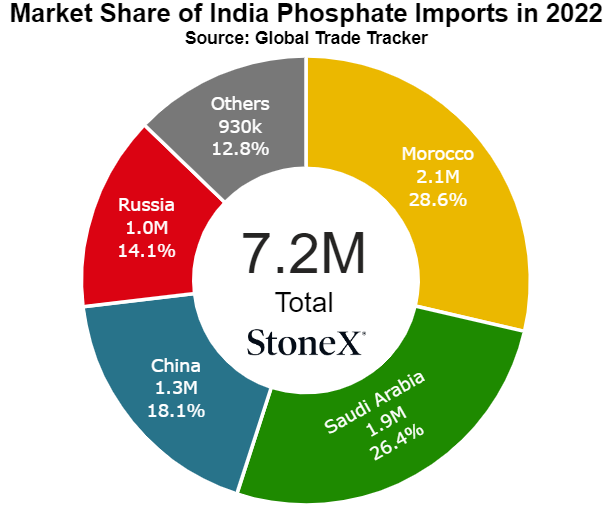
If China is important to watch from a supply POV, India is equally important to watch from a demand POV. As the world's largest buyer, what they do makes a difference.
We have recently seen where India is taking steps to lower the subsidy rate on phosphates.
For those unaware, the Indian government subsidizes the price of fertilizer to its farmers thru various programs. When the subsidy rate is high, it makes it much easier for importers to bring in product. However, the flip side is also true.
With the government reducing the rate, we now need to watch their demand patterns. This rate change could be due to their catching up on imports and building inventories. It also might be a reflection of their expectation that values will fall, so a higher rate is no longer needed.
If this rate change causes Indian demand to dry up at the same time that Chinese exports are resuming, that would be a pretty bearish one-two punch.
NOLA/N.A. phosphate moved to huge premium vs the world
N.A. phosphates got into a pretty rough spot this spring.
We talked a decent amount about how the fall run was huge and helped to reduce inventory levels. Then, we had a pretty quick turnaround with spring starting early to mid-February vs the "normal" March period. That meant the market only had a couple months to refill. Even the import/export difference did little to help inventory levels.
The part that we missed was N.A. production rates in Q4 coming in at bleak numbers. There were a lot more production issues than expected which removed a lot of expected supply from the S&D.
All of those factors combined to push NOLA DAP to a huge premium vs the world. Essentially, N.A. moved to an "island" vs all other points as it was simply too late to call on additional imports.
Now, with the bulk of spring demand behind us and planting taking shape, NOLA has moved back in line with the rest of the world and "should" continue to do so moving forward. Hopefully we will not only see world values fall in favor of buyers but also see N.A production rates improve back to historical levels.
Colossal change in phosphate/grain ratios since last summer
Please do not take this piece as a "I told you so". That is not the purpose. The purpose is to try and educate why we spend so much time looking at the ratio rather than just flat prices. My hope is that this helps look for the opportunities going forward.
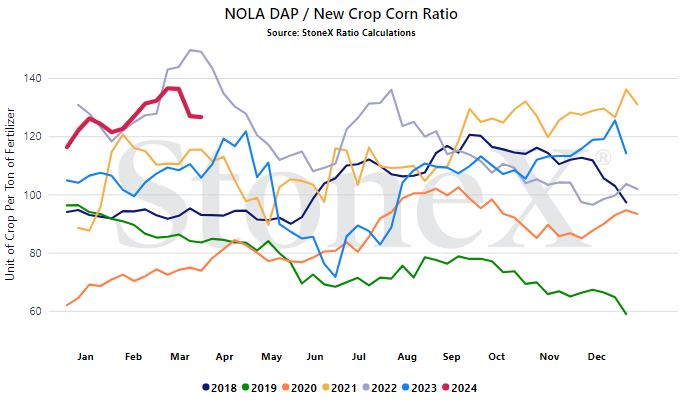
Take a look at the graph below. Last summer, we saw the ratio rates drop to sub 80. Most inland locations graphs will look different due to basis but directionally speaking, they should look similar. So this means that there was an opportunity to spend "only" 80 bushels of corn for every ton of DAP used. Now, I am trying to be as transparent as possible. Back in June/July, I thought phosphate prices could/should drop further. I also thought that grain prices could rally more and help lower the ratio rate even more. However, it was hard to ignore where it sat.
Since then, it has climbed tremendously. On this graph, it nearly hit 140 but in actuality, at one point is topped 150. NOLA barges trades at neary $700 while corn prices dropped sub $4.50. That meant that farmers were spending nearly DOUBLE the number of bushels for every ton of DAP used.
- Farmers that only sold their corn did well, but paid the higher price on phosphate.
- Farmers that only purchased their phosphate did well, but sold the lower price on corn.
- Farmers who did nothing suffered the most, selling corn for lower and paying higher for phosphate.
There might be some of you sitting there saying "I hit the high of corn and the low on phosphate every time." If that is the case, good on you...and why are you wasting your time farming?! You can make a lot more with a lot less work!!!
Still, I just point this out as something to reference as we move forward. This is where this approach can really help...and really hurt. If you haven't already, this is a great conversation to have with your retailer. The below graph is directionally correct but your local graph means SOOOO much more.

Questions starting to rise about summer fill programs
So spring application season is already starting to wind down. It was a great fall followed by a pretty darned good spring run. Inventories should be relatively low moving into the summer months.
On the flip side, buyers do not appear to be in any rush. Corn/grain values have bounced from their low's but are still well below their previous ranges. Lot of folks are talking about struggling with profitability for 2024 and 2025. Interest rates are high. Global markets look like they should see some bearishness moving forward. There is a lot longer period between the end of spring and the start of fall vs the end of fall/start of spring.
For now, it seems like the pressure will be on the manufacturer/supplier to find a price that will have buyers stepping forward for. For right now, there are very few that are excited to step forward to take the risk. This is especially true on the retail side. The last year or so has been tough on that side so if farmers do not step forward, why should they?
There is a wide range of price resets that folks are discussing. Today, it is all speculation. Hopefully we will see an opportunity pop up.
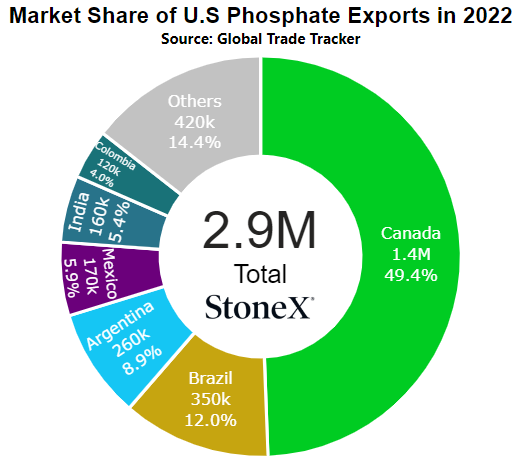
NOLA/New Orleans, Louisiana DAP price comparison
Number 5 global exporter in 2022
Price comparisons
Vs 30 days ago - -7% or approximately $45 lower
Vs 90 days ago - +2% or approximately $10 higher
Vs 6 months ago - +11% or approximately $60 higher
Vs 1 year ago - -2% or approximately $10 lower
U.S. Midwest Average (using multiple points across Midwest) price comparison
Vs 30 days ago - +7% or approximately $43 higher
Vs 90 days ago - +7% or approximately $47 higher
Vs 6 months ago - +9% or approximately $55 higher
Vs 1 year ago - +7% or approximately $44 higher
U.S. Northern Plains Average price comparison
Vs 30 days ago - +10% or approximately $61 higher
Vs 90 days ago - +12 higher or approximately $75 higher
Vs 6 months ago - +18% or approximately $105 higher
Vs 1 year ago - +5% or approximately $30 higher
U.S. Southern Plains Average price comparison
Vs 30 days ago - +5% or approximately $31 higher
Vs 90 days ago - +7% or approximately $48 higher
Vs 6 months ago - +18% or approximately $103 higher
Vs 1 year ago - +1% or approximately $5 higher
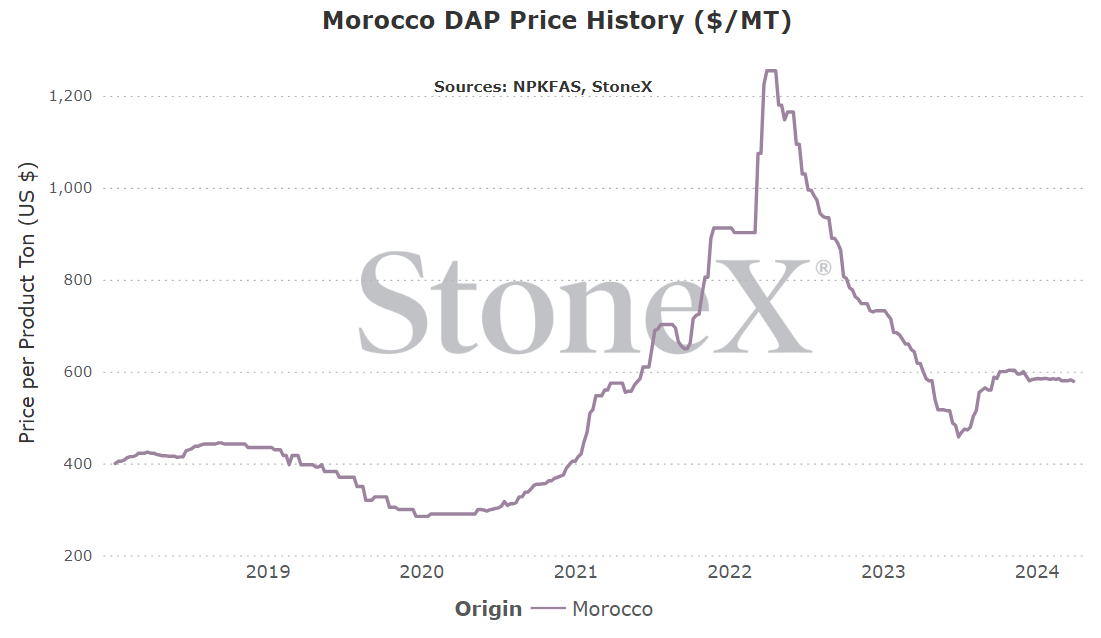
Morocco DAP price comparison
Number 1 global exporter in 2022
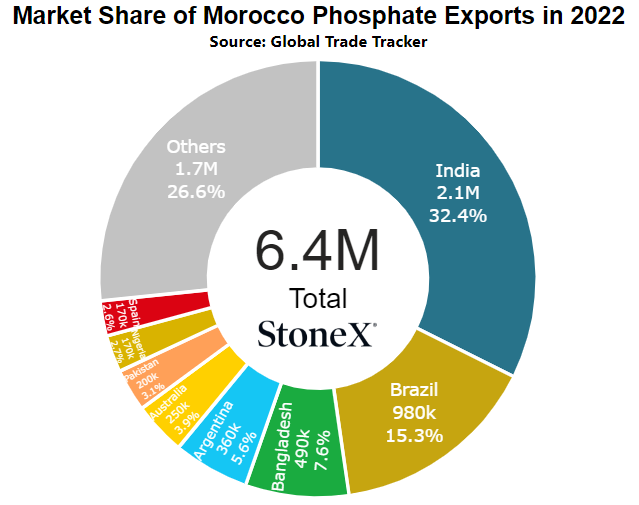
Price comparisons:
Vs 30 days ago - unchanged vs last month
Vs 90 days ago - -1% or approximately $4 lower
Vs 6 months ago - -1% or approximately $9 lower
Vs 1 year ago - -6% or approximately $39 lower-
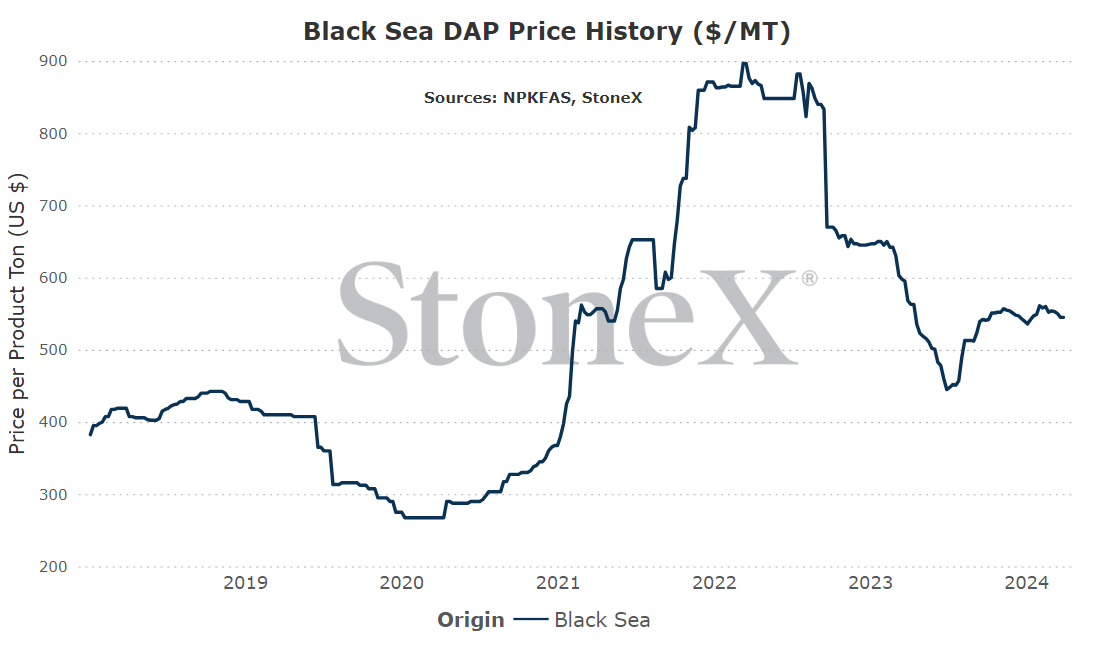
Black Sea DAP price comparison
Number 3 exporter of DAP/MAP in 2022
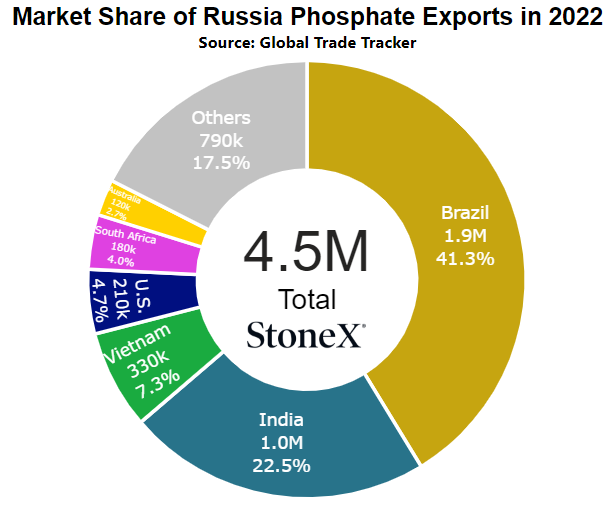
Price comparisons:
Vs 30 days ago - -2% or approximately $10 lower
Vs 90 days ago - unchanged vs 3 months earlier
Vs 6 months ago - unchanged vs 6 months earlier
Vs 1 year ago - -4% or approximately $23 lower
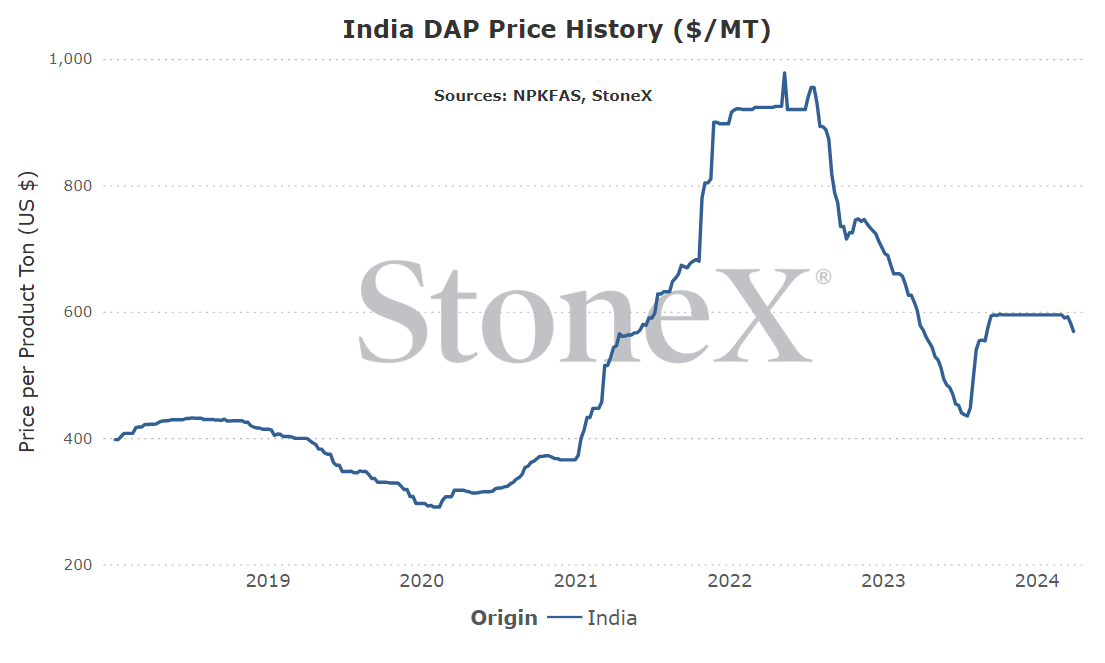
India DAP price comparison
Number 1 global importer in 2022
Price comparisons:
Vs 30 days ago - -4% or approximately $26 lower
Vs 90 days ago - -4% or approximately $26 lower
Vs 6 months ago - -4% or approximately $26 lower
Vs 1 year ago - -1% or approximately $9 lower
China DAP price comparison
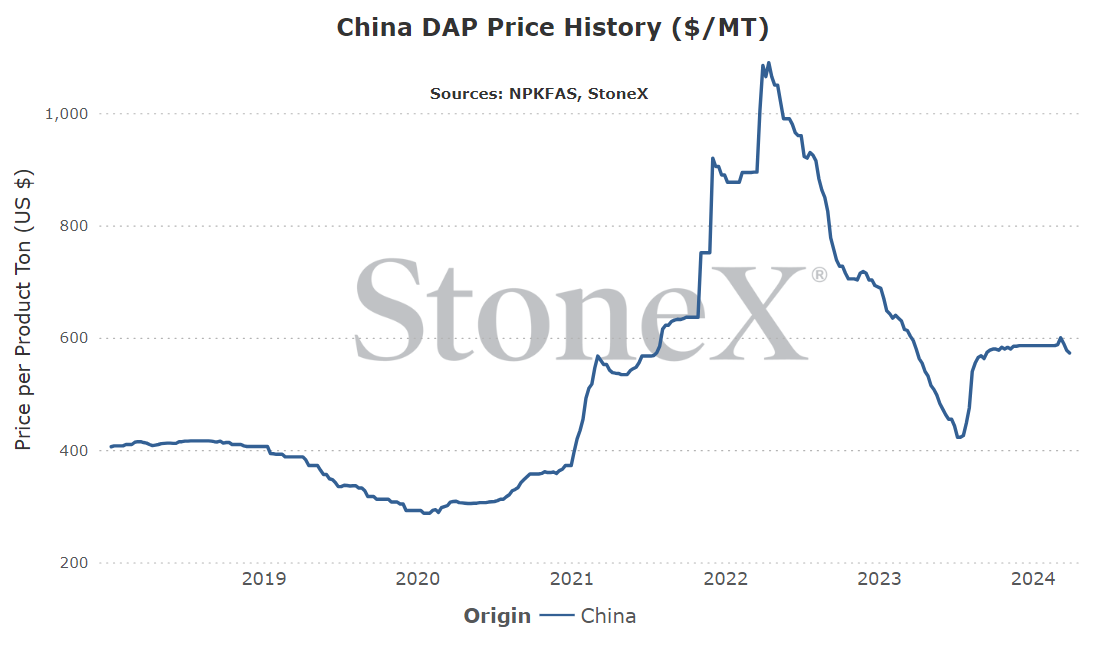
Number 2 global exporter in 2022
Price comparisons:
Vs 30 days ago - -3% or approximately $15 lower
Vs 90 days ago - -2% or approximately $14 lower
Vs 6 months ago - -1% or approximately $5 lower
Vs 1 year ago - -1% or approximately $8 lower
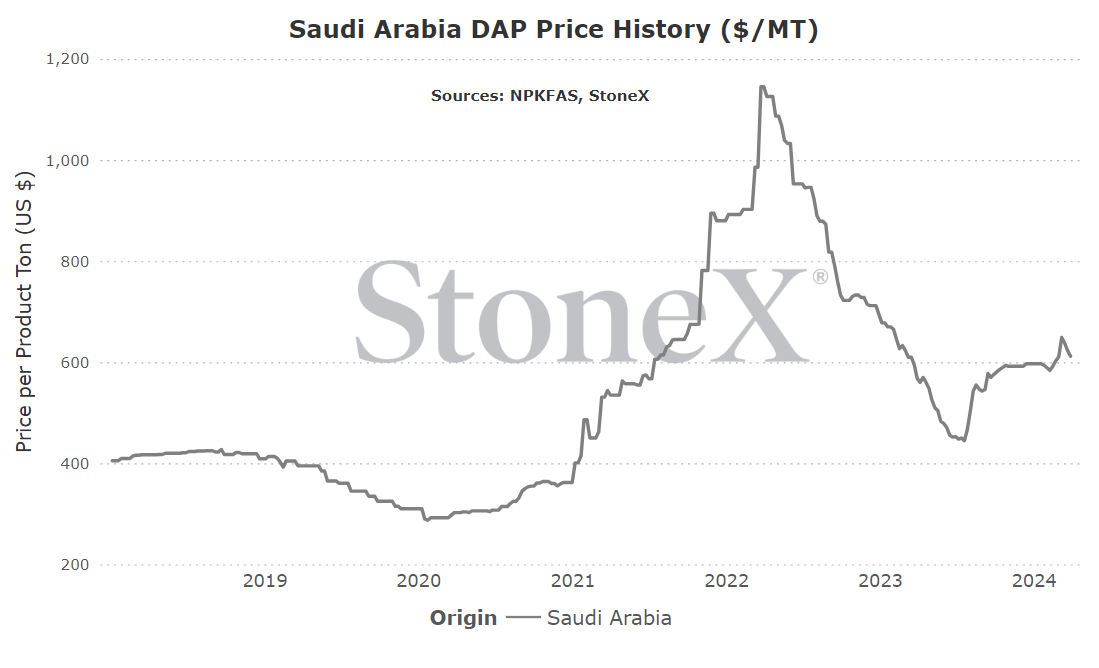
Saudi Arabia DAP price comparison
Number 4 global exporter in 2022
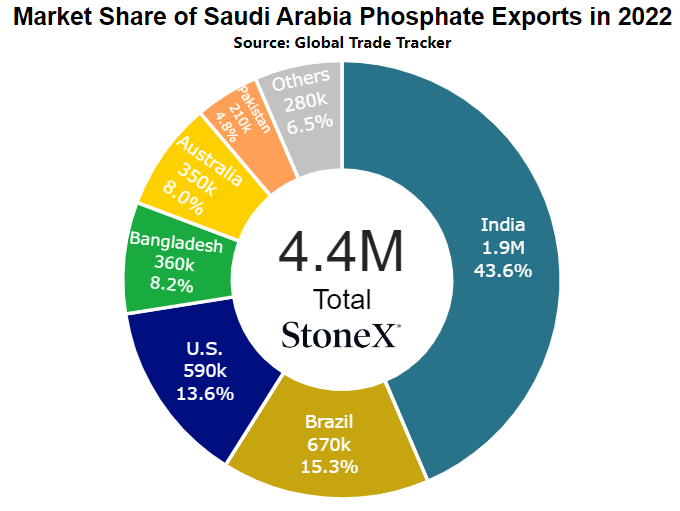
Price comparisons:
Vs 30 days ago - unchanged vs last month
Vs 90 days ago - +3% or approximately $15 higher
Vs 6 months ago - +7% or approximately $42 higher
Vs 1 year ago - +8% or approximately $45 higher
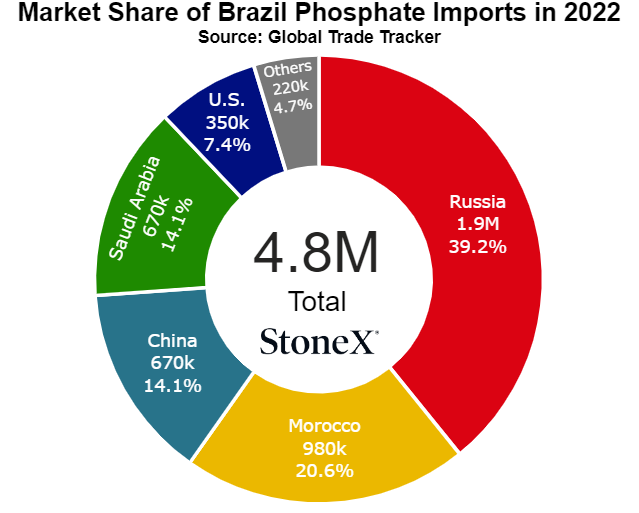
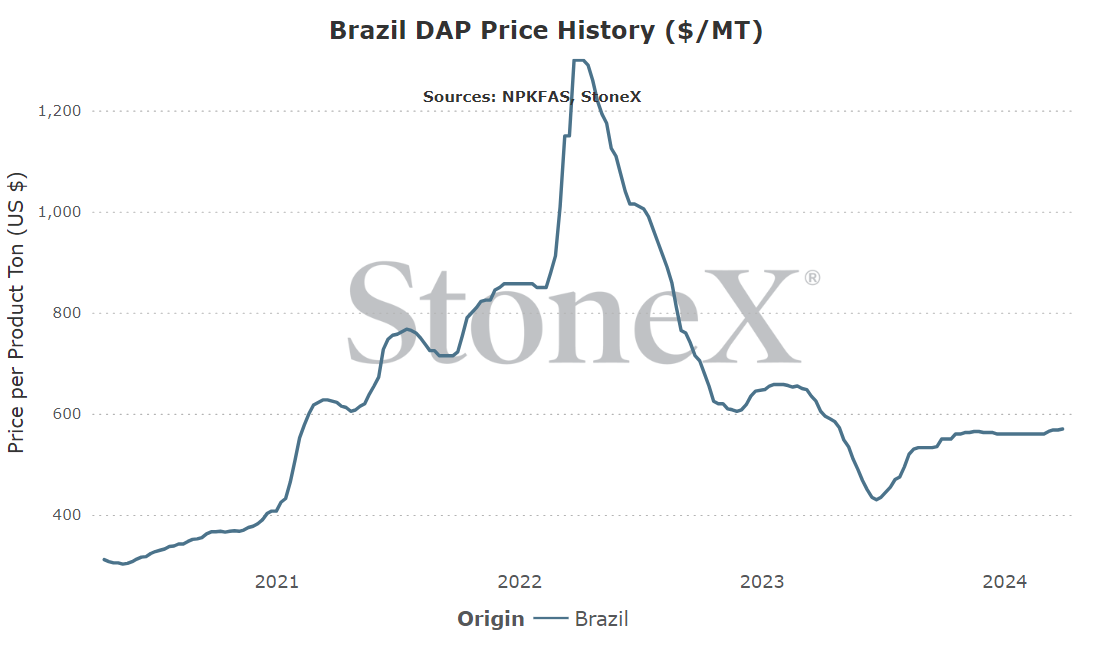
Brazil DAP price comparison
Number 2 global importer in 2022
Price comparisons
Vs 30 days ago - +2% or approximately $10 higher
Vs 90 days ago - +2% or approximately $10 higher
Vs 6 months ago - +7% or approximately $35 higher
Vs 1 year ago - -6% or approximately $35 lower
- China could reverse course at a whim – today, a lot of the signs point to Chinese export returns. However, it would be irresponsible to just assume they continue as stated. We have seen them reverse course quickly and unexpectedly before. While it is hard to see that playing out today, nothing is impossible. If we see the government make another change that reduces export flows, global manufacturers/suppliers will be more bold moving forward.
- Low ending inventories for spring means plenty of fill opportunities – lot of signs point to low ending inventories at the conclusion of this spring run. If warehouses are empty, that means manufacturers have a lot of space to fill with new production. As long as they have adequate homes for product, they should be less willing to drop prices. A market gets bearish when the supply side gets to large and needs to bring the demand side forward. With plenty of shed space to fill, that isn't the case for now.
- Still need to watch Russian/Chinese tensions with the west – Russia doesn't like western countries due to their support of Ukraine. China doesn't like western countries due to their support of Taiwan. The loss of either supplier would be painful. The loss of both is hard to describe on what it would mean. This isn't expected, but the impact large enough that it needs to be watched.
- Buyers will be in no rush – current grain/phosphate ratio values are still some of the highest ever seen. Interest rates are high meaning monthly carry cost is huge. There is a long time between spring and fall. The list goes on but they all add to the same type of buyer that will not be in a rush to step forward until they see something they like. Today does not appear to be that day.
- Current values make little sense vs grain values/historical ratios – today, there are exceedingly few times that the grain/phosphate ratios have been worse. That means farmers are spending more bushels of grain to pay for each ton of DAP/MAP they use. For the short term, these high ratio values have held because spring came early and inventories remained low. However, there is a long summer ahead of us and a lot of folks we talk to say there is little to no reason to get excited to step forward until it makes sense.
- Almost all signs point to China returning – while this can change, it doesn't look likely today. Assuming China proceeds as planned, it will mean a close to full return from the global phosphate export leader. That adds a lot of supply that hasn't normally been there. Like Martha Stewart says "it's a good thing"!
We believe that only looking at the flat price of either grains or fertilizer can be misleading:
-
Only selling grain can hurt you if fertilizer prices rise substantially
-
Only buying fertilizer can hurt you if grain prices fall
We look at the ratio "value" to get a better indication of where we are or how many bushels of X does it take to pay for 1 ton of fertilizer.
Would you rather:
-
Spend 150 bushels to pay for 1 ton of DAP
-
Spend 80 bushels to pay for 1 ton of DAP
When we compare the current ratio value against recent years, we start to see if we are high or low.
YOUR VALUES MAY LOOK DIFFERENT
This graph looks at the NOLA DAP price vs the flat grain price. There are no logistics on either product. Your location will look different due to fertilizer logistical costs, grain basis, etc.
- China/Russia tensions with the west - while it seems like both stories have moved on in the media cycle, make not mistake, tensions are still very high between the west and China/Russia. So far, additional steps have not been made so we have not seen anything detrimental in terms of phosphate supplies. However, do not lose sight of how important either one is...or how insanely important they are when paired together. If we suddenly start seeing increased sanctions on either/both that include phosphates, watch out.
- Inland supply availability vs declining market - you might be looking at the monthly price differentials and be thinking "I'm sure as heck not seeing that"...well, you might not be saying heck and you might add a few phrases!!! Yes, we are finally seeing NOLA/global values starting to decline a bit. If you are able to wait a couple months for that product to arrive, you should be able to see it. Unfortunately, the spring story has been dominated by tight phosphate supplies so an extent some have never seen. The future S&D might be loosen but the nearby inland is extremely tight and that is keeping prices high. It should not last forever but for this time of year, a few days/weeks may as well be forever.
- Current values vs grain pricing - the biggest thing that stands out to me is how high phosphate prices are vs grain values. With global S&D's starting to improve and spring season nearly behind us, it sure feels like the ratio needs to improve. Right now, it is hard to see a bullish future in most grains (I hope I'm wrong). If that is the case, I hope we can see it improve with phosphate values dropping.
StoneX Ratio Calculation
The ratio calculation is derived from Bloomberg historical grains values as well as fertilizer values from StoneX, NPKFAS, and Argus.
The calculation is simply dividing the fertilizer price by each grain price.
All data was sourced from StoneX unless otherwise noted.




