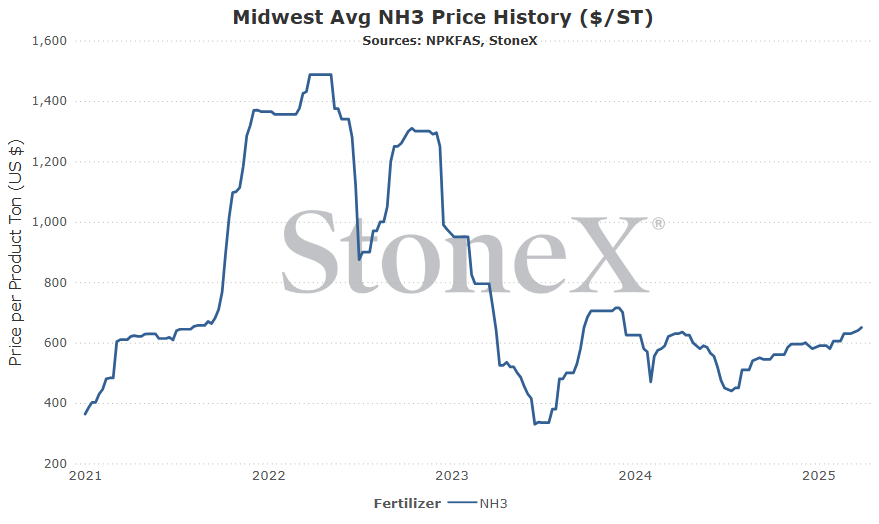
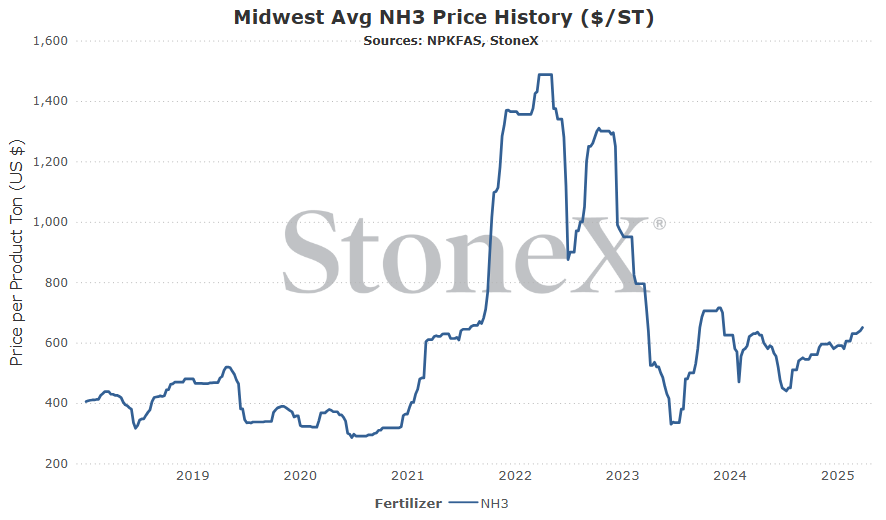
The first graph is the AVERAGE of the entire Midwest U.S. region. That means your local value WILL be different than what the graph reflects. Please do not take this into your retailer and say "why isn't my price the same as here". That is comparing apples to oranges. You might be on the cheaper or more expensive side of this graph. This doesn't take into account logistics/storage/interest/insurance/shrink/etc.
This graph looks at the price from a short ton and USD currency POV.
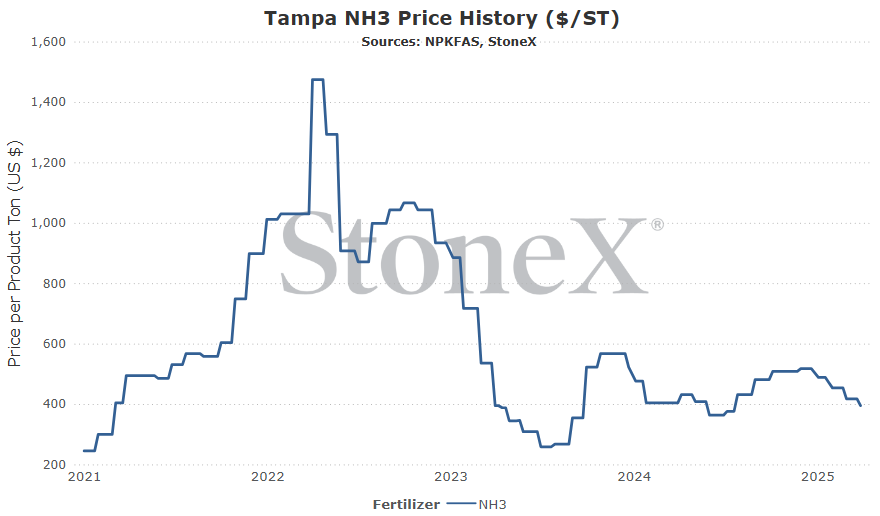
This second graph looks at the price set for Tampa NH3. This value does not have a high correlation to Midwest values. It is a talking point used when prices are rallying...yet somehow gets skipped on the way down. This price is more an indication of the global price. This price is set by two parties (purchaser - phosphate producer in Florida / seller - international producer providing NH3 to FL phosphate production).
This graph CAN be used as an indication of global market price direction/trends. This graph SHOULD NOT be used to determine a Midwest value. Tonnage is listed in short ton and currency in USD.
Normally by this time of year, global NH3 values should start their slide into the slow summer months...but this isn't normal. The world continues to struggle with the lack of Russian exports. While we expect their return, we just do not know when. When they return, it will be an incredibly bearish event...as long as their new export facility remains unharmed which is still within play given Taman's proximity to Ukraine.
Then we also have to factor in the Trinidad situation. Gas supplies continue to be an issue last we heard which means Trinidad nitrogen production is lower than normal.
That is two pretty large NH3 suppliers that are struggling...yet we just saw the April Tampa price fall once again. If the combination of Russia/Trinidad cannot stop the slide and we are entering the slow summer period, then what will?
I continue to believe the lack of Russian supplies and continued Trinidad production struggles will lead to a higher price floor...but we are not yet to it today. While anything can happen, it is hard to see global strength in the near term.
North America
Preplant applications are well underway for large swathes of North America!!! Temperatures have finally started to warm and farmers/retailers are taking full advantage where they can.
But this is the April edition which means we need to look ahead from where we are now. April will see most of the Midwest switch from applying fertilizer to planting seed. The conclusion of preplant season means the conclusion of spring application for most places...but not all. Those in the Eastern Cornbelt have a healthy sidedress period...which is where the competition and lower price idea forecast comes into play.
As the market shifts from preplant to sidedress in the coming month, we expect to see price ideas starting to fall. The sidedress period demand is nowhere near as large as preplant. That means that manufacturers across N.A. will be getting more aggressive on pricing to participate. Better to sell lower values today than to carry heavier inventories into the summer unknown. With the current high price of NH3 and the relatively cheap cost of production, it leaves PLENTY of room for manufacturers to cut prices to participate.
Anything can happen but I'm thinking we see the Midwest average lower when we end April and start working on the May edition.
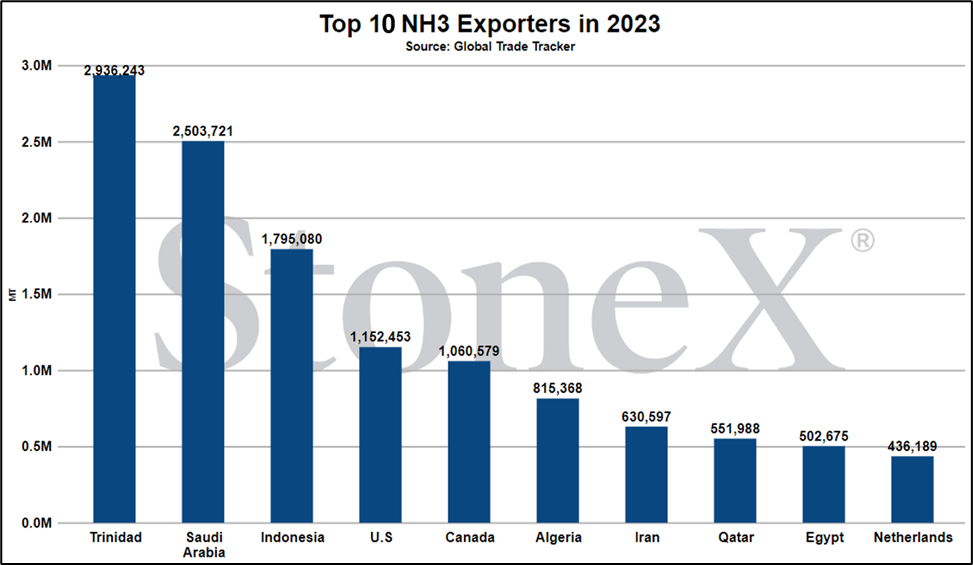
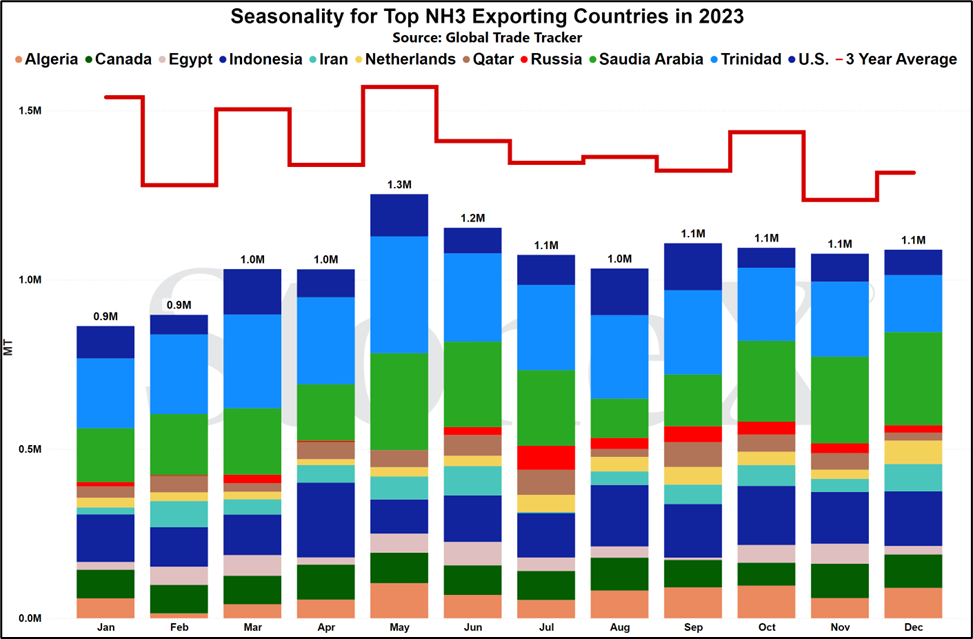
Global market largely unchanged, still no Russia
Other than a little hiccup in Trinidad due to gas supply issues (more on that below), the global NH3 market really didn't change much in the last month.
That is a large reason why we saw the April Tampa price slide another $25 from the March value.
For those that might still be wondering why global prices are not sliding further, all you have to do is look to Russia. A quick recap:
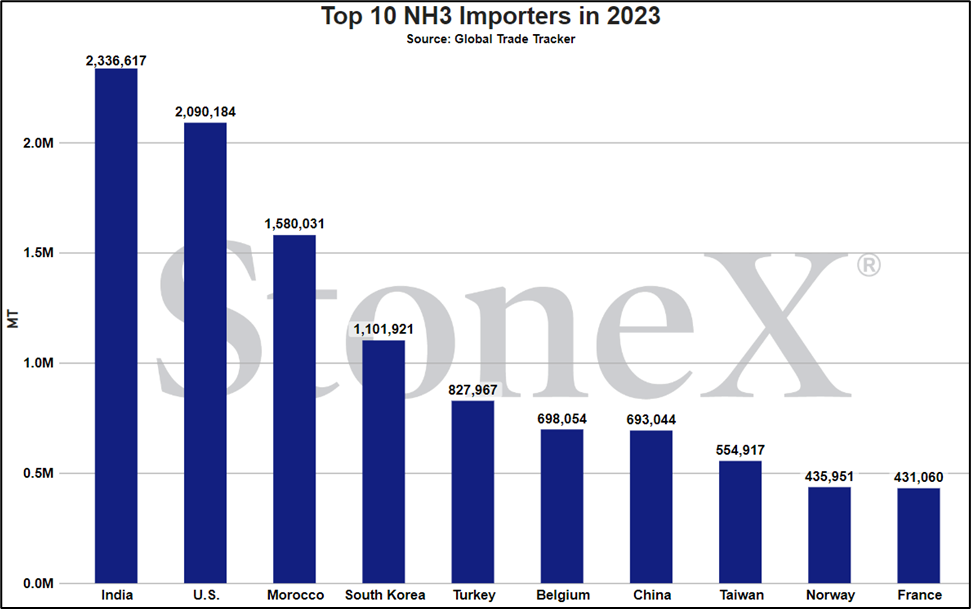
Historically, Russia was the world's largest exporter of NH3. They shipped north of 4M tons per year prior to the Ukrainian invasion. However, the world quickly learned how Russia moved their NH3 to the world following the invasion. They would produce the tons in Russia, of course. They would then send those tons into a pipeline that ran thru the east and south of Ukraine, ending in the Odessa region. From there, it would be taken out of the pipe, placed into vessels and shipped around the world.
Russia found out that you lose access to that pipeline/Odessa region facility when you invade the country those asset sit in.
Almost overnight, the world lost Russia and the global NH3 market lost a tremendous amount of supply.
Today, this situation continues. Russian attacks on electrical grids/infrastructure make sure that pump stations along the pipe are not operational. Fighting near eastern parts of the pipe caused damage that has no doubt not been repaired.
There continues to be rumors/reports that construction at their new facilities in Ust-Luga and Taman are nearly complete which will allow exports to resume in at least some capacity. However, those rumors and reports have not so far translated to actual exports. All the hope in the world cannot conjure up an actual exported NH3 ton.
Eventually their flows will return. It is simply too important an inflow of cash. When that day comes, it should place a lot of bearishness in the marketplace.
Hopefully that day comes soon.
What does this mean for farmers?
For direct application farmers, not much.
The global NH3 market is more industrial and upgrade to other nitrogen forms than direct application ag use. We have not seen production of urea or UAN ebb and flow due to NH3 pricing. It has been more about availability of securing it and being able to get it in the right place.
N.A. direct application season underway, is Mother Nature a concern?
We are here. Well, actually, with this being the April edition, spring preplant NH3 application is actually closer to done than starting!!!
So the question on the mind of the industry is this: how has spring application been?
At this point, it is unfortunately too early to tell. It isn't because of a lack of progress or anything like that. We are simply so far into the forest that we cannot see the tree's. We need a little more time to pass so folks can get past the bulk of application, have some time to rest, and then figure out what was or was not done.
So far everything seems decent. The areas that have started have reported back solid progress being made. There are still areas that have been too cold/wet, but long range forecasts are looking good.
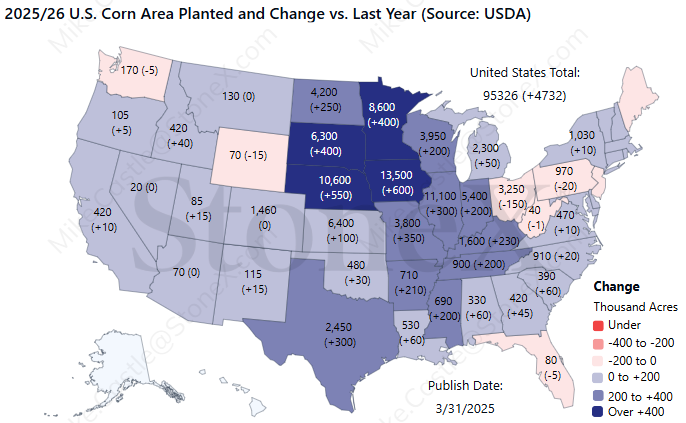
The big question in front of us today is how do we apply for the USDA's new corn acreage number? When I saw 95.3M acres, I thought it was a typo. Maybe they meant 93.5M or maybe they accidently hit a 5 instead of a 4. Nope!!!
95.3M acres is a healthy jump from most expectations. That is certainly going to lend support to NH3 demand...but how much.
That answer can be wide ranging based on where these new acres are picked up. We typically use 155 lbs of actual nitrogen per acre for each acre of corn. This number can move higher/lower depending on where the additional acres are picked up.
When we look at the below map showing the corn acres planted/change/etc., we see that some heavy hitters like Nebraska/Iowa/Illinois are picking up over 1M acres of the slack. We can assume that these states will see much heavier than "average" rates applied. However, some of the "outlier" states will likely draw rates lower. Let's just stick with 155 lbs/acre.
Next, what kind of an increase is 95.3M acres? We started 2025 with our estimates at 92M and quickly moved our demand models to 93.5M. In our scenario, we are "only" changing corn acres around 2M higher.
Last, we have to remember that NH3 is not the only N source. There is also urea and UAN. Let's just go simple and assume each form gets a third.
So:
2M acres x 155 lbs/actual N = 310,000,000 lbs of actual N demand increased
310,000,000 / 3 forms of N = 103,333,333 lbs of actual N added to NH3
There are 1,640 pounds of actual N for each ton of NH3
103,333,333 / 1,640 lbs of N for NH3 = 63,000 tons of additional NH3 needed
While we know things can change all across the formula's, when broken down a couple extra million acres of corn does not hugely shift each nitrogen sources demand.
Ultimately, it comes down to the original point. How does mother nature treat farmers/retailers. End of the day, if weather says no, it isn't happening! For now, things look good but we will know more in the coming weeks.
What does this mean for farmers?
Long story short: solid spring preplant run helps to lower inventories and supports price ideas, which is what we have been seeing.
The feedback we have heard so far has been positive. Either from those who have been in the fields for a while or from those preparing to get started. Demand looks solid. Mother nature is starting to step aside. All signs are pointing to a solid spring season which helps empty the system. In that scenario, sellers can keep their price ideas higher for longer.
U.S. Midwest Wholesale price average
Vs 30 days ago - 3% or approximately $20 higher
Vs 90 days ago - 10% or approximately $60 higher
Vs 6 months ago - 19% or approximately $105 higher
Vs 1 year ago - 3% or approximately $20 higher
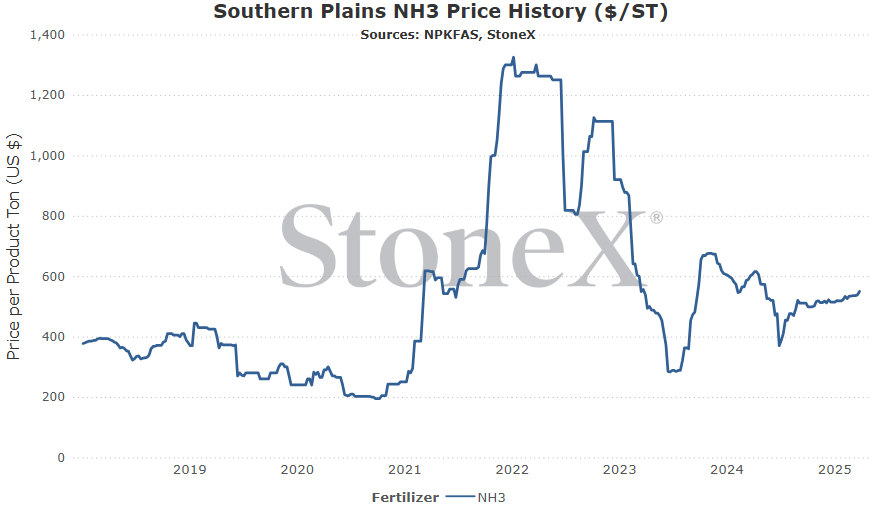
U.S. Southern Plains price average
Vs 30 days ago - 3% or approximately $15 higher
Vs 90 days ago - 7% or approximately $35 higher
Vs 6 months ago - 7% or approximately $38 higher
Vs 1 year ago - -9% or approximately $57 lower
- Further production hiccups globally - right now, the world is dealing with no Russian exports and Trinidad production suffering due to gas supply issues. Even in the face of that, prices like Tampa fell a bit for April. Now, if we see another major supplier have issues, I think we would see prices either flat or slightly higher moving thru April and into May.
- N.A. spring season stays wide open, emptying the system - this is what we are currently dealing with. The spring season, while it may not be perfect for application, has been good enough to start clearing out long positions/storage/etc. Lot of tons are moving. Enough that the market is starting to feel much "emptier". As this continues, there is less supply for continued demand which makes sellers more bold on price ideas.
- N.A. supply side gets empty heading into sidedress - the factor just above feeds into this one. Normally, we expect to see price ideas starting to ebb a bit as we move into planting and sidedress NH3 seasons. Most of the demand is done and sidedress represents the last chance to sell before moving to summer fill periods. However, if the preplant run is big enough, that can help keep prices elevated. It may not be "bullish" in nature, but it does limit downside price risk.
- N.A. shift from preplant application to planting - typically, as the market moves away from preplant NH3 application and into planting season, NH3 prices start to fall off. The market knows the looming sidedress demand is much smaller in size and territory. Better to drop your price to sell at current values than risk carrying tons into the summer. The market is feeling much tighter on supplies coming out of this preplant season, but historic price trends may still take place.
- Return of Russian and/or Trinidad - Trinidad should resume normal production in the near-term. They have these on again/off again gas supply issues. They are not seen as long-term events. Russia has been gone for a while and we continue to believe they will return at some pace. If either comes back, that will be a lot of supply that returns that should press values lower still.
- N.A. nitrogen upgrade production continues to suffer - that heading probably doesn't make much sense but stick with me here. We are seeing several N.A. UAN production issues. What we are not seeing are many overall nitrogen plant production issues. If a plants UAN production line goes down but the overall plant continues, that means the UAN feedstock starts to build. That is NH3...this creates a lot of excess NH3 supply the market didn't plan on and can quickly flood the market. The more supply there is, the more price pressure there can be.
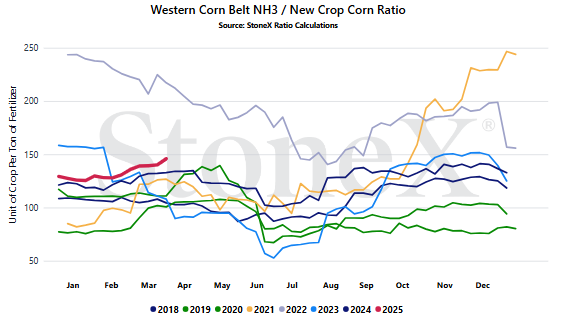
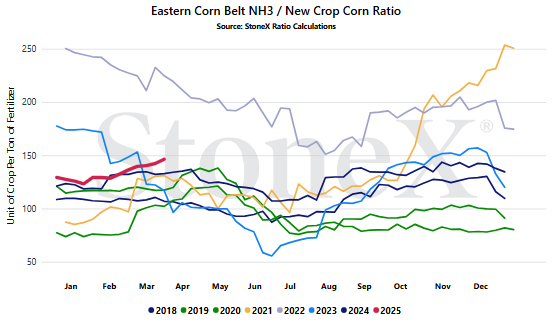
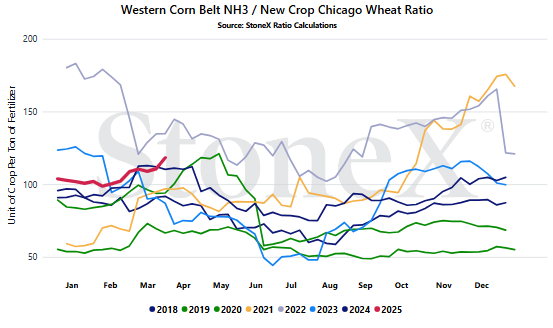
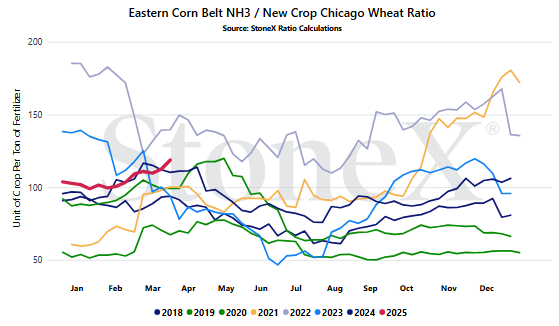
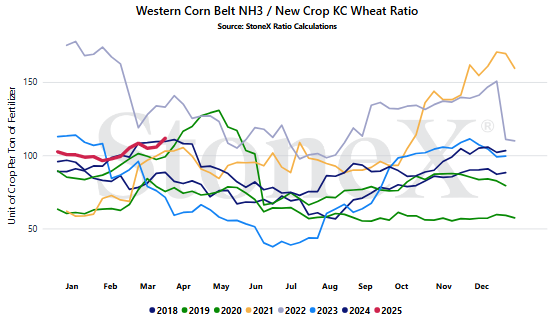
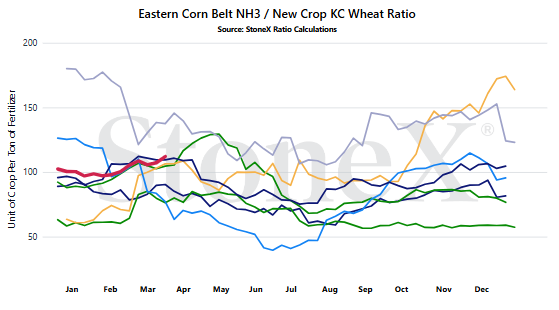
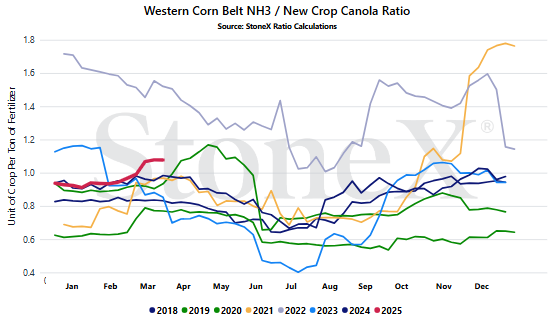
Where are the current NH3/grain ratio values today
We believe that only looking at the flat price of either grains or fertilizer can be misleading:
-
Only selling grain can hurt you if fertilizer prices rise substantially
-
Only buying fertilizer can hurt you if grain prices fall
We look at the ratio "value" to get a better indication of where we are or how many bushels of X does it take to pay for 1 ton of fertilizer.
Would you rather:
-
Spend 150 bushels to pay for 1 ton of potash
-
Spend 100 bushels to pay for 1 ton of NH3
When we compare the current ratio value against recent years, we start to see if we are high or low.
YOUR VALUES MAY LOOK DIFFERENT
This graph looks at the NOLA NH3 price vs the flat grain price. There are no logistics on either product. Your location will look different due to fertilizer logistical costs, grain basis, etc.
- Russia's eventual, possible, maybe someday return - I am so tired of writing about this. No doubt you all are tired of reading about it. Unfortunately, it remains just as important today as it was over a year ago when we first started hearing rumors. Russia was the world's largest exporter of NH3. Having their export flows stop means losing 4+ million tons a year. That is massive. That supports price ideas. However, if they were to return, that should be a massive bearish signal...if that day comes.
- Trinidad production issues due to gas supply constraints - as has been the case in recent history, Trinidad nitrogen production has been highly unreliable. Now, lets take a step back from that strongly worded sentence. This is not a situation that is happening because the manufacturers are making it happen. Trust me, at these margins, they are producing everything possible. This is simply a gas supply issue. If they do not have sufficient feedstock for their plants, there is little they can do. Fortunately, steps have been taken to boost gas supplies, but that will take time. Until then, Trinidad will need to be watched for continued production issues.
- Spring preplant success/failure in emptying storage - some may read this and think the focus is on what happens with nearby pricing. While there is some truth that a poorer preplant run can help lower sidedress price ideas, I'm more concerned with summer fills and next fall pricing. If we have a poor preplant run, that keeps many more tons sitting in storage at all levels. That places a LOT of pressure on domestic manufacturers. They want their system empty so they have room to put their free ammonia during the quiet summer period. If their storage isn't empty, it is likely the rest of the system still has product and that would have manufacturers worried about closing plants due to lack of space. Yes, a poor preplant season can weigh on sidedress price ideas, but it really comes to a head during summer fill.
StoneX Ratio Calculation
The ratio calculation is derived from Bloomberg historical grains values as well as fertilizer values from StoneX, NPKFAS, and Argus.
The calculation is simply dividing the fertilizer price by each grain price.
All data was sourced from StoneX unless otherwise noted.