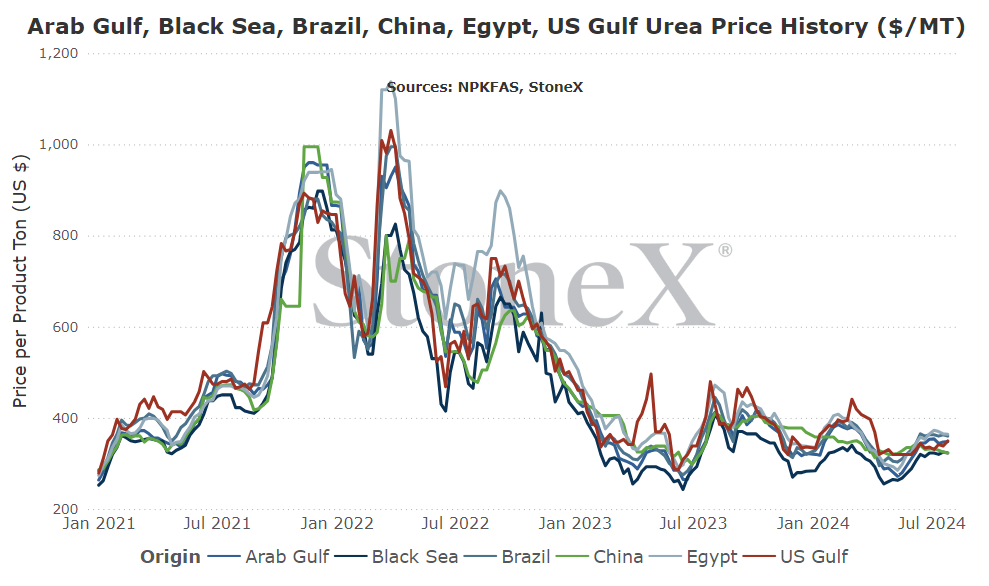
Major Global Urea Export Location Price Graphs
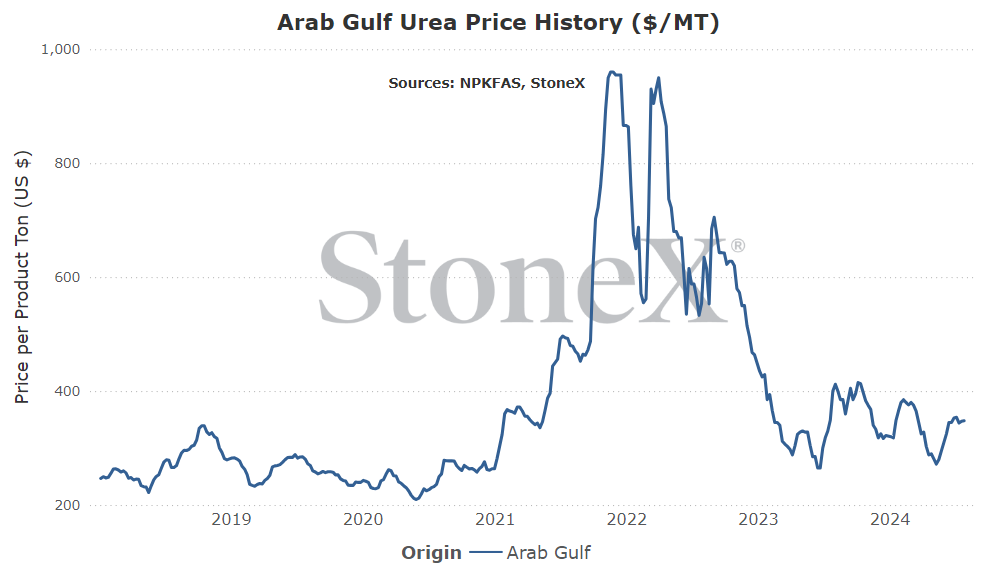
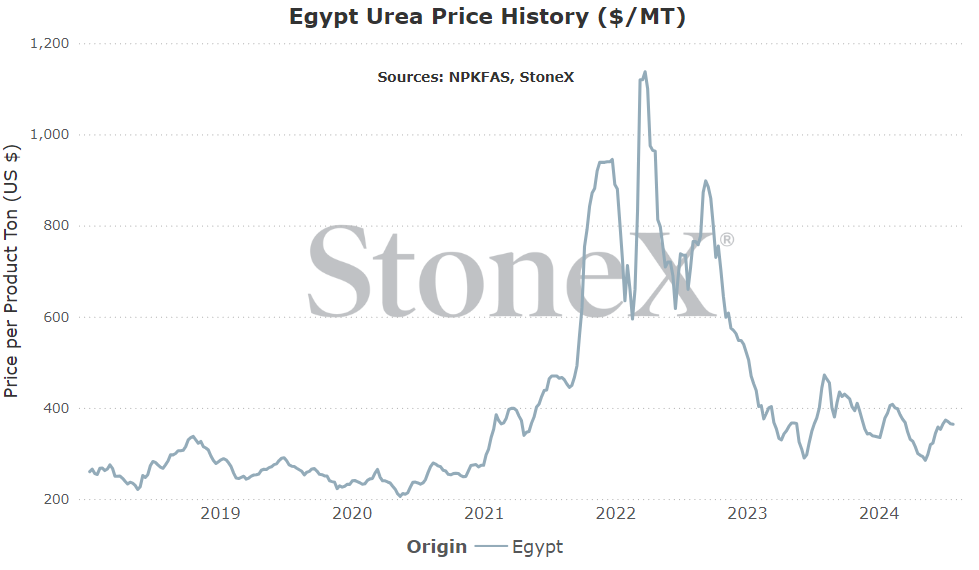
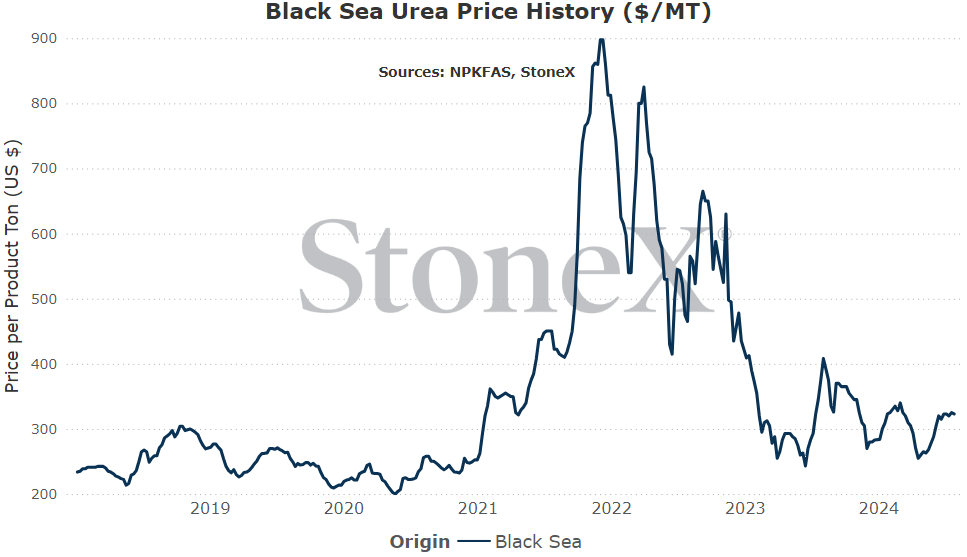
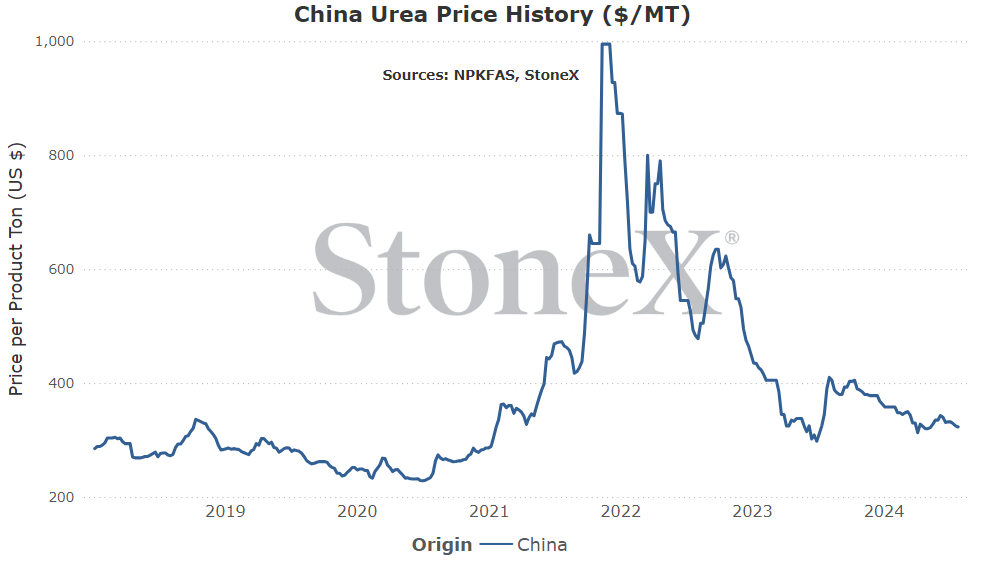
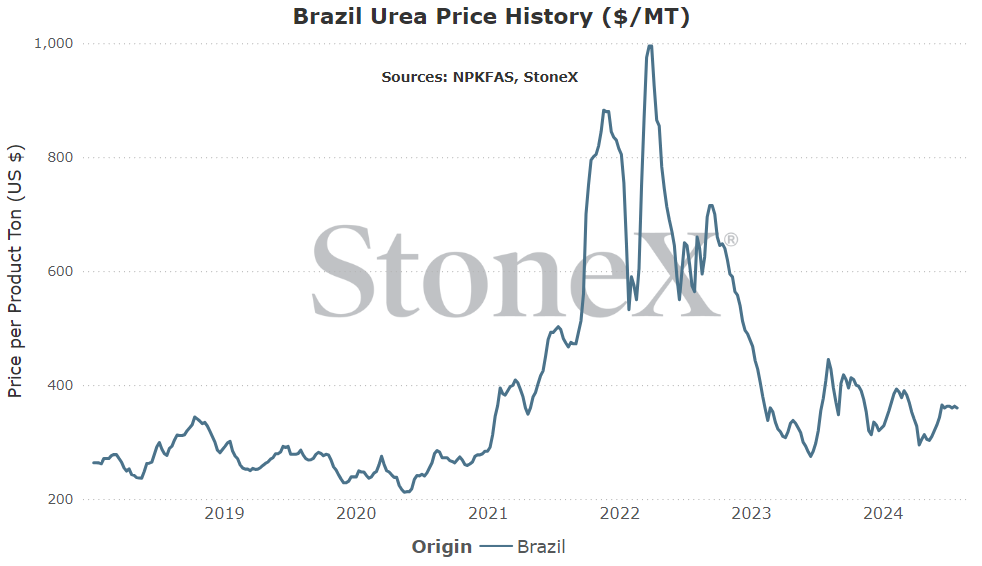
The intention of the below graphs are not to use to say "my price should be X based on this graph". These prices are derived from an FOB price point average. The intent is to show major global price movement trends. Your values will likely have significant basis difference (similar to your local grain price being different than the traded market price).
This graph is labeled as MT in USD currency.
What everyone wants to know first, what do we think will happen going forward
GLOBAL
This one is interesting.
Short term, I am concerned about the lack of real demand that is around. Typically, when that happens, values tend to slide. There is A LOT of urea produced every day around the world. That product needs to find homes. If the market even sees a few weeks of inactivity, you can start to see/feel the pressure.
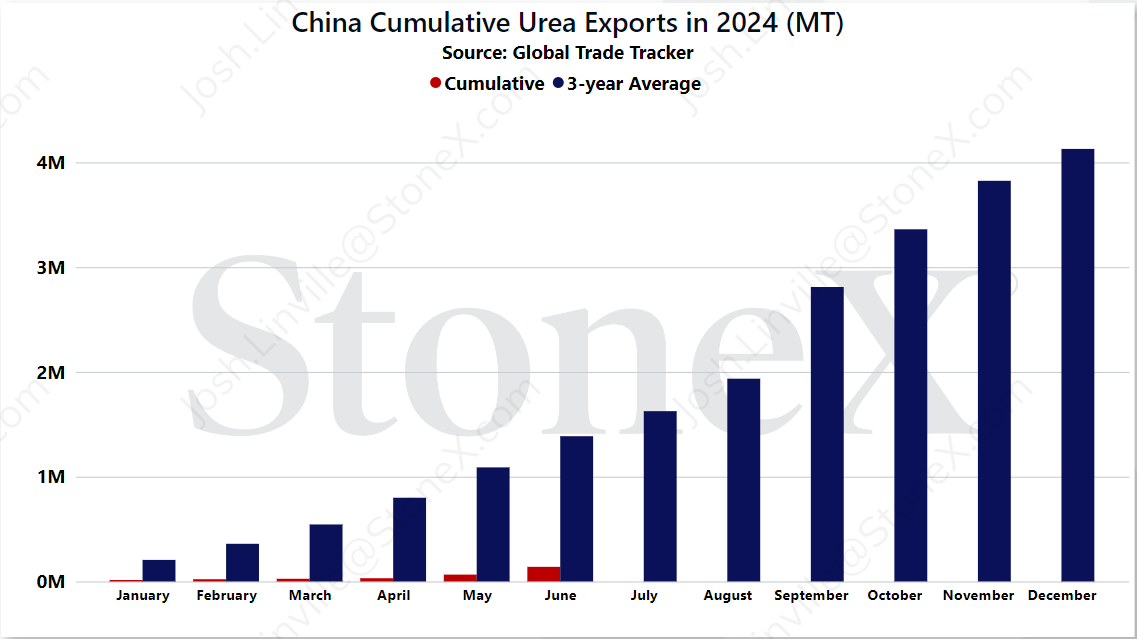
However, there are a lot of longer term production issues that could build into real issues. Europe is still at around 75% of normal production capacity and I've lost hope that we will see the remaining 25% come back near term. Brazilian production remains offline with no real hope of returning in 2024. Chinese exports for the 1st half of 2024 are almost zero (only 140K). Egyptian issues have gotten much better, but can we expect that to continue?
All in all, short term values should be relatively stagnant and poor demand could see prices slide. However, longer term (going into Q4 2024), supply issues could/should build enough that values start to be supported in the face of rising demand preparing for 2025.
NORTH AMERICA
The U.S. came out of fertilizer year 2024 (June 30) relatively high on ending inventories after big tonnages arrives in April/May. That helped to push NOLA to a more discounted price vs the world than normal. Since then, it sounds as though a certain manufacturer has been taking advantage of the NOLA discount to export larger tonnages which is helping to rebalance the S&D and put NOLA back into "normal ranges".
No doubt if global values see a bit of weakness short term, we could/should see similar for NOLA. On the flip side, as we look further ahead (Q4 '24), if global production/supply issues build and those values start to go higher, so to should NOLA.
I'm not expecting a lot of fireworks in the next few weeks/couple months. Values "should" remain relatively rangebound. However, as we move into the fall and spring comes closer, do not be surprised to see values higher.
I know this goes completely again grain prices which are low. In theory, all fertilizers should fall as a result. However, if the expectation remains that corn will stay 90+M acres and all other crops remain unchanged, they nitrogen will be needed. P & K could see some demand shifts, but nitrogen is absolutely needed to raise the crop. Unfortunately, the market knows this.
General Global Urea Information
What has happened in the last 30 days?
India purchase concludes lower tonnage, leaves bullishness in wake
There are not many certainty's in life.
Death
Taxes
India urea purchase tender will not follow the script!
So to the surprise of absolutely no one in the industry, last month India stepped forward to purchase a block of urea. For those that are new, India has a unique way of purchasing urea. Rather than multiple parties constantly trying to lock up imports, mostly two companies will issue "purchase tenders". After they announce their intention to purchase, complete with the dates that include submission/offer validity/shipment window, and then wait for the offers to roll in. Once the submission date is reached and all offers opened, they publish all the values that were received. For the rest of the world, this is typically a great event as it forces the market to show their cards on pricing/tonnage/etc. No games. No gimmicks. Best price and tonnage.
Once the offers are opened, the lowest price (L1) for the west coast and east coast are established. That is when negotiations begin. Offers, in order to sell/participate, are required to drop their price to the L1. India will go back to the offers and give them a chance. If they say yes, the contract is written up. If they say no, they go to the next party. This goes on until either India secures the number of tons they are looking for or they run out of offers. The final tonnage awarded is announced and the process is complete.
This is why I always look forward to these tenders. It is such a great tool that wipes away all the stories, all the positioning, all the blustering commentary and strips the market to the bone. Here are the values. Here are the tonnages. Here is the market in a nice, neat package.
So, back to this last tender.
It came as no surprise that India stepped in to purchase, but the question was how the market was going to respond. When India announced, several were surprised at how long the shipment window was. Offers could ship product until August 27th which historically is a longer window.
Wider the window = More time for offers to find tons = More time for tons to be produced and offered
When all offers were opened, approximately 2.7MMT were offered and the offered values were relatively tight. Of the 2.7MMT offered, almost 1MMT was within $5 of the L1's which is a lot in a narrow price range. It wasn't long after that India announced that they were only look to secure 600KMT. This is absolutely a large number of tons but when compared to the industry expectation that they could be in the 1 - 1.5MMT range, it was "disappointing". That many tons offered in a very narrow price range and a small amount of tons being secured should have been a slam dunk for India.
Except that we always say "wait for the end" because these always have an M. Night Shyamalan twist!
As India started going back and negotiating with the higher offers, they were told no more often than not. In the end, they "only" secured 434KMT and of course the story always comes down to interpretation. In this case, the ending story was a more bullish marketplace. India was not able to buy the tons they wanted to buy. Offers largely told them no. While I struggled with why offers would say no when they were so close to the L1 values, my struggle doesn't matter. Those offers saw a better opportunity in the future than selling India today.
So that is where we sit today. The expectation is that we will see another tender announced in the next week or two where this market game will play out once again and lay it bare.
Chinese exports remain near non-existent for 1H 2024
Not trying to start this piece off by scaring folks, but this is becoming my biggest fear point of 2024.
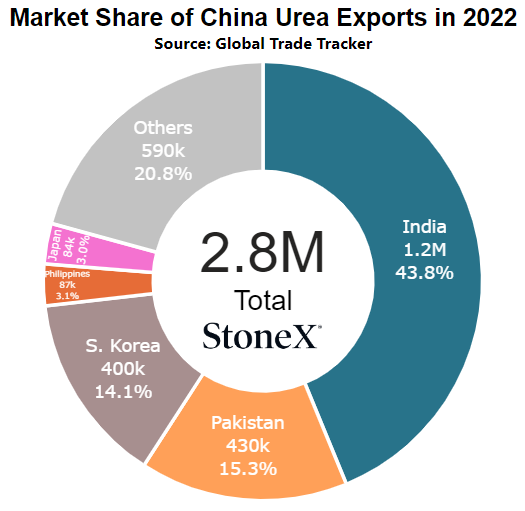
In recent history, China has been a large piece of the global urea export market, accounting for approximately 5 - 5.5MMT per year. With the global export market being 50 - 55MMT/year, they were 10% of that total. Certainly a large enough percentage that when they scale back exports, it is felt.
And have they ever scaled back exports this year...
We currently have Chinese export data thru June, which means we have a solid look at their halfway point progress. If we look at the last 3 years, which have seen their volumes lower due to government export restrictions, their cumulative export total sits at around 1.4MMT. This year, they are at 140KMT. Worse, during recent discussions, most estimate that China will improve for the 2nd half of the year and close out at 1.5MMT. If we go off the 3-year average, that is a shortfall of 2.5 - 3MMT for 2024. If we go off of normal, that is 3.5 - 4MMT less than we should expect.
So what gives?
In the early months of 2022, global inventories were feared very tight and as a result, global values were skyrocketing higher. The Chinese government, sensing a risk that all Chinese produced urea might get exported leaving Chinese farmers in a bad way, stepped in and started to place restrictions on exports. Their hope was likely that the restrictions would not only ensure adequate product for their farmers but because they were closed to the world, domestic values would fall.
Fortunately for them, they were right.
Unfortunately for the rest of the world, they were right.
Today, global values are much lower than those 2022 high's. Global inventories are significantly improved from what everyone feared as well. With both of those improvements, the hope was that export restrictions would be lifted and normal global trade flow would resume. However, the Chinese government has seen it differently. Every time that they start to insinuate that export restrictions will be lifted, domestic Chinese urea values start to rise and that is noticed. When that is seen, their POV changes and they decide that they will keep them in place.
And that is where we are today. We continue to see reports that Chinese production rates are running at high rates. One recent estimate had their daily production rate at 176,500 tons per day. No, that is not a typo (I checked three times). They are producing more in a day than they have exported all year which does raise the question of where that product is going. Some believe that the operating rates are being inflated and they are nowhere near those values. Others estimate that China is stockpiling huge quantities. It would take a heck of a lot of effort to make that much storage but they were seen building a hospital in 10 days. Others see those production numbers and assume that their 2nd half exports will be huge as they start to purge product.
There is still a lot of story that needs to be told for China that will go a long way in determining the global outlook. For now, we watch and react.
Global supply outlook appearing tighter
I sure wish I could have ended the bad supply news story with China...so here goes.
Obviously, the China piece above points to a large supplier that may leave the world with less supply than it expected. Unfortunately, the list goes on.
China
No need to repeat the above section. If they reach 1.5MMT exported this year, it is a shortfall of as little as 2.5MMT and as high as 4MMT.
EU
The EU region continues to grapple with high natural gas values. Fortunately, the Dutch TTF has dropped from its high of $103MMbtu. Since that point, we saw those same values fall into the $7MMbtu range and they currently sit $10 - $11. This has helped the nitrogen production rate in the region grow to 75% of normal...but it has stalled there with fading hopes that the last 25% will resume. For one, global nitrogen values appear much more subdued than in recent years meaning the manufacturer hope that prices will shoot to $800 and make them profitable is hard to see. Second, it is hard to see their natural gas values falling further. Even if relations between Russia and the rest of the world improved, the Nordstream pipeline was blown up in an attack that ruptures the lines. To the best of my knowledge, repairs were not made so the inside of those pipes have been subjected to conditions that have likely rendered them useless. Essentially, new pipe needs to be laid.
For urea, the European regions accounts normally for 15.5MMT per year. If they are operating at 75% of normal, that means a production shortfall upwards of 3.5 - 4MMT.
Brazil
Another country that is struggling with high natural gas values.
Brazil has seen its nitrogen production plants go idle as high nat gas inputs created a money losing environment. Rather than take a loss for every ton produced, they have opted to shut down until conditions improved...and conditions have still not improved.
With annual production rates around 1.5MMT per year, this not only removes that supply, but it also builds the global demand by the same number as they now have to replace the tonnage.
Another hit to the global S&D.
Egypt
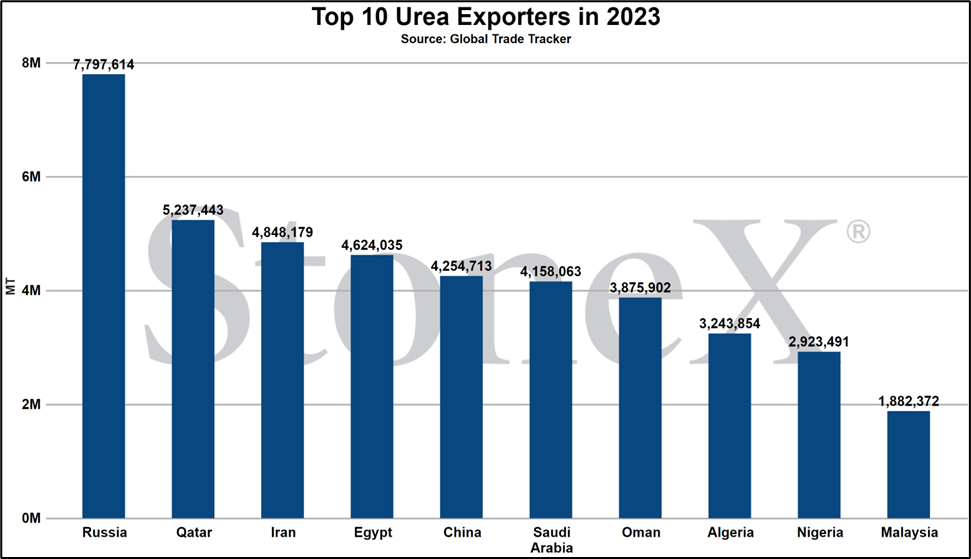
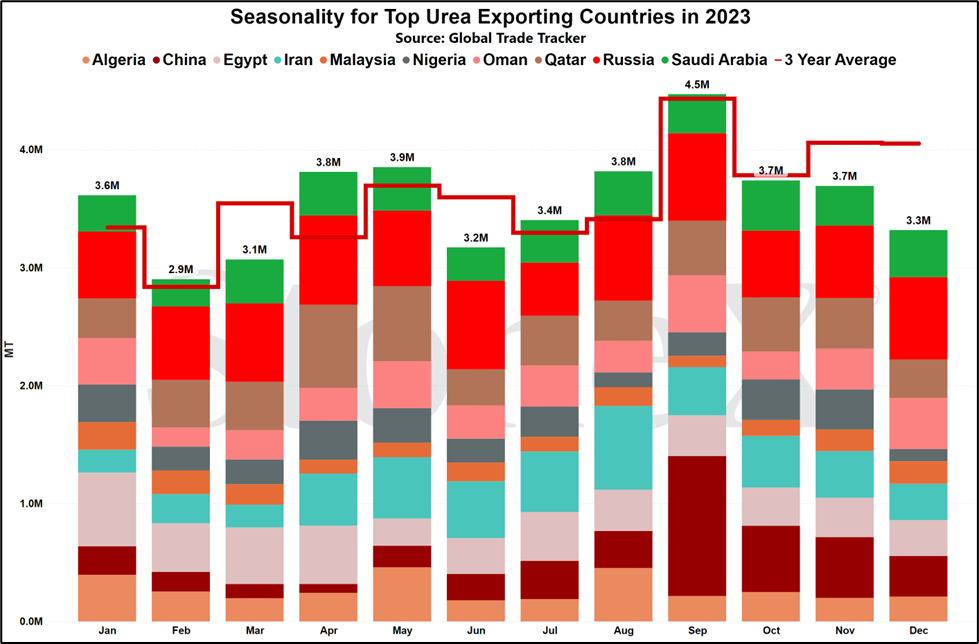
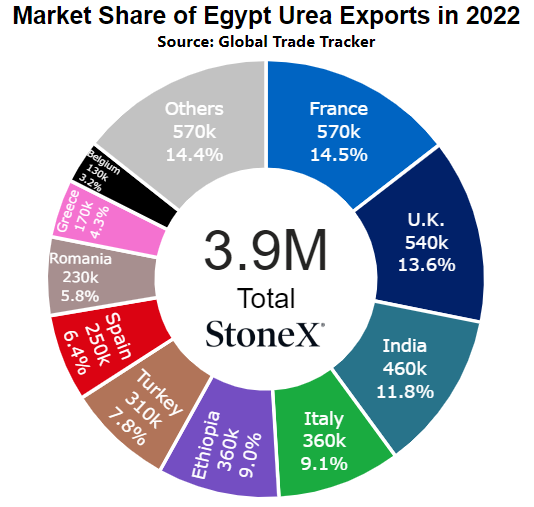
Fortunately, this is the one with a bit of a happier ending. Last year, Egypt was the 4th largest urea exporter in the world and in recent months, it was their sales/action that helped the world to move out of the bearish cycle and start seeing prices rise. They can have that kind of impact on the global stage.
Unfortunately, they have been having natural gas issues for the last couple months. Temperatures have been higher earlier than most expected. When this happens, the government typically steps in to ensure enough natural gas is available to the public to meet their demand. When that demand is high enough, as it has been, the industrial sector suffers.
That has been the case where Egyptian based nitrogen production facilities have had to lower or completely stop their production of nitrogen fertilizer. Fortunately, the government has been proactive and has put plans in place to bring in gas so facilities can run. The outlook is solid, but damage has been done. All of the production hiccups are now in the past and cannot be made up. Based on our estimates, they have lost approximately 10% of their export capacity for the year.
So supplies are tight
And this is not good for buyers if this story continues to build. The tighter the supplies, Econ 101 says the higher the price. Today, the market is more concerned about the lack of demand because of poor farm economics. It is stalling the market...but that can only last so long. If the 2025 crop acreage mix remains unchanged, nitrogen demand will be there. Eventually, that buying pattern has to begin and will need to confront the supply situation.
That may not happen for a couple months. There is a lot of time between now and spring...but the outlook is getting rougher.
U.S. ends fertilizer year 2023 on higher inventories, exports may be "solving" the issue
The U.S. has enjoyed a very solid couple months of urea imports for April and May. April saw the total nearly 1.3M tons. May cooled off but still came in with nearly 500K tons arriving. That was a two month total of around 1.75M and that pushed the U.S. into a bit of an oversupplied situation as it closed out fertilizer year 2024 (finished on June 30).
Great, so what does that mean for pricing?
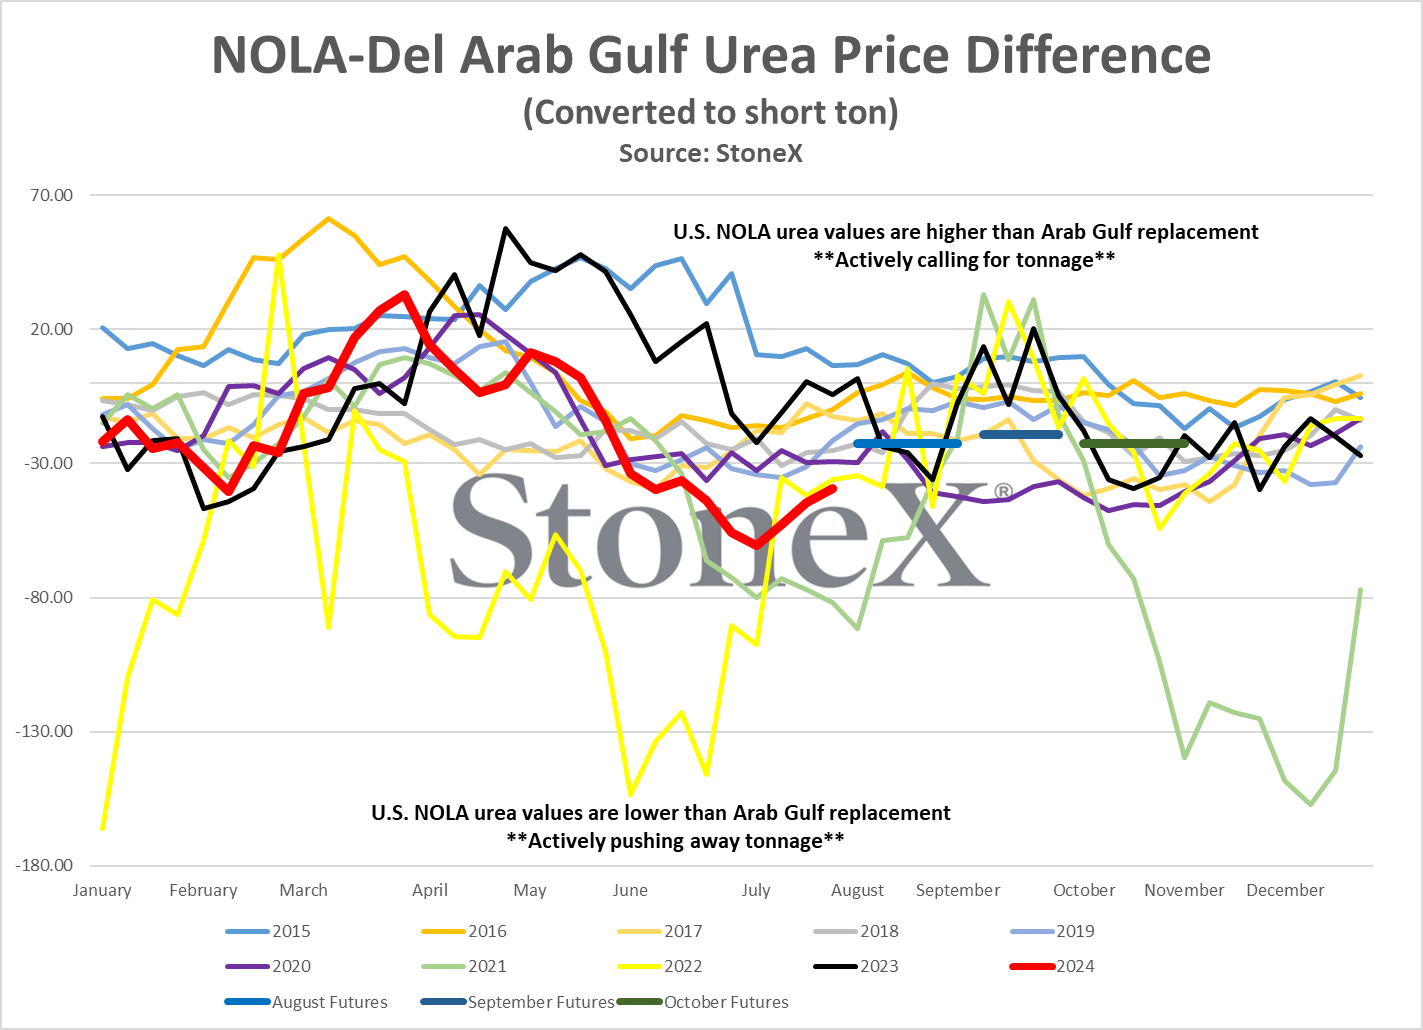
I generally look at the NOLA price vs the world as it trying to tell a story. It is impossible to know what that story is without comparing against the world and comparing against recent years. Since the Middle East region supplies approximately half of the U.S. import flow and is a more easily tracked marketplace, I watch this price differential on a weekly basis. All it is doing is looking at the cost of Middle East values to NOLA (Middle East Urea + vessel freight, convert to short ton and then some additional cost to put to barge). The graph is below but this is how I read it:
NOLA is even money to a premium vs Middle East replacement - the U.S. market is essentially asking for imports to rise as it is willing to pay a premium to the world.
NOLA is even money to a $30 discount vs Middle East replacement - the U.S. market is well supplied, does not need additional imports but does not need to export product
NOLA is a $30+ discount vs Middle East replacement - the U.S. market needs to export to balance its S&D, it has too much
Coming out of the spring season, NOLA dived to a $30+ discount vs Middle East replacement values which when coupled with the April/May import total makes perfect sense. We brought in a tremendous amount of product late in the year and ended fertilizer year 2024 with high ending inventories.
Translation - the U.S. needed to export product to balance the S&D or run the risk of a big discount going forward.
That would be good for farmers but manufacturers/traders do not like it.
Hence the rumor of exports occurring. We have heard multiple reports that vessels of urea have been leaving U.S. shores for global destinations. Each vessel helps to bring the S&D more into balance and as a result, has been bringing the Middle East / NOLA gap back into more historic norms.
From a farming perspective, I really do not think there is much you can do with this information on an input planning side. This is more for education/giving better idea of how the world works.
Overall demand expect to be mostly unchanged, but farmer economics will change timing
Something you are going to read over and over again thru this month's edition is that the timing of the ag market is going to change. No doubt I do not need to tell anyone reading this that grain values have fallen hard. At the same time, it seems like everyone on the supply/input side sees it, agrees that inputs need to come down...but do not think their input price should be the one to drop.
It is kind of like politics. You ask a crowd who wants change and everyone raises their hand. If you ask the same crowd who is willing to change, all the hands go down.
That has put farmers in a bad spot.
For the last few years, manufacturers/suppliers of fertilizer have enjoyed healthier farmers. While fertilizer values were high, ultimately the farmer would step forward as there was cash to spend. Need to lean into the high grain values. That has helped to make a lot of the supply side forget what it used to be like where buyers are not as willing to come forward checks in hand.
That is where we sit today. I have had conversation after conversation with folks who have talked about how farmers see the current fertilizer price and walk right back out the door. It is August. There is a lot of time until next spring. With grain prices and nitrogen prices where they are, why would anyone jump up and down to spend money? Instead, they opt to wait and hope for better days.
On the flip side, we still think demand remains largely unchanged and will eventually have to step forward. It isn't that only corn values are falling. If that was the case, then we would be thinking more bean acres and as a result, less nitrogen demand. With all markets falling, it is hard to move the acreage expectations for 2025. Farmers can cut back on phosphate. Farmers can cut back on potash. Nitrogen is not nearly as easy.
This is a lesson the market is struggling thru. This is the quietest period I can remember for years. While it is nice, the market struggles with what to do to fill the time. They know eventually that demand will come forward and in the right circumstance, could come as a huge wave but for now farmers wait...and that is putting some nervousness into the market.
Where are current values in relation to the past
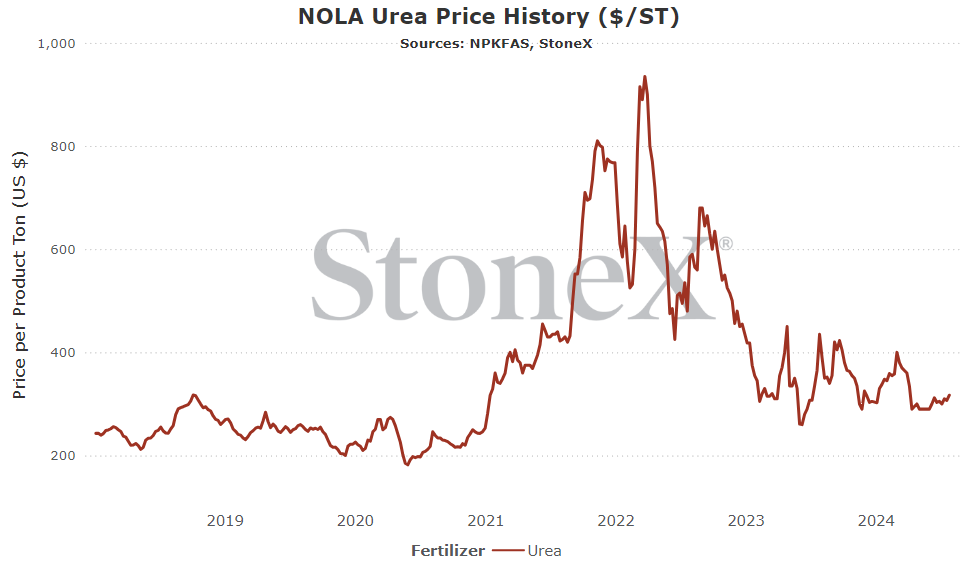
NOLA/New Orleans, Louisiana
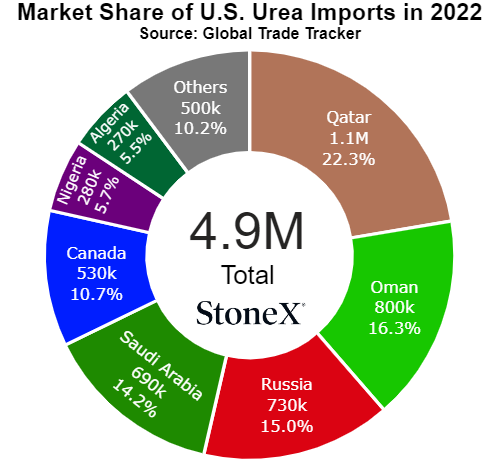
Number 3 global importer in 2022
Price comparisons
Vs 30 days ago - 4% or approximately $12 higher
Vs 90 days ago - 6% or approximately $17 higher
Vs 6 months ago - -8% or approximately $28 lower
Vs 1 year ago - -27% or approximately $118 lower
U.S. Midwest Average
Vs 30 days ago - -1% or approximately $3 lower
Vs 90 days ago - -5% or approximately $20 lower
Vs 6 months ago - -7% or approximately $29 lower
Vs 1 year ago - -23% or approximately $111 lower
U.S. Southern Plains Average
Vs 30 days ago - 1% or approximately $5 higher
Vs 90 days ago - -12% or approximately $50 lower
Vs 6 months ago - -10% or approximately $40 lower
Vs 1 year ago - -22% or approximately $105 lower
U.S. Northern Plains Average
Vs 30 days ago - -7% or approximately $26 lower
Vs 90 days ago - -10% or approximately $43 lower
Vs 6 months ago - -12% or approximately $51 lower
Vs 1 year ago - -23% or approximately $110
Middle East
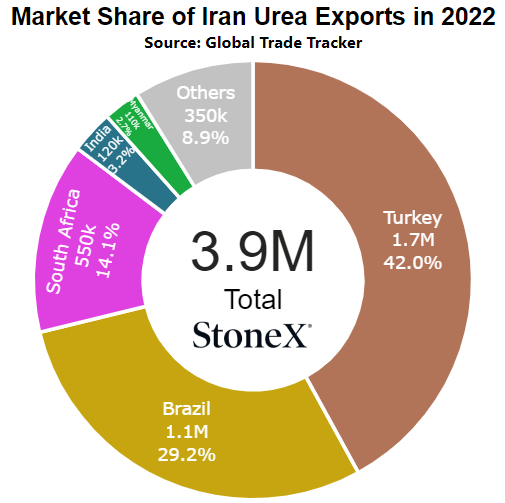
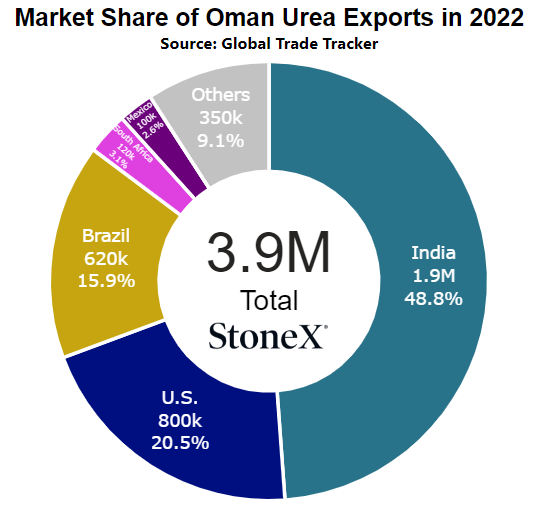
Number 1 exporter (as a region, not as individual nations)
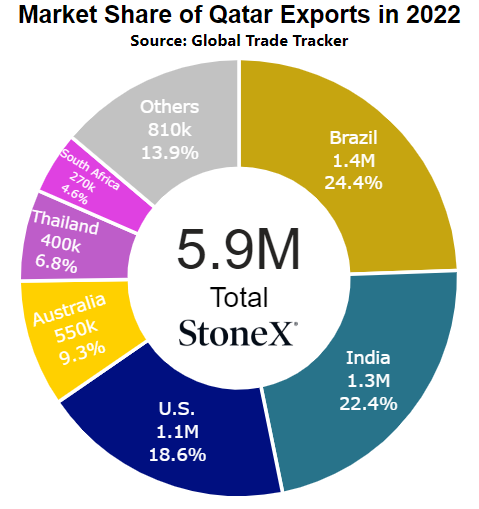
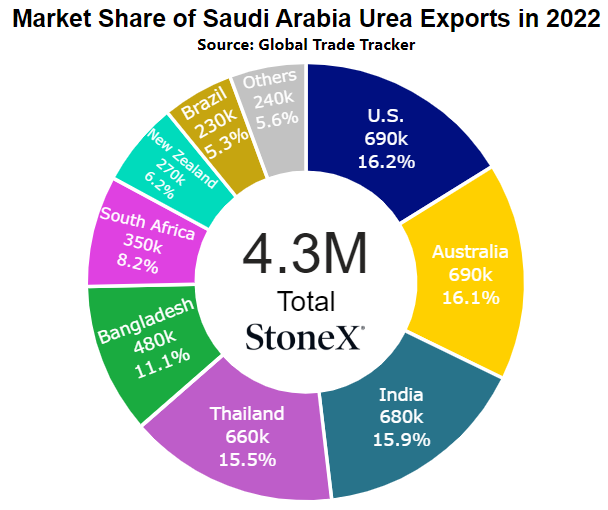
Vs 30 days ago - -1% or approximately $5 lower
Vs 90 days ago - 20% or approximately $58 higher
Vs 6 months ago - -9% or approximately $33 lower
Vs 1 year ago - -13% or approximately $53 lower