

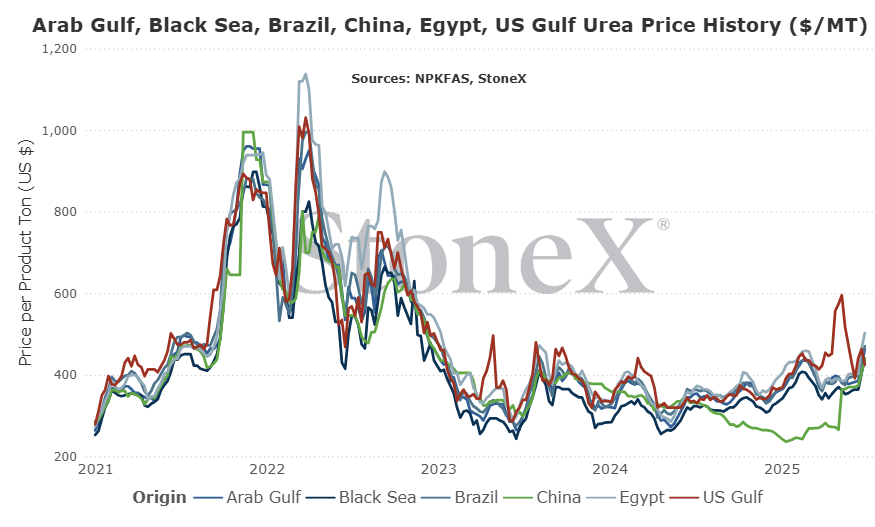
The intention of the below graphs are not to use to say "my price should be X based on this graph". These prices are derived from an FOB price point average. The intent is to show major global price movement trends. Your values will likely have significant basis difference (similar to your local grain price being different than the traded market price).
This graph is labeled as MT in USD currency.
- India tenders keep fueling the fire
- European production is still 75% of normal
- Iran/Egyptian production has struggled
- Chinese exports will still be well below normal
Why I think urea prices could fall globally:
- Sudden Russia/Ukraine peace could send the market spiraling
- China's export quota was increased from 2M to 3M tons
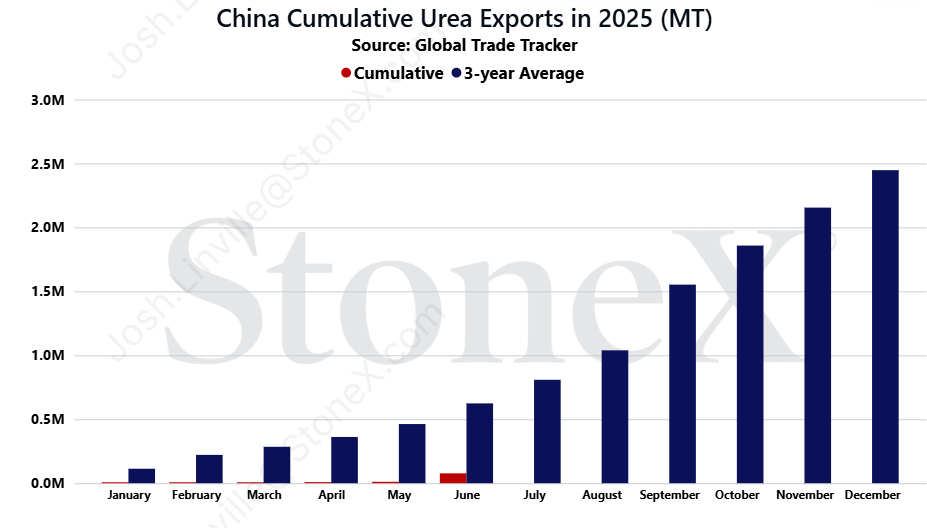
- China hasn't exported much so far, could mean a slug of product looking for homes
- The current price is extremely high vs grain values
So every market has a fundamental and emotional aspect of it. Even that seems split:
- Emotionally - the market seems to be ignorning any bearish news and is jumping at any bullish news
- Fundamentally - it feels like prices should be lower. Global values jumped huge on losing Iran/Egypt production. That only accounted for 600K tons. However, we then got 1M tons back from China. Not to mention demand will be dodgy.
I do not know what to tell you here. If I absolutely HAVE to make a guess, I think prices stay stable to higher at least until the India tender is complete. However, I cannot help but have a gut feel that there is a dip coming...I do not know when...I do not know how...
- December 19, 2024
- 1.5M ton goal
- 185K tons secured
- January 23, 2025
- 1.5M ton goal
- 559K tons secured
- March 26, 2025
- 1.5M ton goal
- 885K tons secured
- May 28, 2025
- 1.5M ton goal
- 229K tons secured
- June 24, 2025
- 2M ton goal
- 1.46M tons secured
Other than this most recent tender, India has been striking out as world suppliers saw better opportunities. However, this most recent tender was a sign of hope. Few believed they would be able to reach the 1M ton mark given the global market at that time. When everything wrapped up, they nearly reached 1.5M tons. Well short of their 2M ton goal, but significantly better than expectations. There was hope that the bigger tons meant that global supplies were better than thought and that India could wait on their next tender that could make the market quiet and as a result bearish.
Values did start to show signs of easing. It was never anything huge, but little bits of information here and there. Then India announced...
Many in the market, myself included, thought India could go several weeks before returning to buy another layer. That was not the case. On July 24th, IPL (company handling this purchase tender) announced a fresh buy attempt:
- 2M ton goal
- Offers due August 4th
- Vessels to load by September 22
Any hope of prices sliding were shot down. Quickly, international values moved higher.
The market has been acting odd recently. Normally, there is a lot of bullish talk in the market as the India tender offer date comes. The market gets "excited" with everyone inquiring everywhere about what they can buy and offer. This round has been very subdued. Other than the initial price surge, it has been very quiet.
For now, we are having to sit back and see what happens. Either way, this will help set the tone for the next month or two for global urea markets.
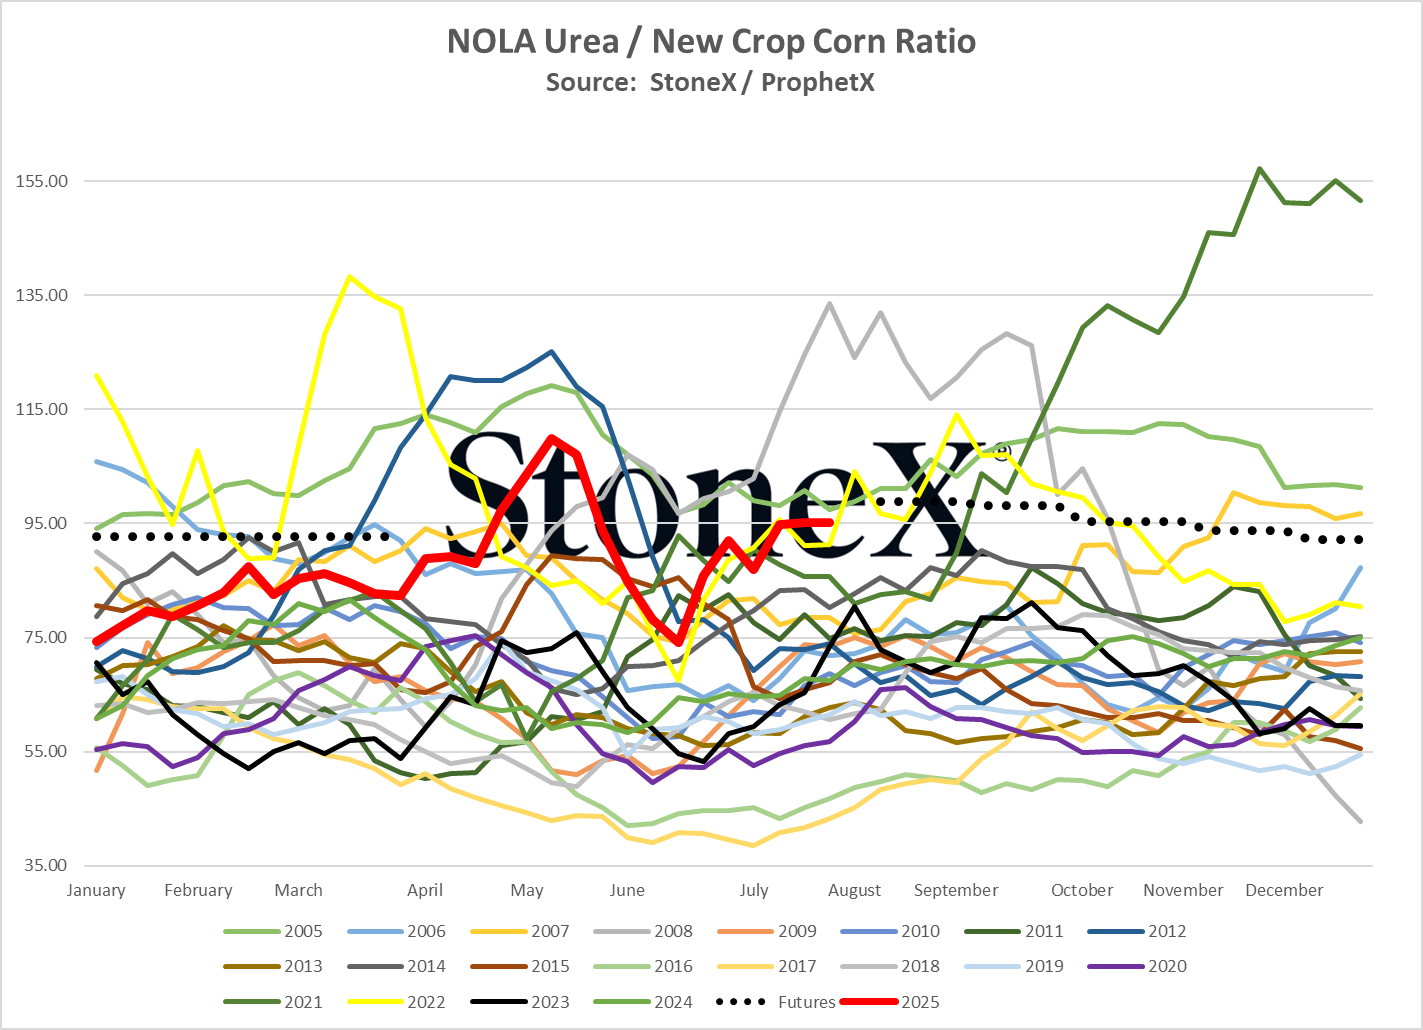
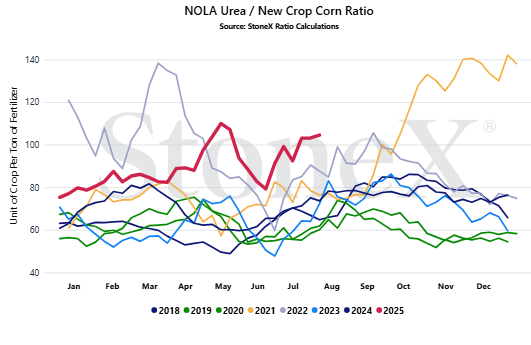
- Is $460 NOLA urea too high or low? It is way too high if corn is $3.50. It is great if corn is $8.
- Is $4.50 corn too high or low? Again, it is fantastic if urea is $250. It is horrible if urea is $700.
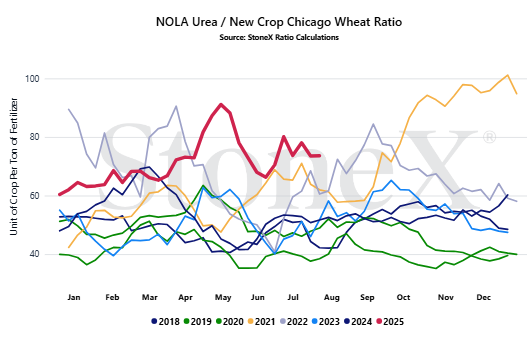
When we look at the 102 ratio on the graph below, it takes any guesswork out of the equation. It is high. Very high. Not record high. We will leave that for phosphate.
So the question that continues to be asked is what will farmers and retailers do? On the retail side, I think we will see them be much more conservative in their buying patterns. They understand everything happening in the world, but their farmer customer is struggling and is going to be slow on buying their needs. That leaves a lot of price risk with the retailer that they cannot handle. On the farmer side, why would you get excited today? The price is high, the grain price stinks, and many folks may have to go to the bank to get funding and who wants to have that conversation this far ahead of spring.
Overall, I do not think that nitrogen/urea demand will be significantly lower. We still expect a big corn crop in 2026. Farmers can reduce their P & K application rates without much impact to yield potential. However, nitrogen is needed. There is a direct correlation between nitrogen applied and potential yields. Sure, there are alternative methods but for the most part, urea will be used.
So our POV is that overall demand should remain largely unchanged. It will be the timing of demand, and that could make for an interesting market.
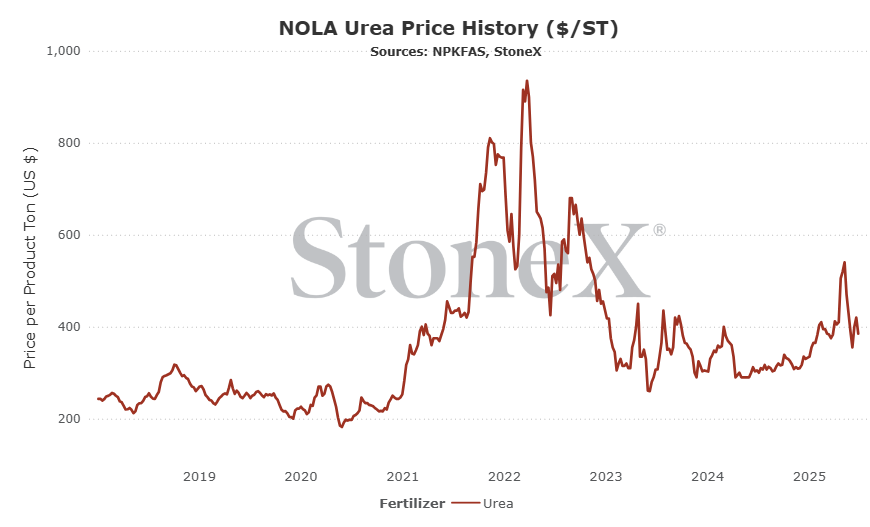
NOLA/New Orleans, Louisiana
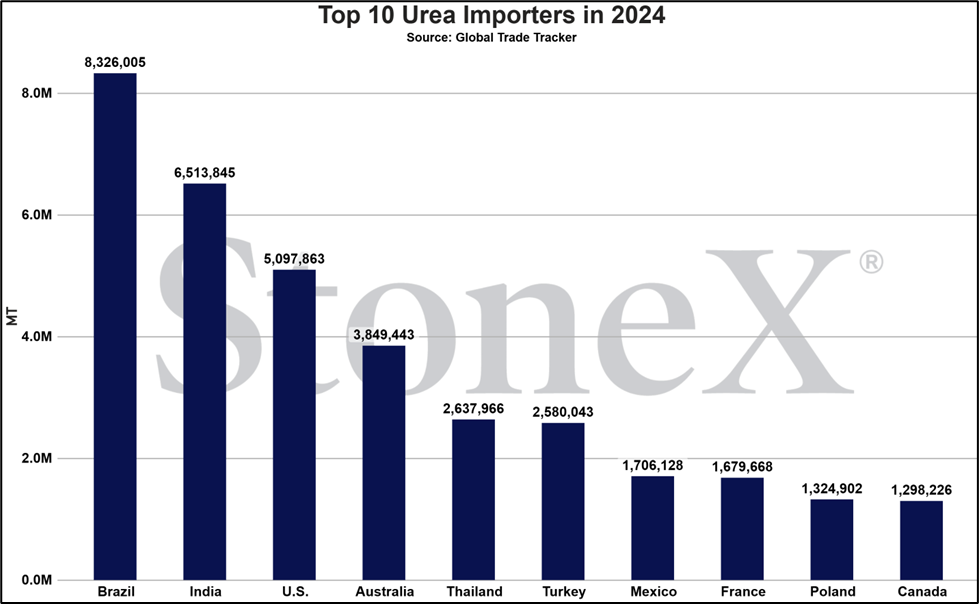
Number 3 global importer in 2022
Price comparisons
Vs 30 days ago - 18% or approximately $70 higher
Vs 90 days ago - -13% or approximately $65 lower
Vs 6 months ago - 19% or approximately $73 higher
Vs 1 year ago - 44% or approximately $138 higher
U.S. Midwest Average
Vs 30 days ago - 1% or approximately $6 higher
Vs 90 days ago - -13% or approximately $76 lower
Vs 6 months ago - 13% or approximately $59 higher
Vs 1 year ago - 35% or approximately $130 higher
U.S. Southern Plains Average
Vs 30 days ago - -2% or approximately $8 lower
Vs 90 days ago - -14% or approximately $80 lower
Vs 6 months ago - 10% or approximately $45 higher
Vs 1 year ago - 34% or approximately $125 higher
U.S. Northern Plains Average
Vs 30 days ago - -4% or approximately $22 lower
Vs 90 days ago - -12% or approximately $69 lower
Vs 6 months ago - 9% or approximately $40 higher
Vs 1 year ago - 40% or approximately $145 higher
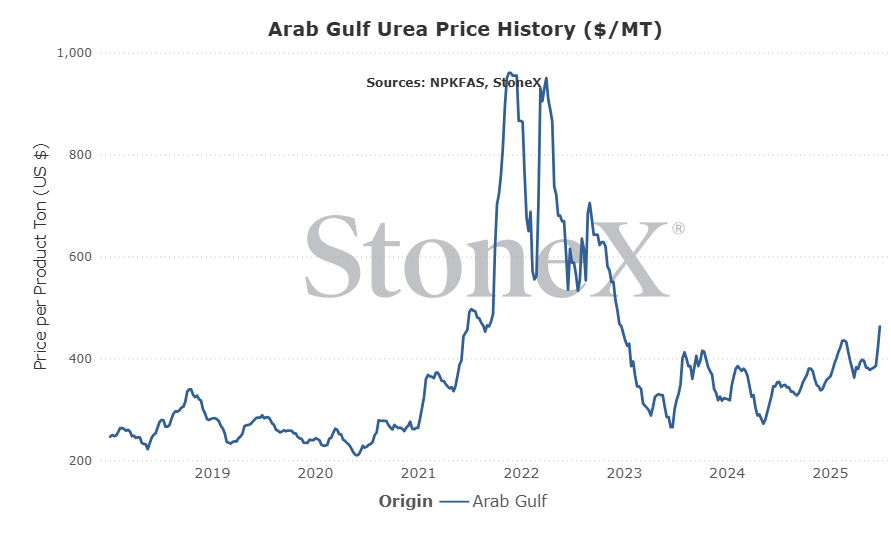
Middle East
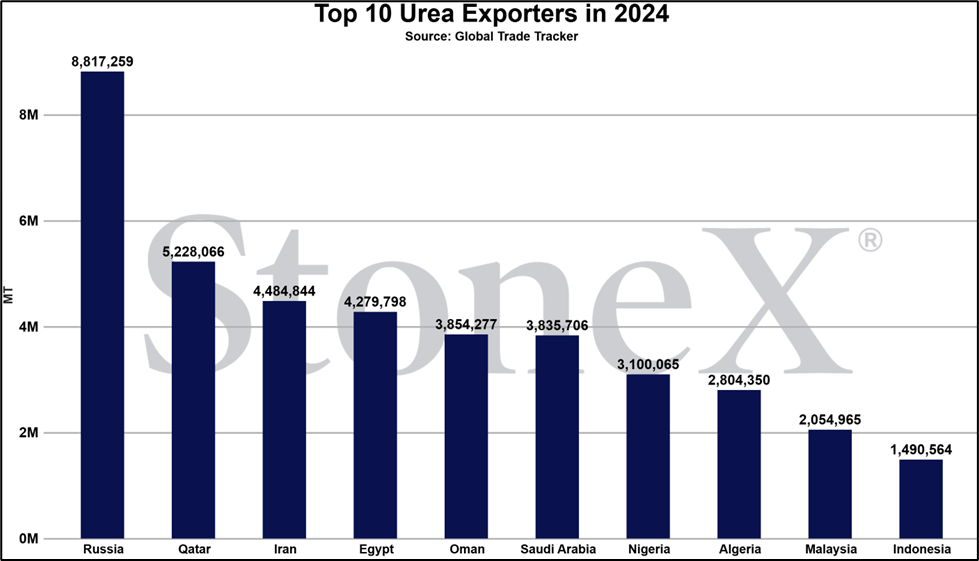
Number 1 exporter (as a region, not as individual nations)
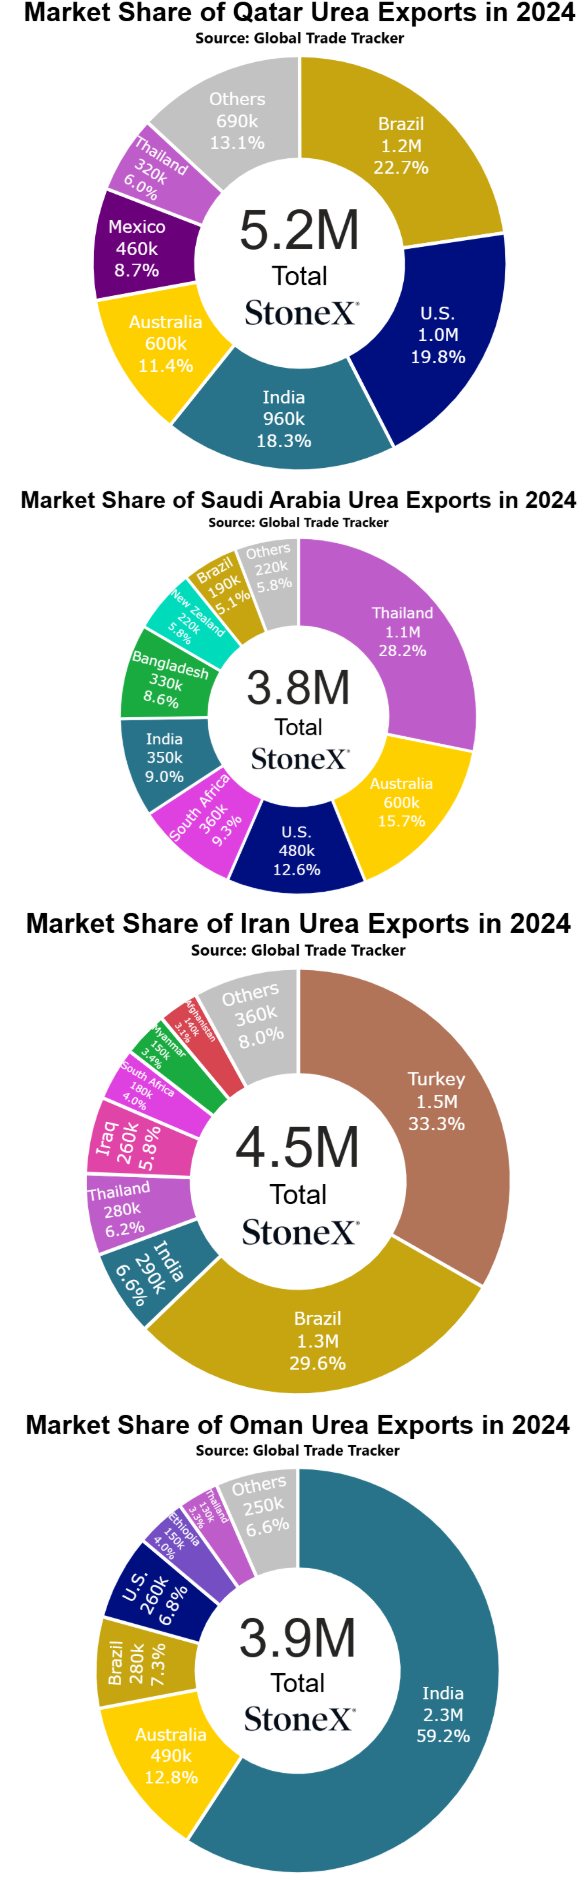
Vs 30 days ago - 3% or approximately $15 higher
Vs 90 days ago - 21% or approximately $83 higher
Vs 6 months ago - 16% or approximately $65 higher
Vs 1 year ago - 37% or approximately $130 higher
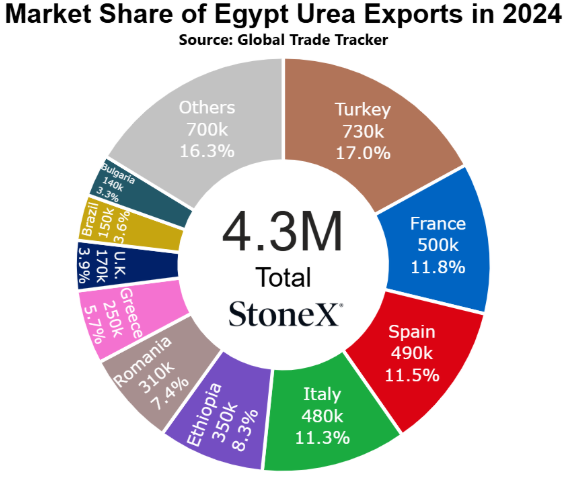
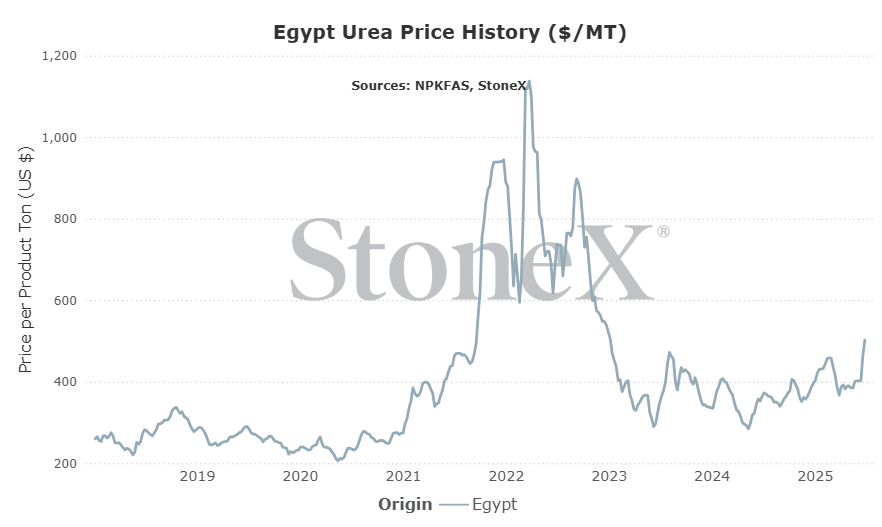
Egypt
Number 4 global exporter in 2022
Price comparisons
Vs 30 days ago - -2% or approximately $13 lower
Vs 90 days ago - 26% or approximately $100 higher
Vs 6 months ago - 13% or approximately $57 higher
Vs 1 year ago - 35% approximately $127 higher
Black Sea
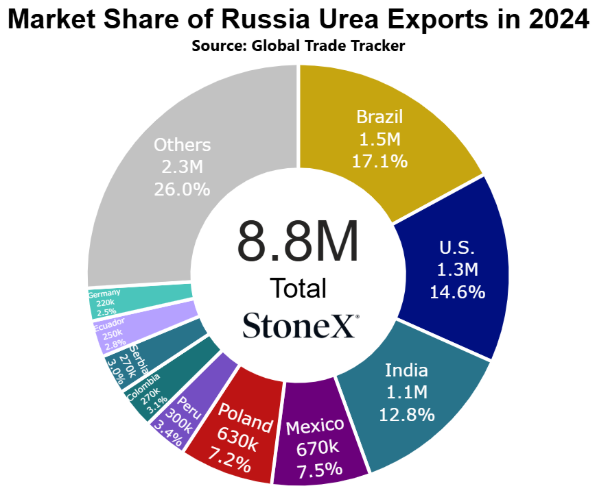
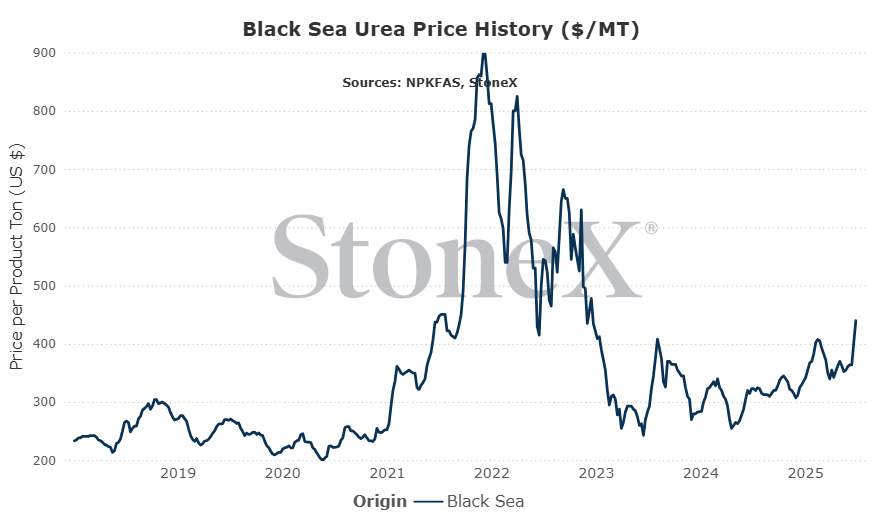
Number 1 global exporter in 2022
Price comparisons
Vs 30 days ago - -2% or approximately $10 lower
Vs 90 days ago - 16% or approximately $60 higher
Vs 6 months ago - 12% or approximately $48 higher
Vs 1 year ago - 33% or approximately $108 higher
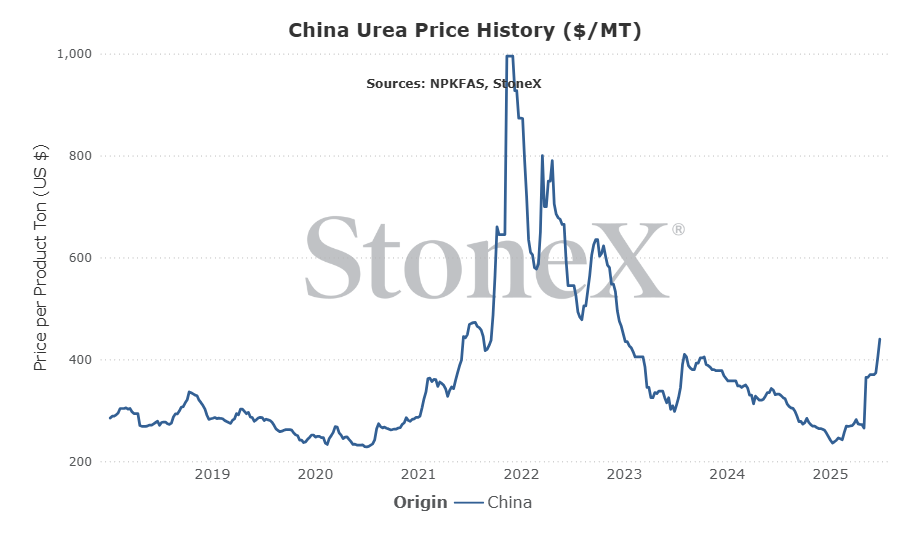
China
Number 9 global exporter in 2022
Price comparisons
Vs 30 days ago - 1% or approximately $3 higher
Vs 90 days ago - 67% or approximately $177 higher
Vs 6 months ago - 80% or approximately $197 higher
Vs 1 year ago - 37% or approximately $120 higher
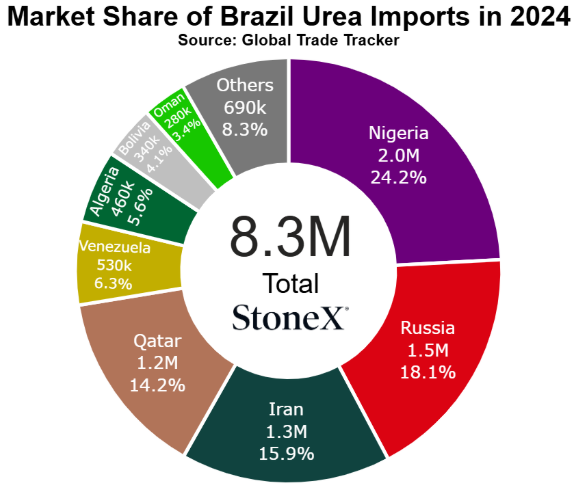
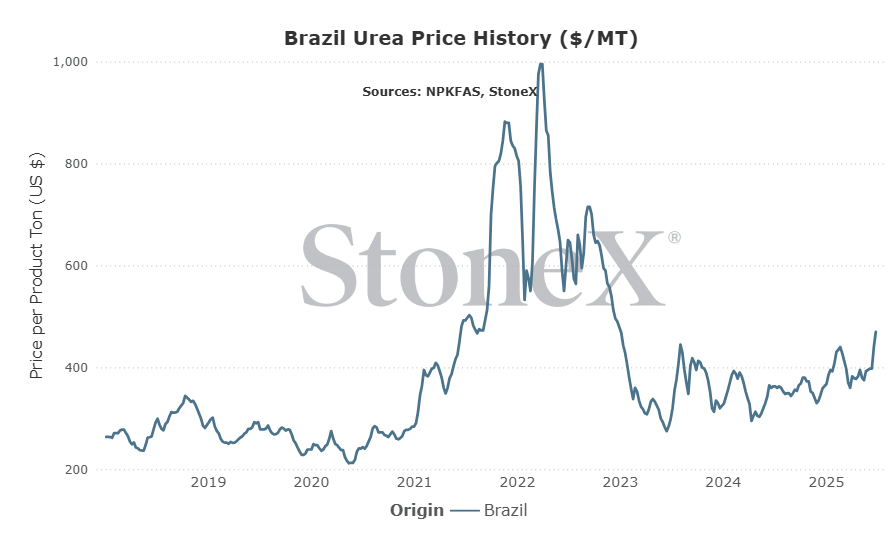
Brazil
Number 2 global importer in 2022
Price comparisons
Vs 30 days ago - -2% or approximately $8 lower
Vs 90 days ago - 17% or approximately $68 higher
Vs 6 months ago - 13% or approximately $55 higher
Vs 1 year ago - 28% or approximately $103 higher
- India tenders keep excess inventories low until demand picks up - India locked up nearly 1.5M tons on their last purchase tender. The current tender is targeting 2M tons. Even if they hit their goal, there will still be more purchases ahead. India's buying pace today is helping to remove excess product from the market. Excess product helps put pressure on manufacturers. Lack of it allows them to move prices higher.
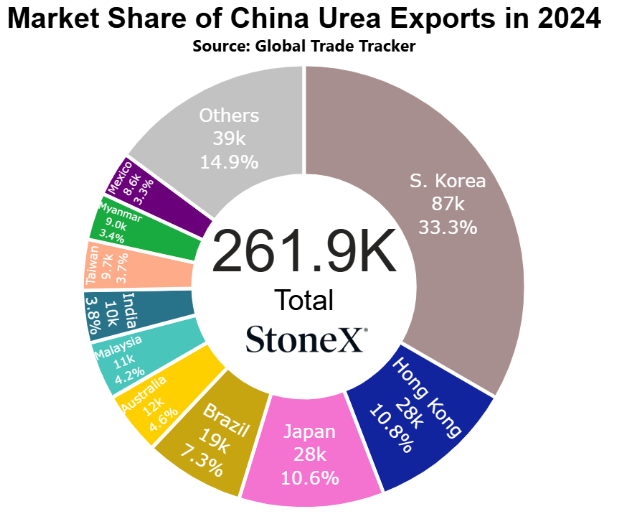
- Chinese exports get scaled back from current 3M ton goal - the current export quota for China was last heard to be 3M tons. While still well short of their normal 5 to 5.5M ton average, 3M tons would still be a massive boost from 2024's meager 262K tons. However, today's expectation is 3M tons. If that number suddenly falls back to 2M or lower, watch out.
- Further supply issues - there are a lot of supply issues that have happened in 2025. Europe is still producing at 75% of normal. Iran and Egypt have had on again/off again produciton rates. Chinese exports are down vs normal. If more additions to the list continue, global supplies get worse and prices get higher.
- Chinese flows pepper the market July through October - January through June, China has only exported 77K tons. Their 2025 quota is still believed at 3M tons. There is a strong case to be made that they will start to slow/stop exports in November/December to focus on their domestic lead up to spring. That could mean nearly 3M tons being exported between July and October. That would be a lot in a little bit of time.
- Buyers refuse higher prices - there does not seem to be a lot of excitement to buy urea at these values at this time. Most demand has until spring before they start to apply it. With farmer economics so poor, the supply side of the market may be surprised by the lack of demand. The longer that happens, the more unsold inventories grow. Right situation, that can cause sellers to drop price.
- Russia/Ukraine ceasefire leads to peace - this is a low probability situation. There is no indication that war is ending anytime soon. But the chances are not zero. If we were to wake up to the news that a peace has been found, we could see a big correction on nitrogen prices. Russian exports could resume normal flows/destinations. European natural gas prices could drop and allow nitrogen production to resume. War time premiums could be removed. China could resume normal exports with the world normalizing. Again, low probability but a person has to have hope.
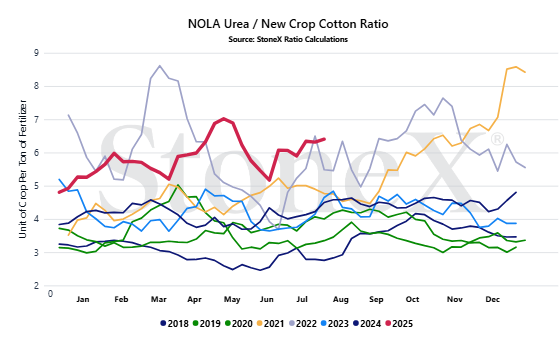
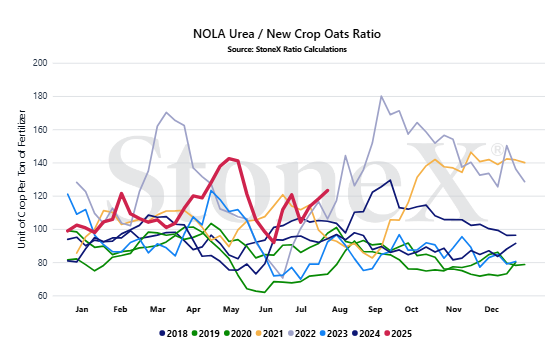
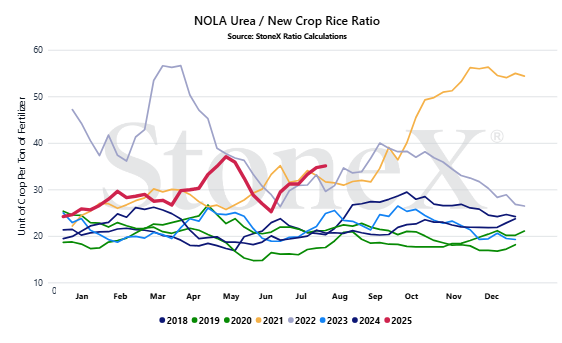
We believe that only looking at the flat price of either grains or fertilizer can be misleading:
- Only selling grain can hurt you if fertilizer prices rise substantially
- Only buying fertilizer can hurt you if grain prices fall
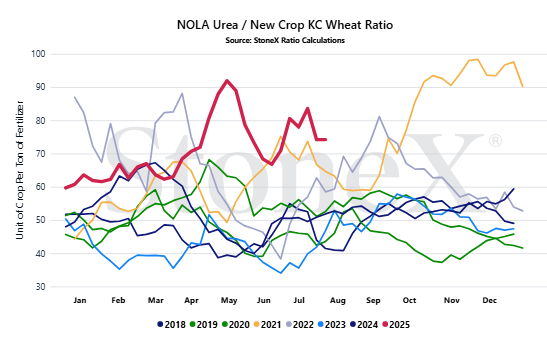
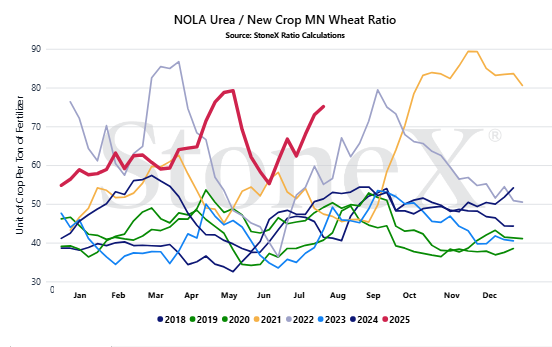
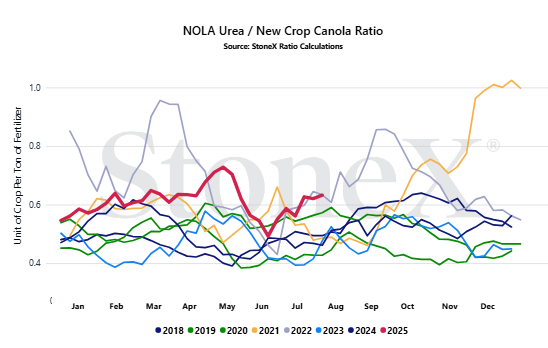
We look at the ratio "value" to get a better indication of where we are or how many bushels of X does it take to pay for 1 ton of fertilizer.
Would you rather:
- Spend 135 bushels to pay for 1 ton of urea
- Spend 55 bushels to pay for 1 ton of urea
When we compare the current ratio value against recent years, we start to see if we are high or low.
YOUR VALUES WILL LOOK DIFFERENT
This graph looks at the NOLA urea price vs the flat grain price. There are no logistics on either product. Your location will look different due to fertilizer logistical costs, grain basis, etc.
- Global reaction to India's "surprise" purchase tender - to start, India announcing their purchase tender was not a reaction. Everyone knew that another one was coming, even after locking up near 1.5M tons last round. However, it is how quickly they announced it that took everyone off guard. They are looking for another 2M tons. The shipment window covers most of September. Will offers stay bold and push the price ideas higher? Will this be the one that sees the market cut price to ensure sales? With India looking for 2M tons, do offers need to lowball to guarantee a chance to sell? Couple weeks will tell the story.
- How Chinese exports act in the market - China could make for a very unique market. On the one hand, we could see the global urea market "tight" with India continuing to soak up excess product. On the other hand, there is still 3M tons to be exported from China that is not allowed to flow to India. We could see the world tight "normal" supplies but loose Chinese supplies. Could make for some interesting conversations.
- Russia/Ukraine war conflict - as long as the war between Russia and Ukraine rages, the world will be on edge and markets will factor in fear from war time premiums. However, a ceasefire between these countries could be the lynchpin that allows prices to correct lower. It seems pretty low probability today, but the war cannot last forever. If peace is found, it could return normal global trade flows, return Russian gas flows to Europe, lower European gas markets, return European nitrogen production, and could end with Chinese exports resuming normal as they see the world market "fixed". That is a lot of dominos to fall, but watch for the first one.
- Farmer/retailer reaction to high prices - how does one justify buying these types of prices in early August? Unfortunately, there may not be another choice as values continue to shoot higher. Given all the global situations in the market today, all news seems to be bad news and leads to higher prices. However, farmers and retailers still have power. The market believes that purchases need made by certain timeframes. For things like the looming wheat run, this is true. Time is running out and logistics are going to get harder/more expensive in the coming weeks/months. However, for spring buyers, there is a lot of time. There is no guarantee of year end prepays. There is no guarantee of year beginning prepays. The market could wait until the last minute...that would be hard on the system but in this situation, few care.
StoneX Ratio Calculation
The ratio calculation is derived from Bloomberg historical grains values as well as fertilizer values from StoneX, NPKFAS, and Argus.
The calculation is simply dividing the fertilizer price by each grain price.
All data was sourced from StoneX unless otherwise noted.




