As the back and forth in US-Iran conflict headlines continues and scheduled event risk lines up to register the impact, it is worth asking: what is the prevailing trend of risk appetite benchmarks like the S&P 500?
Talking Points:
Risk appetite is as on unclear a footing as it has been in a year – which we are currently traversing the anniversary of the Liberation Day tariff swoon
The US-Iran conflict has crossed a full month’s duration and prediction – as well as traditional – markets remain skeptical of a quick and fruitful end
Thematic concerns remain a principal guide to market sentiment, but scheduled event risk will give further context: such as ISM data, US inflation and global inflation readings
Watch the Full Video
A Long-Term Bull and Medium-Term Bear
Determining the bearing of a given market requires setting certain criteria around time frame and progress. When we are trying to assess the systemic sentiment behind the entire financial system, the complications compound like a Swiss watch. However, risk appetite – when sufficiently engaged – generally prevails as the predominant force in the markets; so it is essential to keep tabs on its evolution. It has been more than five weeks since various benchmarks of ‘risk’ (US equity indices, global stock measures, emerging market measures, junk bond ETFs, etc) have set new cycle or record highs. Over that same time frame, the fundamental backdrop has grown more threatening between the protracted US-Iran conflict, a rebound in inflation expectations, slide in employment and growth readings and unaccommodating shift in monetary policy rhetoric.
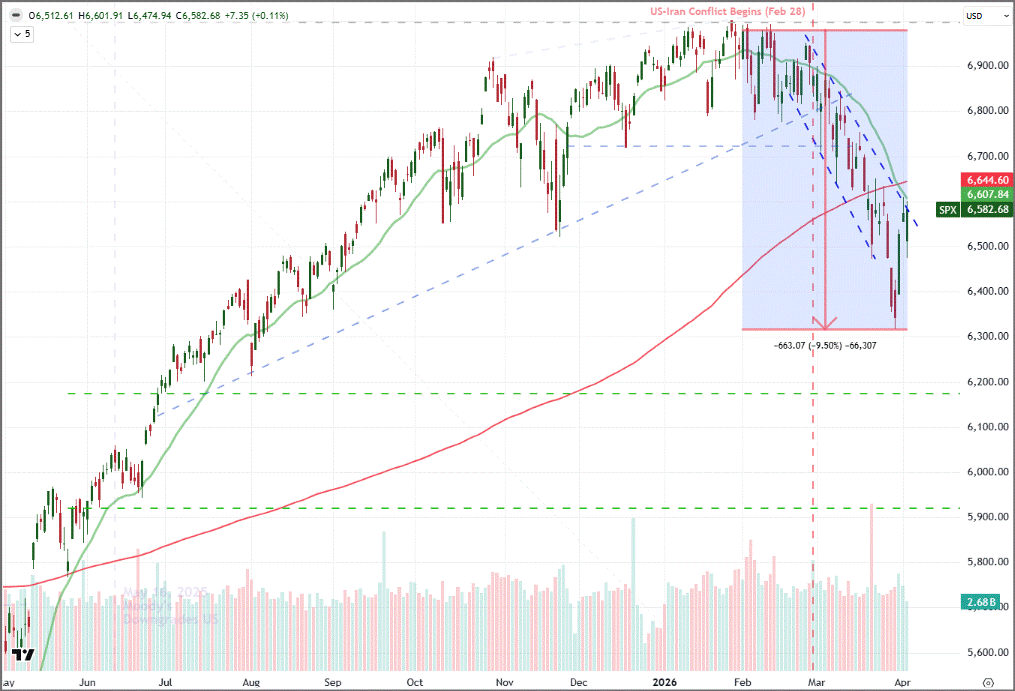
The evidence is gathering for a more ‘bearish’ compass setting. Yet, where a benchmark like the S&P 500 has registered five weeks retreat (a trend broken this past week), a slip below the 200-day moving average and established the 20-day moving average as descending resistance; we still haven’t seen the index hit a ‘technical correction’ (a 10 percent drop from the cycle high close) and its close last week leaves the index 30 percent above its standing a year ago.
Chart of S&P 500 with 20-Day, 200-Day Moving Averages (Daily) Source: TradingView.com; John Kicklighter
Time frame matters in establishing our evaluation of a ‘risk on / risk off’, ‘bullish / bearish’ or ‘rising / falling’ market – different terms for the same critical assessment. If we were to restrict our time frame just to just the past week, the perspective would likely be bullish with a 3.4 percent rally punctuated by the biggest daily rally in 10 months. That is sort of time frame a short-term, self-directed trader would reference with a horizon for an equivalent outlook. If we were to step it up to a three-month look back – a period preferred by ‘swing traders’ with tactical time objectives for positioning lasting for just a few weeks at a time – the picture is arguably bearish.
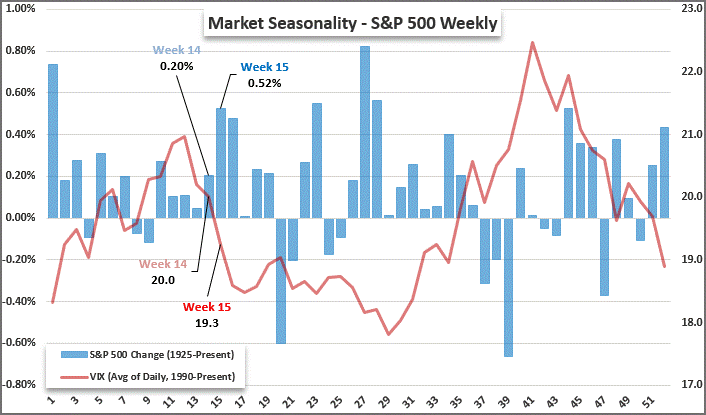
Over the span of a year or longer, the swoon during the Middle East conflict could be likened to a mere correction in a dominant bull trend that has unfolded since November 2022. Have fundamentals hit their nadir and markets tipped the scales to tempting discount in a mere six weeks and less than 10 percent retreat or is there more to this phase? Seasonality norms for week 15 of the calendar year and the month of April suggest favorable conditions lie ahead, but our troubled structural backdrop likely pulls us further off those averages.
Seasonal S&P 500 Performance and Volatility Per Calendar Week Source: John Kicklighter
The Middle East War Drags On and Markets Are Skeptical of an Impending End
While there are multiple systemic forces that bode poorly for the buy-and-hold crowd, the US-Iran conflict remains the most prone to headline volatility and opaque when it comes to proper discounting. This past week, the war over the global narrative continued to register dramatic swings between improved relations and dramatic escalation. Once again, President Trump remarked that Iranian officials were seeking a ceasefire and negotiations, while the leadership on the other side of the confrontation rebut with Iran’s Speaker of the Parliament even insinuating the US administration was manipulating the narrative for financial purposes.
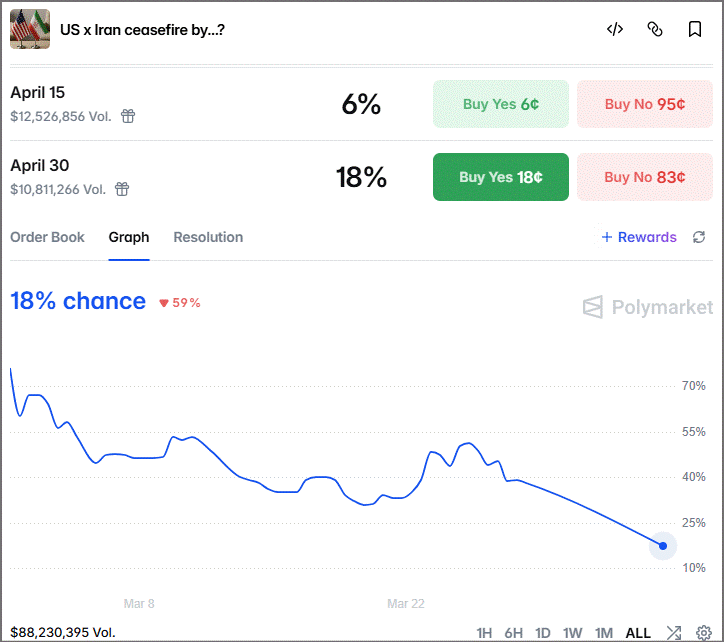
Ultimately, Iran’s closure of the Strait of Hormuz represents a tangible economic throttle and the ongoing military actions putting the armistice further out of reach. Prediction markets put a ceasefire by the end of this month at a very low probability. Next step is to see whether Trump follows through on threats of escalation at the end of a 48 hour timeline (Monday shortly after the US open if precise) if Iran doesn’t reopen the strait.
Chart of Probability US and Iran Will Reach a Ceasefire (Daily) Source: Polymarkets
An end to the military engagement is of primary concern for geopolitical, humanitarian and global prosperity reasons; but for markets, the longer this situation continues, the greater the carry over effect on the global economy. As we move into April, the number of updates expected from major economies’ critical segments for the month of March will increase sharply. That means actual spending, investing, inflation and other important readings will show the tangible effects of higher oil prices and the prevailing sense of uncertainty – not just the sentiment and forecast measures.
Even if the war were to end this week, there are still shocks that will work their way through the system and scenarios such as Iran seizing a troubling unilateral control over the critical oil Middle Eastern energy pass. The White House faces a very difficult path forward as the perspective of a swift victory dwindles rapidly, its global peers seem unwilling to fully commit to the conflict and an extended timeline threatens deeper economic pain.
Chart of US Oil Price, US PCE Deflator, US Consumer Confidence – UofM (Monthly) Source: TradingView.com; CME; US BEA; University of Michigan; John Kicklighter
Seasonal Liquidity, Headline Risk and Important Data
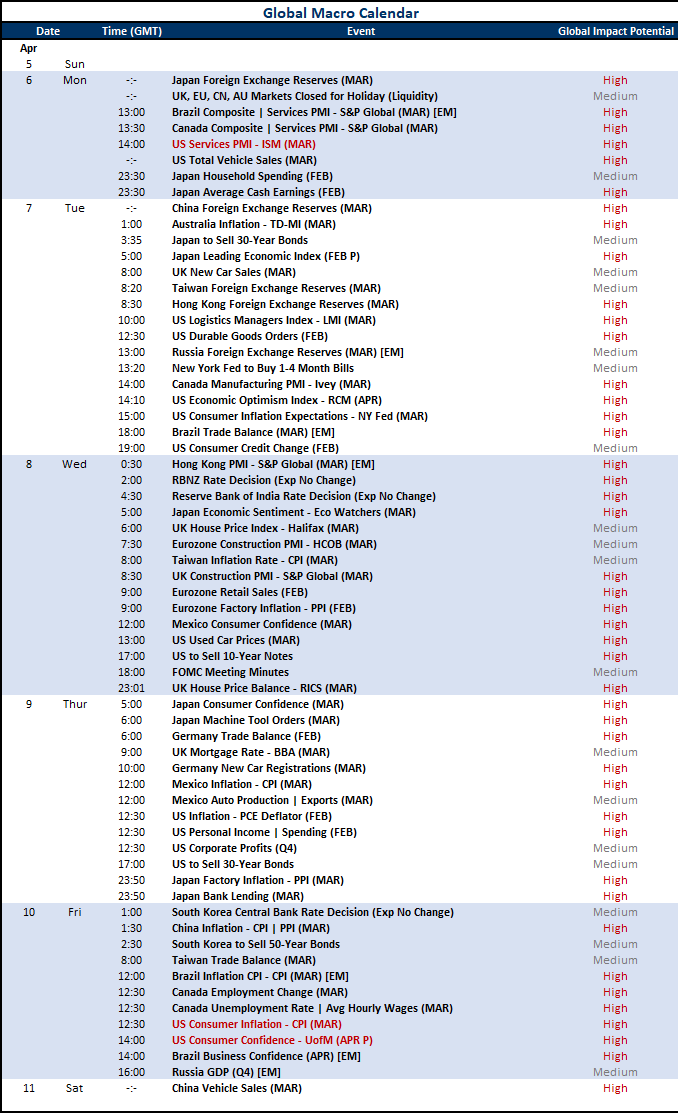
Looking out over the coming week’s economic calendar, we are presented with some significant challenges. We’ve already covered the threat of unexpected headlines delivering a sudden jolt to the markets, but that is further complicated by the expected dip in liquidity. The markets were fairly sanguine about the upside surprise in headline NFPs released on Friday, abiding the closure of a portion of the global financial markets for the Good Friday holiday. The US and some other markets will reopen for trade Monday, but a large swath of global hubs will still be off. If we have another weekend headline or Monday surprise – not unlikely with Trump’s stated deadline – then a thinned market could amplify volatility rather than quell it. Meanwhile, the listings on the docket will dig into the tangible effects of the war on economic activity and capital flows since the US and Israel first attacked on February 28th.
Calendar of Top Global Macro Event Risk Source: John Kicklighter
A US Growth Update that Will Precede the Official Q1 GDP Release by Weeks
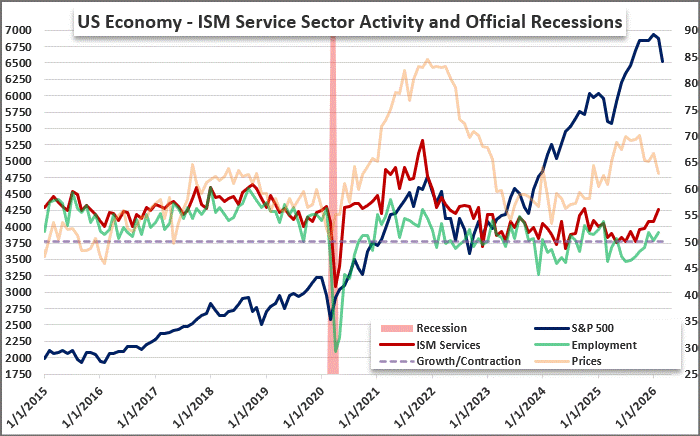
Looking day-by-day through the calendar, there are a range of themes and countries that will issue important fundamental updates, but the first one of serious heft on my list will be the ISM services (non-manufacturing) index due Monday. Consider the world’s largest economy is powered disproportionately (three quarters of GDP) by service sector output and employment is similarly balanced, this is a particularly useful reflection on growth weeks before the official Q1 GDP reading is released. Through February, the headline reading was improvement along with the labor component while the prices gauge was starting to ease back from the tariff swell. If the manufacturing counterpart is any guide, those trends will turn – and the consequences will be more profound for the United States overall.
Chart of ISM Non-Manufacturing PMI and Components with S&P 500 (Monthly) Source: ISM; Standard & Poor’s; John Kicklighter
A Run of US Inflation Readings
If you missed it this past week, the US Bureau of Labor Statistics released its March employment report to an upside surprise – at least for the headline figures most market participants track. American businesses added a net 178,000 jobs to the economy, far outstripping the 50,000 expected; while the unemployment rate ticked down to 4.3 percent. While that is a good outcome on the face of it, there are some serious issues that follow the update. The general trend in the labor stats has been trending lower and threatens to flip its 6-month average negative. Further, negative revisions have been troublingly consistent and there is a very heavy concentration of the job growth in healthcare while other industries actually contract.
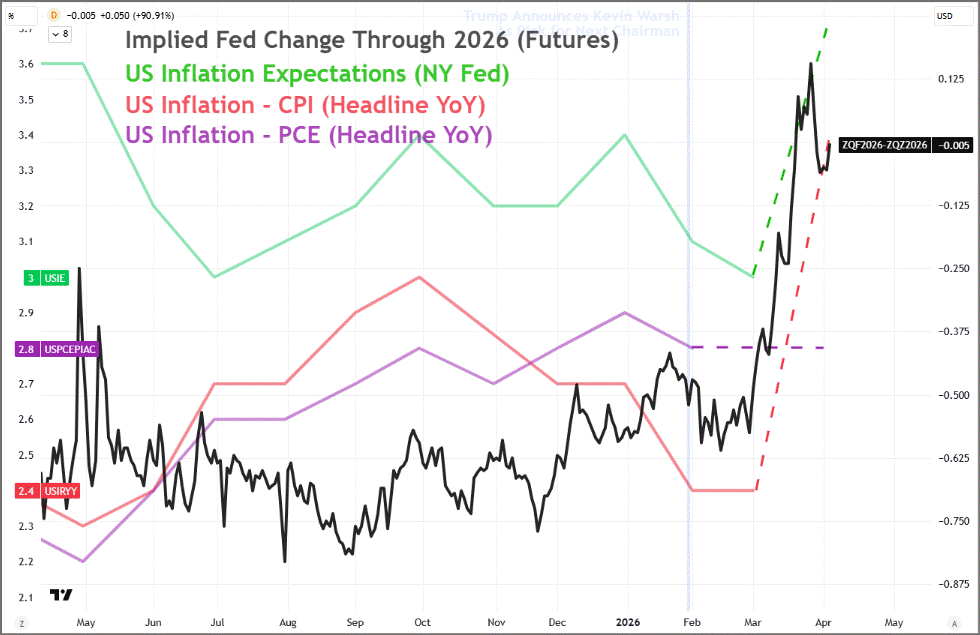
Perhaps the biggest burden from this data is that it could take pressure off the Fed to respond to economic risk from the Middle East conflict to in turn focus on more pressing inflation risks. How prominent are those risks, we will see a fairly thorough picture of that threat this week. In addition to the ISM service sector measure’s price gauge for March, we are also due the New York Fed’s Consumer Inflation Expectations reading (a forward looking read), the Fed’s favorite PCE deflator reading and the market’s preferred CPI update. Energy prices are impossible to ignore for headline readings; but if the pass through to ‘core’ readings (that strip out energy and food) is tangible, central banker concern will escalate quickly.
Chart of Implied Fed Change Through 2026 Overlaid with US Inflation Measures (Daily) Source: NY Fed; US BLS; US BEA; John Kicklighter
A Global Inflation Threat
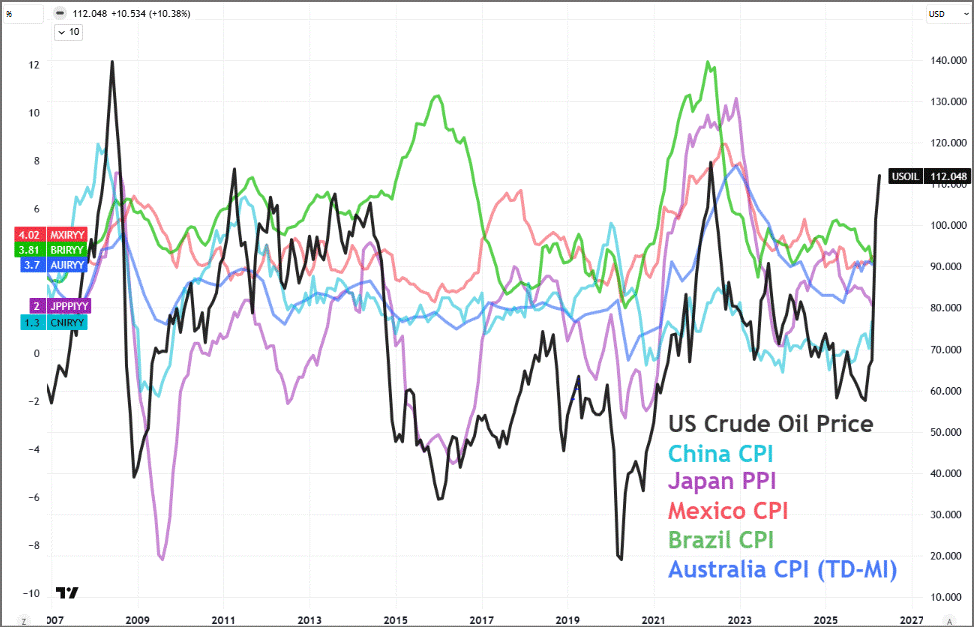
Though much of the focus for the week’s economic calendar will be centered on the US listings and its markets’ response to the data, there is meaningful wave of updates due from other key economies. Data themes like sentiment surveys and national FX reserve changes are important to take in for the big picture; but like the US, the inflation consideration should take priority for the global read. There are March inflation updates due for: China (CPI and PPI); Japan (PPI); Mexico; Taiwan; Australia; Mexico and Brazil. The impact of higher energy prices is uniformly significant for all of these major economies and given the restriction is through the Strait of Hormuz, BRICS members like China and Brazil won’t be as capable of weathering the issue. Generally rising global inflation is a far more pernicious problem than just pressure for a certain group of nations.
Chart of US Crude Oil and Major Economy Annual Inflation Readings (Monthly) Source: TradingView.com; CME; National Stats Bureaus; TD-MI; John Kicklighter
Access More Global Macro Insights, Forecasts and Tools
Stay connected to timely global macro analysis designed to help market participants navigate shifting economic conditions and evolving risk. Gain access to regular market commentary, updated quarterly forecasts, a comprehensive two-week forward economic event calendar, and specialized tools built to support informed trading and risk management decisions.
The subsidiaries of StoneX Group Inc. provide financial products and services, including, but not limited to, physical commodities, securities, clearing, global payments, risk management, asset management, foreign exchange, and exchange-traded and over-the-counter derivatives. These financial products and services are offered in accordance with the applicable laws in the jurisdictions in which they are provided and are subject to specific terms, conditions, and restrictions contained in the terms of business applicable to each such offering. Not all products and services are available in all countries. The products and services offered by the StoneX Group of companies involve risk of loss and may not be suitable for all investors. Full Disclaimer. This content is not intended for residents of any particular country, and the information herein is not advice nor a recommendation to trade nor does it constitute an offer or solicitation to buy or sell any financial product or service, by any person or entity in any jurisdiction or country where such distribution or use would be contrary to local law or regulation. Please refer to the Regulatory Disclosure section for entity-specific disclosures. No part of this material may be copied, photocopied or duplicated in any form by any means or redistributed without the prior written consent of StoneX Group Inc. The information herein is provided for informational purposes only. This information is provided on an ‘as-is’ basis and may contain statements and opinions of the StoneX Group of companies as well as excerpts and/or information from public sources and third parties and no warranty, whether express or implied, is given as to its completeness or accuracy. Each company within the StoneX Group of companies (on its own behalf and on behalf of its directors, employees and agents) disclaims any and all liability as well as any third-party claim that may arise from the accuracy and/or completeness of the information detailed herein, as well as the use of or reliance on this information by the recipient, any member of its group or any third party.
Our market expertise, advanced platforms, global reach, culture of full transparency and commitment to our clients’ success all set us apart in the financial marketplace.
Reach
With access to 40+ derivatives exchanges, 180+ foreign exchange markets, nearly every global securities marketplace and numerous bi-lateral liquidity venues, StoneX’s digital network and deep relationships can take clients anywhere they want to go.
Transparency
As a publicly traded company meeting the highest standards of regulatory compliance in the markets we serve; our financials and record of accomplishment are matters of public record. StoneX’s commitment to “doing the right thing over the easy thing” sets us apart in the industry and helps us build respect, client trust and new partnerships.
Expertise
From our proprietary Market Intelligence platform, to “boots on the ground” expertise from award-winning traders and professionals, we connect our clients directly to actionable insights they can use to make more informed decisions and achieve their goals in the global markets.