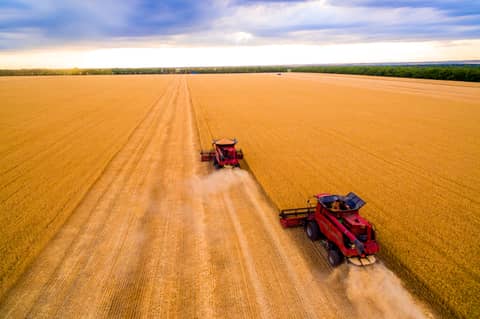
Argentina’s soybean harvest is effectively complete at 99% nationally as of June 25, 2026, matching last week, last year, and just fractionally trailing the 5‑year average of 100%, with key provinces like Buenos Aires, Córdoba, Entre Ríos, La Pampa and Santa Fe all at 99–100% harvested. Meanwhile, corn harvest progress stands at 60% nationally, only two points ahead of last week and running behind both last year (64%) and the 5‑year average (64%), with notable regional divergence: progress is modest in Buenos Aires (67%) and Córdoba (65%), very advanced in Entre Ríos (99%), and still sluggish in La Pampa (19%), while Santa Fe is relatively advanced at 82%, underscoring that soybeans are no longer a timing variable while corn remains meaningfully behind its typical pace and last year’s progress.
The USDA Hogs and Pigs report was supportive for lean hogs because supplies came in below trade expectations across most major categories. All hogs and pigs were 100.0% of last year, versus the average estimate of 100.9%, while market hogs were 100.1% versus expectations of 101.1%. The weight breakdown was also lighter than expected, especially the 50-119 lb category at 99.5% versus 101.0% expected, pointing to tighter forward supplies. The breeding herd was 98.8% of last year, below the 99.3% estimate, and farrowing intentions were mostly lower, with Jun-Aug at 97.8% versus 98.6% expected. Overall, the report leans bullish because it shows less herd expansion than the market was expecting, with tighter supply risk extending into late summer and fall.
According to the WSJ/Bloomberg report, Iran’s Revolutionary Guard allegedly attacked a Singapore-flagged cargo ship in the Strait of Hormuz, damaging the ship’s bridge but causing no casualties. The key market takeaway is that this directly tests the recently announced 60-day deal to reopen the Strait and restore safe commercial passage. For energy and commodity markets, this keeps geopolitical risk premium alive even if the waterway is technically open, because one attack can quickly raise concerns over insurance costs, vessel routing, shipping delays, and oil flow reliability through one of the world’s most important chokepoints.
The European Commission trimmed its 2026-27 EU corn production forecast to 59.9 million tons, down 0.5% from 60.2 million tons last year. The bigger issue is acreage: EU corn area is estimated at 8.2 million hectares, down 3.3% year over year and 3.9% below the five-year average, with France expected to see both acreage and production fall more than 10% below the five-year average. Total EU grain production was also cut to 273.7 million tons, down 5.6% year over year. Market takeaway: this is supportive for European corn values and adds to the weather-risk story, especially with heat concerns in France, but for CBOT corn it is more of a secondary supportive factor behind U.S. weather, USDA acreage/stocks, and export demand.
Ares is limiting withdrawals from its $22.6 billion Ares Strategic Income Fund after redemption requests rose to 14.4%. Investors will only be allowed to take out 5% of their shares this quarter, meaning demand for cash is well above what the fund is willing or able to meet immediately. The key market takeaway is that private credit is facing more liquidity pressure as investors try to exit, similar to the recent Apollo headline. This does not mean the fund is failing, but it highlights the mismatch between private credit assets, which are harder to sell quickly, and investor demand for cash. Ares says the remaining second-quarter redemption requests could be mostly satisfied by year-end if future withdrawal demand returns closer to prior levels.
The Bloomberg Commodity Index has now filled the gap left from March, which is an important technical milestone. A gap fill often means the market has completed a prior unfinished move, so the next question is whether commodities can hold this area and build a base or whether the rally loses momentum now that the upside target has been met. For ag markets, this is a mildly supportive macro signal because broader commodity participation helps risk appetite, but it is not enough by itself to turn corn or soybeans higher without help from weather, export demand, biofuel margins, or fund short-covering.
This morning’s U.S. data was mixed but generally firm: weekly jobless claims fell to 215,000 versus 225,000 expected, while continuing claims rose to 1.821 million; May core PCE rose 0.3% m/m, matching expectations, with personal income up 0.7% versus 0.4% expected and spending up 0.7% versus 0.6% expected; durable goods orders fell 4.5%, slightly better than the -5.0% estimate, while ex-transport orders rose 1.3% and core capital goods orders rose 1.6%. Overall, the numbers show a consumer and labor market that are still holding up, inflation that is not cooling fast enough to give the Fed much urgency, and business investment details that were better than the headline. The market takeaway is modestly supportive for the dollar and Treasury yields, and slightly negative for commodities from a macro standpoint, though ag markets will still be driven mainly by weather, exports, and crop conditions.
U.S. grain export sales were broadly supportive this week, led by strong performances in corn and soybeans. Corn posted total sales of 1.479 million metric tons, with healthy demand for both old- and new-crop supplies, signaling that buyers continue to secure coverage well into the next marketing year. Soybean sales were also impressive at 1.358 million metric tons, driven by strong new-crop commitments, which provides a positive signal for demand heading into the 2026 harvest. Wheat export sales of just over 504,000 metric tons reflected steady demand but were less of a market mover than corn or soybeans. On the product side, soymeal sales were moderate, while soyoil exports remained very weak, highlighting that demand strength continues to be concentrated in whole grains rather than processed products. Overall, the report is supportive for corn and soybeans, modestly positive for wheat, and less encouraging for the soy products complex.
Corn
B 15,000 u 450/480 cs 4 ½ to 5 3/8
B 300 h 510/540 cs 4 ½
B 1000 sd u 460 c vs s 1000 sd q 450 c ½ db
B 1000 z 460 c 16 ½ to 17 ¾
B 500 u 415 p 14 5/8
B 1000 w2 new crop 430 p vs s 1000 w2 new crop 410 p 3 ¼ db
B 1000 u 460 c 5 3/8 to 5 3/4
S 600 z27 490 c 28 5/8 vs 467 3/4
S 400 u 450/420 ps 21
B 1000 w1 new crop 430/420 ps 2 7/8 to 3
B 100 z 445/470 cs vs s 400 p paying even
B 250 z 460 c 15 3/4
B 700 q 400/380 ps 4 1/2
S 1000 z 500 c 7 ¼ to 7
B 500 q 450 c 4 3/8
B 1000 q 420/425 cs 2
B 1300 q 450 c vs s 650 u 460 c 2 5/8 db vs 417
B 200 u 350 p 5/8
B 1500 z 525 c 4 7/8
B 500 u 420/425 cs 2
S 2000 u 420 p 18 7/8 to 18 1/2
B 500 q 440/460 cs 2 7/8
B 2000 u 430/450 cs 4 3/4
Beans
S 500 u 1140 c 29 vs 1136
S 150 x 1150 straddles 86 3/8
S 1000 x 1120 p vs b x 1130/1140 cs 11 5/8 cr vs 1129 1/2
S 500 x 1100 p 11 ½ to 11 1/4
B 1000 u 1250 c vs 1136 ½ against s 1000 q 1080 p vs 1132 ¼ paying 1 7/8 to 2
B 350 x 1210 c 21 1/2
B 500 v 1200/1300 cs 14 1/2
B 750 x 1350 c 4 1/2
B 250 u 1070 p 5 5/8
On a block
S 1200 x 1080p/1160c strangles 48 3/4
Soymeal
B 800 z 300p/315c strangles 22.65
S 1000 z 300 p 11.25
B 150 q 295 p 2.50 vs 304.2
B 250 q 310/320 cs 2.05 to 2.15
B 200 q 305/300 ps 2.45
B 200 q 315 c 3.10
Bean oil
S 200 u 64 p .980
B 1500 u 75 c .750 to .760
B 500 z 70/78 cs 1.635 to 1.685
B 1000 z 75 c 1.119 to 1.530
B 200 v 64 p 2.000
Wheat
B 100 h 440 p 3/4
B 400 u 580 p 15 5/8 to 16 3/4
Kc wheat
B 100 690/780 cs vs s 590 p 1 db
B 200 q 620 p 16 5/8
B 400 u 650/700 cs 10
Hogs
Sold 150 July 95 calls @ .30 down to .25
Sold 400 April 72/92 strangle @ 3.675
Bought 600 Oct 86/90 calls spreads paid .825 up to .925
Sold 1000 oct 86 puts 7.175 to 7.100
Bought 250 oct 90 calls vs selling the aug 106 calls paying .875
Sold 1200 Aug 105 calls @ .40 down to .35
Bought 800 84/88/100 call fly paid .225 covered 80.60 Bought the 88 calls On a Block
Sold 150 Aug 93 puts @ 1.1250
Bought 300 Dec 76/86 call spread paid 2.625 up to 2.725
Live Cattle
Bought 1000 Dec 232/224 put spreads paid 3.5 up to 3.6
Sold 150 Feb 232/224 put spread @ 2.25
Sold 100 Aug 242/252 call spread @ 5.20
Bought 300 Oct 238/234 put spread paid 1.475 up to 1.50
Bought 100 Dec 238/226 put spread paid 4.025
Bought 500 Dec 242/246/250 call fly paid .30
Sold 900 Dec 246/248 call spreads @ .80
Sold 200 July 243/246 call spread @ 1.975 down to 1.95
Feeder Cattle
Bought 100 Sep/Oct 350/360 put spread Diag. paid 6.250
Bought 200 Nov 360/350 put spread paid 3.65
Bought 300 Aug 374/370 put spread paid 1.775 up to 1.80
|
Corn
| | | | | | | | | | |
|
Month
|
Futures
|
Change
|
Strike
|
Implied Vol
|
Change in IV
|
Futures Range
|
Implied BE
|
Realized BE
|
20D Historic Vol
|
Days to Exp
|
|
C N6
|
414.75
|
7.75
|
415
|
30.7
|
6.40
|
12.25
|
8.02
|
4.85
|
18.57
|
1
|
|
C Q6
|
424.25
|
8.50
|
425
|
31.4
|
3.10
|
13.25
|
8.39
|
4.77
|
17.84
|
29
|
|
C U6
|
424.25
|
8.50
|
425
|
28.2
|
2.80
|
13.25
|
7.54
|
4.77
|
17.84
|
57
|
|
C V6
|
443.00
|
8.25
|
445
|
24.7
|
2.20
|
13.00
|
6.89
|
4.53
|
16.24
|
92
|
|
C X6
|
443.00
|
8.25
|
440
|
23.8
|
2.00
|
13.00
|
6.64
|
4.53
|
16.24
|
120
|
|
C Z6
|
443.00
|
8.25
|
445
|
23.0
|
1.60
|
13.00
|
6.42
|
4.53
|
16.24
|
148
|
|
Beans
| | | | | | | | | | |
|
Month
|
Futures
|
Change
|
Strike
|
Implied Vol
|
Change in IV
|
Futures Range
|
Implied BE
|
Realized BE
|
20D Historic Vol
|
Days to Exp
|
|
S N6
|
1127.50
|
18.75
|
1130
|
19.5
|
3.70
|
26.75
|
13.85
|
10.12
|
14.25
|
1
|
|
S Q6
|
1137.00
|
20.25
|
1140
|
17.4
|
2.00
|
28.25
|
12.46
|
10.30
|
14.38
|
29
|
|
S U6
|
1141.25
|
21.25
|
1140
|
18.0
|
1.70
|
29.50
|
12.94
|
10.33
|
14.37
|
57
|
|
S V6
|
1157.00
|
22.00
|
1160
|
17.2
|
1.30
|
30.25
|
12.54
|
9.89
|
13.57
|
92
|
|
S X6
|
1157.00
|
22.00
|
1160
|
17.1
|
1.10
|
30.25
|
12.46
|
9.89
|
13.57
|
120
|
|
SRW Wheat
| | | | | | | | | | |
|
Month
|
Futures
|
Change
|
Strike
|
Implied Vol
|
Change in IV
|
Futures Range
|
Implied BE
|
Realized BE
|
20D Historic Vol
|
Days to Exp
|
|
W N6
|
591.00
|
5.25
|
590
|
33.6
|
4.40
|
10.75
|
12.51
|
7.72
|
20.73
|
1
|
|
W Q6
|
601.50
|
5.50
|
600
|
27.9
|
1.80
|
12.00
|
10.57
|
7.47
|
19.71
|
29
|
|
W U6
|
601.50
|
5.50
|
600
|
27.0
|
1.00
|
12.00
|
10.23
|
7.47
|
19.71
|
57
|
|
W V6
|
618.25
|
5.50
|
620
|
24.7
|
0.60
|
11.75
|
9.62
|
7.12
|
18.28
|
92
|
|
W Z6
|
618.25
|
5.50
|
620
|
24.6
|
0.50
|
11.75
|
9.58
|
7.12
|
18.28
|
148
|
|
HRW Wheat
| | | | | | | | | | |
|
Month
|
Futures
|
Change
|
Strike
|
Implied Vol
|
Change in IV
|
Futures Range
|
Implied BE
|
Realized BE
|
20D Historic Vol
|
Days to Exp
|
|
KWN6
|
620.50
|
3.25
|
620
|
31.9
|
2.90
|
10.25
|
12.47
|
8.57
|
21.93
|
1
|
|
KWQ6
|
630.50
|
5.00
|
630
|
27.5
|
1.20
|
12.75
|
10.92
|
8.37
|
21.07
|
29
|
|
KWU6
|
630.50
|
5.00
|
630
|
26.7
|
0.70
|
12.75
|
10.60
|
8.37
|
21.07
|
57
|
|
KWZ6
|
645.75
|
5.00
|
645
|
24.0
|
0.40
|
12.25
|
9.76
|
8.08
|
19.85
|
148
|
|
KWH7
|
658.50
|
4.50
|
660
|
23.1
|
0.30
|
11.50
|
9.58
|
7.74
|
18.65
|
239
|
|
Bean Oil
| | | | | | | | | | |
|
Month
|
Futures
|
Change
|
Strike
|
Implied Vol
|
Change in IV
|
Futures Range
|
Implied BE
|
Realized BE
|
20D Historic Vol
|
Days to Exp
|
|
BON6
|
70.81
|
1.35
|
71
|
25.3
|
-2.30
|
2.12
|
1.13
|
1.18
|
26.45
|
1
|
|
BOQ6
|
69.54
|
1.29
|
69.5
|
23.7
|
0.40
|
2.06
|
1.04
|
1.08
|
24.74
|
29
|
|
BOU6
|
68.58
|
1.31
|
68.5
|
24.7
|
0.50
|
2.08
|
1.07
|
1.02
|
23.69
|
57
|
|
BOV6
|
67.72
|
1.37
|
67.5
|
24.9
|
0.40
|
2.10
|
1.06
|
0.97
|
22.84
|
92
|
|
Meal
| | | | | | | | | | |
|
Month
|
Futures
|
Change
|
Strike
|
Implied Vol
|
Change in IV
|
Futures Range
|
Implied BE
|
Realized BE
|
20D Historic Vol
|
Days to Exp
|
|
SMN6
|
308.20
|
4.60
|
310
|
28.5
|
6.50
|
4.50
|
5.53
|
3.27
|
16.87
|
1
|
|
SMQ6
|
306.00
|
4.00
|
305
|
20.0
|
1.80
|
4.30
|
3.86
|
2.76
|
14.31
|
29
|
|
SMU6
|
303.60
|
4.60
|
305
|
20.1
|
1.60
|
5.10
|
3.84
|
2.38
|
12.45
|
57
|
|
SMV6
|
302.00
|
4.80
|
300
|
19.3
|
1.30
|
5.20
|
3.67
|
2.23
|
11.73
|
92
|
|
Lean Hogs
| | | | | | | | | | |
|
Month
|
Futures
|
Change
|
Strike
|
Implied Vol
|
Change in IV
|
Futures Range
|
Implied BE
|
Realized BE
|
20D Historic Vol
|
Days to Last Trade
|
|
LHN6
|
92.700
|
-1.150
|
92
|
9.6
|
-0.30
|
0.95
|
0.56
|
1.10
|
18.82
|
20
|
|
LHQ6
|
96.600
|
-0.100
|
96
|
17.3
|
-0.40
|
1.48
|
1.05
|
1.07
|
17.62
|
50
|
|
LHU6
|
80.950
|
0.050
|
80
|
23.9
|
-0.20
|
1.47
|
1.22
|
0.91
|
17.85
|
82
|
|
LHV6
|
80.950
|
0.050
|
80
|
22.6
|
0.20
|
1.47
|
1.15
|
0.91
|
17.85
|
111
|
|
LHZ6
|
73.775
|
0.075
|
74
|
22.6
|
0.20
|
1.50
|
1.05
|
0.79
|
16.98
|
172
|
|
Live Cattle
| | | | | | | | | | |
|
Month
|
Futures
|
Change
|
Strike
|
Implied Vol
|
Change in IV
|
Futures Range
|
Implied BE
|
Realized BE
|
20D Historic Vol
|
Days to Exp
|
|
LCN6
|
247.225
|
0.700
|
248
|
14.2
|
-0.10
|
2.78
|
2.21
|
2.56
|
16.44
|
7
|
|
LCQ6
|
247.225
|
0.700
|
248
|
14.2
|
0.20
|
2.78
|
2.21
|
2.56
|
16.44
|
43
|
|
LCU6
|
240.625
|
0.250
|
240
|
14.5
|
0.10
|
2.90
|
2.20
|
2.64
|
17.39
|
71
|
|
LCV6
|
240.625
|
0.250
|
240
|
14.3
|
0.10
|
2.90
|
2.17
|
2.64
|
17.39
|
99
|
|
LCZ6
|
239.750
|
-0.100
|
240
|
13.9
|
0.10
|
2.83
|
2.10
|
2.50
|
16.52
|
162
|
|
Feeder Cattle
| | | | | | | | | | |
|
Month
|
Futures
|
Change
|
Strike
|
Implied Vol
|
Change in IV
|
Futures Range
|
Implied BE
|
Realized BE
|
20D Historic Vol
|
Days to Last Trade
|
|
FCQ6
|
373.300
|
0.375
|
374
|
13.7
|
0.10
|
6.35
|
3.22
|
4.48
|
19.04
|
63
|
|
FCU6
|
371.375
|
0.750
|
372
|
14.5
|
0.10
|
5.43
|
3.39
|
4.55
|
19.44
|
91
|
|
FCV6
|
368.350
|
0.800
|
368
|
15.2
|
0.00
|
5.50
|
3.53
|
4.58
|
19.74
|
126
|
|
FCX6
|
365.150
|
0.800
|
366
|
15.5
|
0.00
|
5.85
|
3.57
|
4.58
|
19.93
|
147
|
|
FCF7
|
358.725
|
0.675
|
358
|
15.8
|
0.10
|
4.35
|
3.57
|
4.46
|
19.74
|
217
|
This material should be construed as the solicitation of an account, order, and/or services and represents the opinions and viewpoints of the individual authors or presenters. It does not constitute an individualized recommendation or take into account the particular trading objectives, financial situations, or needs of individual customers.
The views are current only through the date stated and are subject to change at any time based upon market or other conditions, and StoneX Group Inc. (“SGI”) disclaims any responsibility to update such views. Actual results, performance, or achievements may differ materially from those expressed or implied. Information is based on data gathered from what we believe are reliable sources. Past performance does not guarantee future results.
The StoneX Group Inc. group of companies provides financial services worldwide through its subsidiaries, including physical commodities, securities, exchange-traded and over-the-counter derivatives, risk management, global payments and foreign exchange products in accordance with applicable law in the jurisdictions where services are provided.
References to certain OTC products or swaps are made on behalf of StoneX Markets, LLC (SXM), a member of the National Futures Association (NFA) and provisionally registered with the U.S. Commodity Futures Trading Commission (CFTC) as a swap dealer. SXM’s products are designed only for individuals or firms who qualify under CFTC rules as an ‘Eligible Contract Participant’ and who have been accepted as customers of SXM.
StoneX Financial Inc. (SFI) is a member of FINRA/NFA/SIPC and registered with the MSRB. SFI is registered with the U.S. Securities and Exchange Commission (SEC) as a Broker-Dealer and with the CFTC as a Futures Commission Merchant and Commodity Trading Advisor. StoneX Financial (Canada) Inc. (SFCI) is registered in Canada and is a member of CIRO and CIPF. References to certain securities trading are made on behalf of the BD Division of SFI and are intended only for an audience of institutional clients as defined by FINRA Rule 4512(c). References to certain exchange-traded futures and options are made on behalf of the FCM Division of SFI. Wealth Management is offered through SA Stone Wealth Management Inc., member FINRA/SIPC, and SA Stone Investment Advisors Inc., an SEC-registered investment advisor, both wholly owned subsidiaries of SGI.
R.J. O’Brien & Associates, LLC (RJO) is registered with the CFTC as a Futures Commission Merchant and is a member of NFA.
StoneX Financial Ltd (SFL) is registered in England and Wales, company no. 5616586. SFL is authorized and regulated by the Financial Conduct Authority (FCA) (registration number FRN:446717) to provide services to professional and eligible customers including: arrangement, execution and, where required, clearing derivative transactions in exchange traded futures and options. SFL is also authorized to engage in the arrangement and execution of transactions in certain OTC products, certain securities trading, precious metals trading and payment services to eligible customers. SFL is authorized and regulated by the FCA under the Payment Services Regulations 2017 for the provision of payment services. SFL is a category 1 ring-dealing member of the London Metal Exchange. In addition SFL also engages in other physically delivered commodities business and other general business activities which are unregulated and not required to be authorized by the FCA.
This communication is issued in the European Economic Area by StoneX Financial Europe GmbH (SFEG). StoneX is the trade name used by STONEX GROUP INC. and all its associated entities and subsidiaries. StoneX Financial Europe GmbH (“SFEG”) is a securities trading firm registered in Germany under Company No. HRB 80844.
StoneX Financial Pte Ltd (Co. Reg. No 201130598R) (“SFP”) is regulated by the Monetary Authority of Singapore and is a Capital Markets Service Licence holder (for dealing in capital market products), an Exempt Financial Adviser (for advising on investment products and issuing or promulgating analyses/ reports on investment products) and a Major Payment Institution (for domestic and cross-border money transfer services).
SFP may distribute analysis/report produced by its respective foreign affiliates within the StoneX Group of companies pursuant to an arrangement under Regulation 32C of the Financial Advisers Regulations Recipients should contact SFP at (65) 6309 1000 for any matters arising from, or in connection with, this webinar.
StoneX APAC Pte. Ltd. (“SAP”) (Co. Reg. No 200616676W) is regulated as a Dealer (PS20190001002) under the Precious Stones and Precious Metals (Prevention of Money Laundering and Terrorism Financing) Act 2019 for purposes of anti-money laundering and countering the financing of terrorism.
StoneX Financial (HK) Limited (CE No.: BCQ152) (“SHK”) is regulated by the Hong Kong Securities and Futures Commission for Dealing in Securities and Dealing in Futures Contracts.
StoneX Financial Pty Ltd (ACN 141 774 727) holds an Australian Financial Service License (AFSL: 345646) for Dealing in Securities, Exchange-Traded Derivatives Contracts, OTC Derivatives Contracts and Foreign Exchange Contracts, and is regulated by the Australian Securities and Investments Commission.
StoneX Securities Co., Ltd. (“SSJ”) (Co. Reg. No 010401047199) is regulated by the Japanese Financial Services Agency as a Type-I Financial Instruments Business Operator (Kanto Local Finance Bureau (FIBO)No.291’), is a member of the Financial Futures Association of Japan for dealing and broking FX and FX Option transactions, and is a member of the Japan Securities Dealers Association for dealing and broking stock indices and option transactions.
Trading swaps and over-the-counter derivatives, exchange-traded derivatives and options and securities involves substantial risk and is not suitable for all investors. Past performance of any futures or option is not indicative of future success. Indicators are not a trading system and are not published as a specific trade recommendation. The information herein is not a recommendation to trade nor investment research or an offer to buy or sell any derivative or security. It does not take into account your particular investment objectives, financial situation or needs and does not create a binding obligation on any of the StoneX group of companies to enter into any transaction with you. You are advised to perform an independent investigation of any transaction to determine whether any transaction is suitable for you. No part of this material may be copied, photocopied or duplicated in any form by any means or redistributed without the prior written consent of StoneX Group Inc.
The report/analysis herein is not directed to, or intended for distribution to or use by, any person or entity who is a citizen or resident of or located in any locality, state, country or other jurisdiction where such distribution, publication, availability or use would be contrary to law or regulation.
© 2026 StoneX Group Inc. All Rights Reserved.