The continuation of the La Niña condition has caused major losses in Colombian coffee production and could be a concern for Brazilian production in 2023. In addition to losses of 15% in Colombian production in the first half of the year, the maintenance of this condition during the second half of the year could impact coffee flowering in Brazil and consequently production in 2023, given that La Niña in the second half of the year is associated with delayed rainfall in much of the coffee belt.
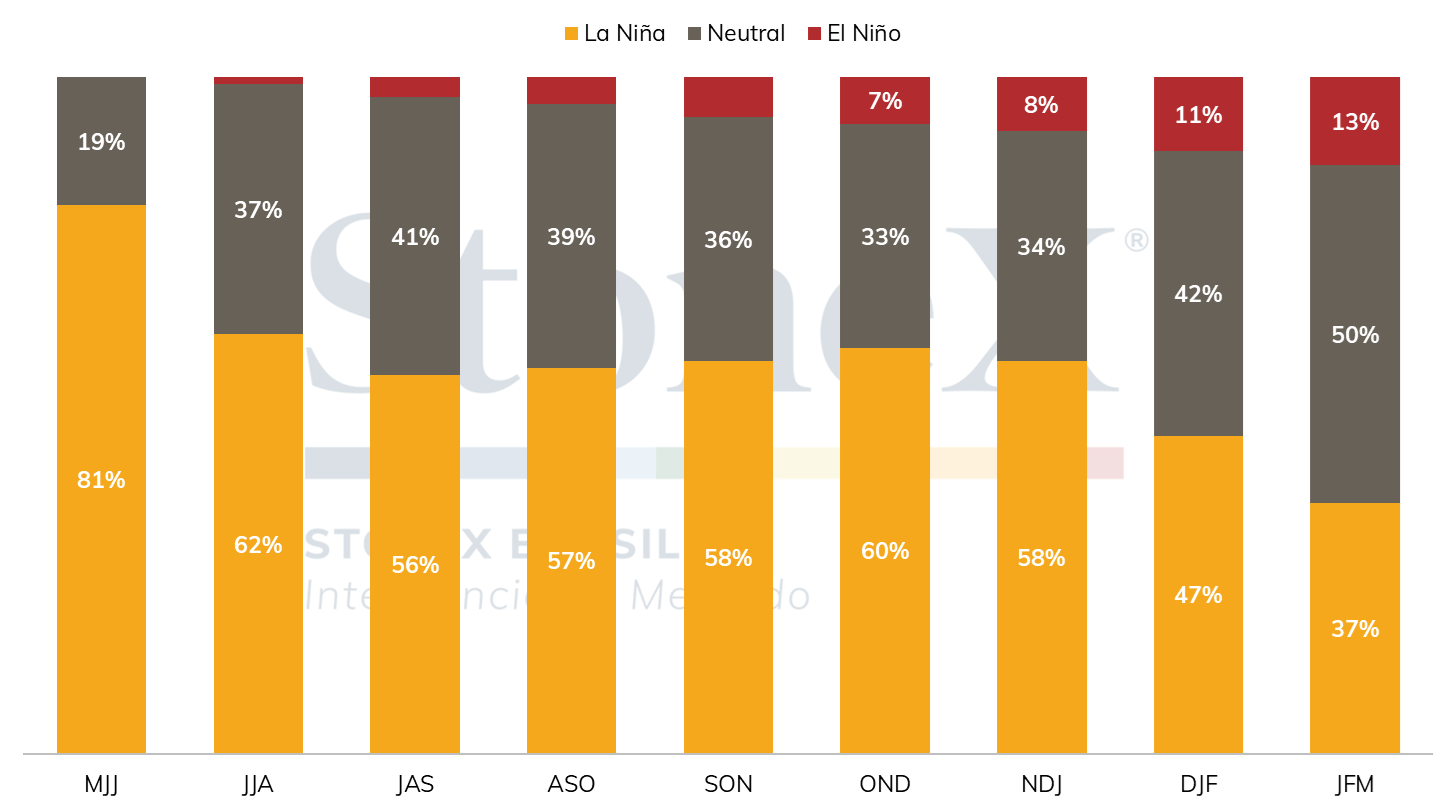
The latest update of NOAA's probability model, released on May 19, indicates a value above 55% at least through November, December and January. As a result, the La Niña probability of the latest update has been slightly reduced compared to the previous forecast but remains at high levels for the second half of the year. On the other hand, in its latest update, the Australian agency BOM shows that most international weather models indicate a neutral condition from June/July. Therefore, monitoring this scenario is essential to evaluate and anticipate the prospect of the phenomenon maintenance.
EL NIÑO/LA NIÑA PROBABILITY FORECAST
Source: NOAA. Design: StoneX.
Among the week's releases, agents followed the first revision of Conab's estimates for the Brazilian crop and the release of more USDA Attaché reports. In a report released on Thursday (19), Conab reduced by 4.2% its estimates for Brazilian coffee production in 2022/23, adjusting from 55.7 million bags estimated in the January report to 53.4 million bags. The change came mainly from a reduction of 3.072 million bags (-7.9%) in Arabica production to 35.7 million, while Robusta production increased by 757,000 bags (4.5%) to 17.7 million.
In the report, unfavorable weather conditions between June and September 2021 were highlighted as a determinant for the reduction in expected production. It is worth noting that Conab's estimates are the lowest available among all market estimates, which now present a range of over 11 million bags, reinforcing the high uncertainty surrounding the potential of the current crop.
USDA starts to release reports from its attachés in producing countries
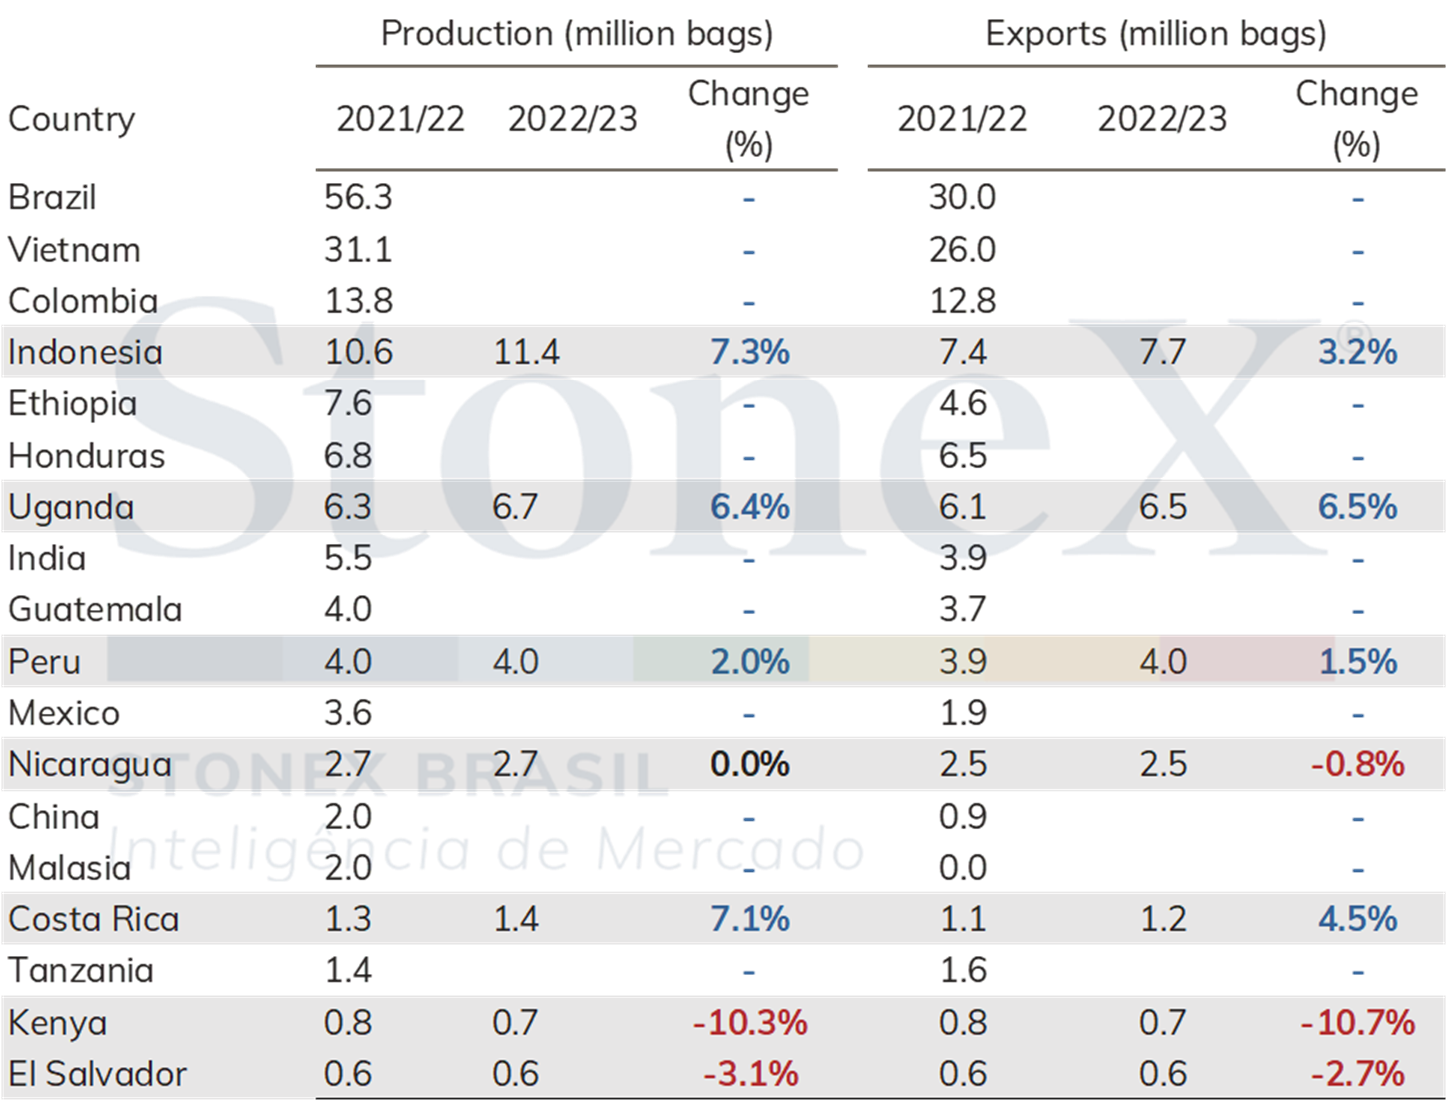
As commented on our outlook for the coffee market [May-July], the market closely follows USDA reports on several countries' production in 2022/23, which are produced from USDA attachés in producing countries. Until the publication of this report, the attaché released estimates for seven countries: Indonesia, Uganda, Peru, Nicaragua, Costa Rica, Kenya, and El Salvador.
The highlights from the reports released so far are the 7.3% increase in production in Indonesia, 6.4% in Uganda, 7.1% in Costa Rica, and 2% in Peru. Kenya and El Salvador's production should drop by 10.3% and 3.1%, respectively, but these countries' production is not representative in the global context. Considering all estimates available, production should increase by 4.7% and exports by 2.8%. It is worth noting that the data from important countries such as Brazil, Vietnam, and Colombia have not yet been released, which should be revealed over the coming weeks.
Summary of estimates from USDA's Attaché reports
Source: USDA. Design: StoneX.
Increase in GCA stocks and potentially lower US imports increase doubts about demand
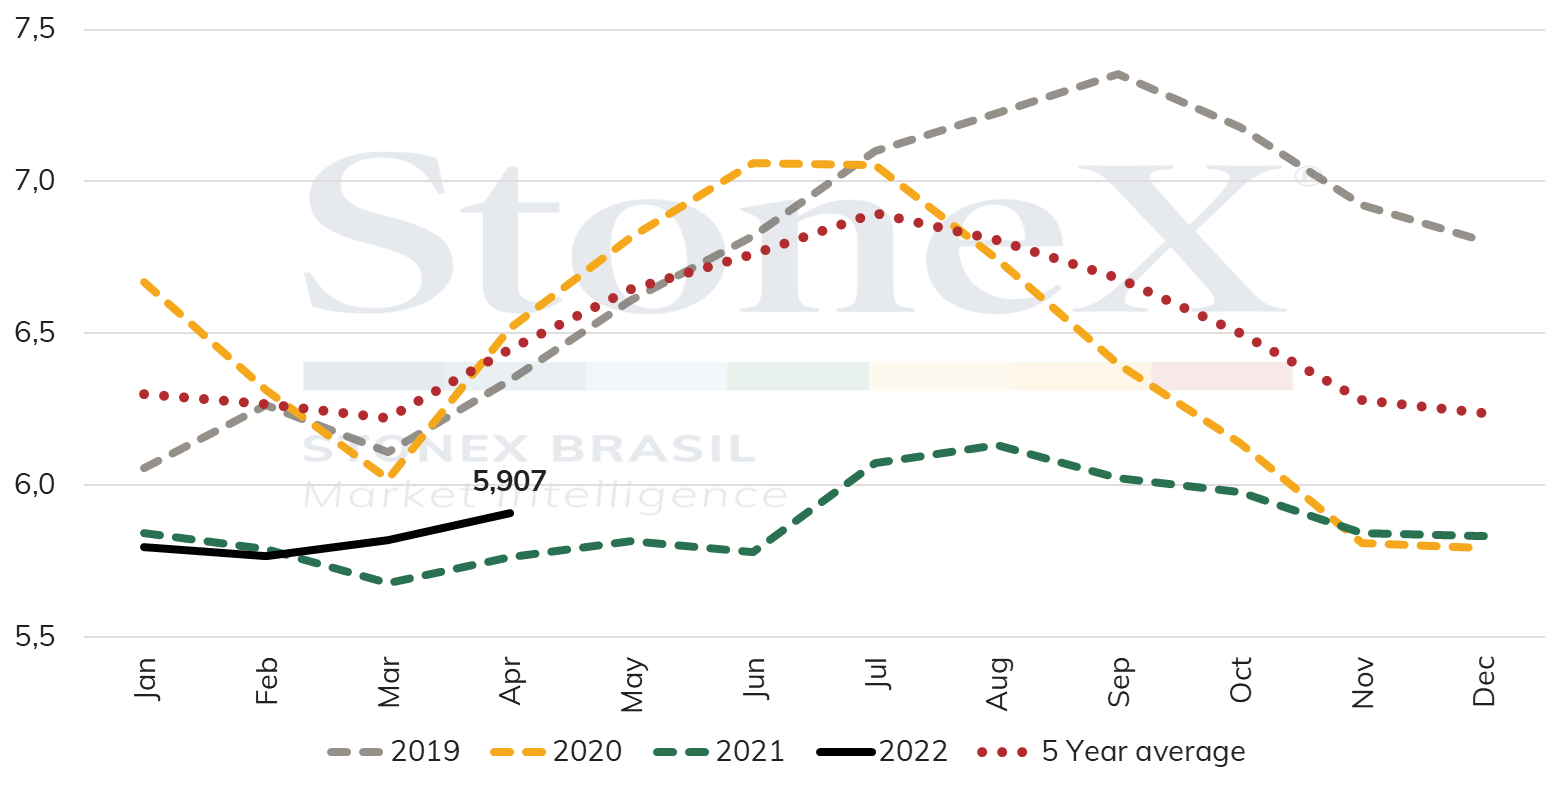
Last week, the Green Coffee Association (GCA) reported that stocks at US ports increased by 86.3 thousand bags in April to 5.907 million bags. This represents a 1.5% increase over the previous month and a 2.5% increase compared to the same period in 2021 when stocks totaled 5.763 million bags. In general, the variation was in line with the market's expectations, given that the last 5-year average showed an increase of around 3.7% from March to April.
The import data from the United States will only be released on June 7. However, some assumptions can already be made from the GCA numbers and some important exporters.
According to Cecafé's last report, Brazil shipped 389,000 bags to the United States in April. The volume is significantly lower than the 5-year average for the month, 614,000 bags, a drop of 36.6%. If compared to the 739 thousand bags shipped in April last year, the drop is even sharper, with a decrease of 47.4%.
Looking at Central America, a region that usually has increased volumes shipped to the United States to over 500 thousand bags as of April, there are still doubts whether this export pattern will be maintained. The region's two main suppliers, Honduras and Guatemala, registered a 28% drop and a 12% rise in their exports for the month, respectively. Although the reports do not give details of how much was sent to the largest global consumer, it seems reasonable to say that exports from the region should not show a large jump from the average of recent years, possibly posting a decline.
Thus, despite the seasonal characteristic of an increase in GCA stocks in April, major suppliers' so-far weak export figures, especially the sharp drop in Brazilian shipments, suggest that US import data may be lower than expected in April. Although it is still too early to conclude, if a drop in US imports is confirmed, a scenario of cooling consumption or lower-than-normal growth for the country may emerge. It will be extremely important to monitor this correlation in the coming months, with an eventual consolidation of this data weighing on prices.
Seasonality of coffee stocks at US ports - GCA (million bags)
Source: GCA. Design: StoneX.
USDBRL ends the week sharply lower
The USDBRL closed sharply lower last week in the Brazilian foreign exchange market and abroad. The real/dollar pair posted a weekly depreciation of 3.7% in the period, ending Friday’s session (20) at BRL 4.871. The dollar index retreated from its 20-year highs during most of the week, ending at 103.1 points, a decline of 1.5%.
The dollar continues to drop against the Brazilian real this week, following the downward movement of the American currency against global markets. The maintenance of the exchange rate below the BRL 5.00 level may support the coffee prices in New York since the concerns about frosts are over. With no expectation of important indicators this week, the agents tend to look for direction in extrinsic factors.