At the time of writing (29th January) copper has posted a new record nominal high, moving intraday over $14,000/t, marking a record-breaking start to the year, before plummeting by over $1000/t in afternoon trading (GMT). These volatile moves come on the back of robust gains in the final quarter of 2025, where LME 3M copper posted a 21% jump, its best quarterly performance since Q2 2020, resulting in an annual gain of 42%, its best performance since 2009.
LME 3M Copper Intra-day Price
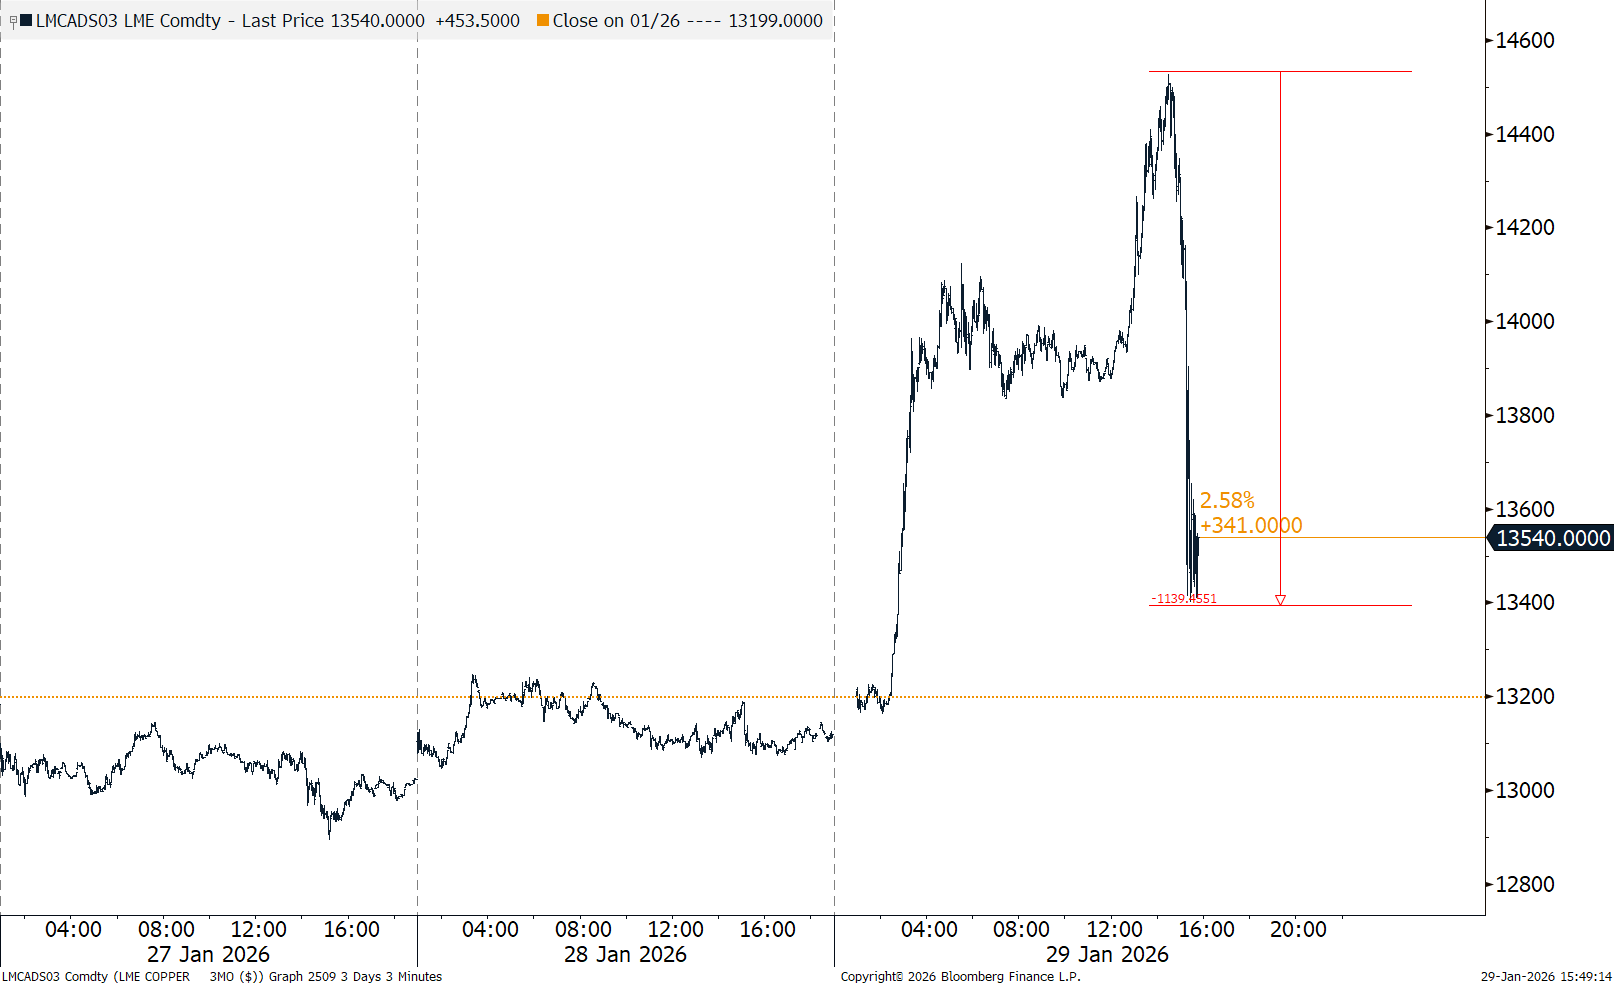
Source: Bloomberg
LME, SHFE & COMEX Copper Prices
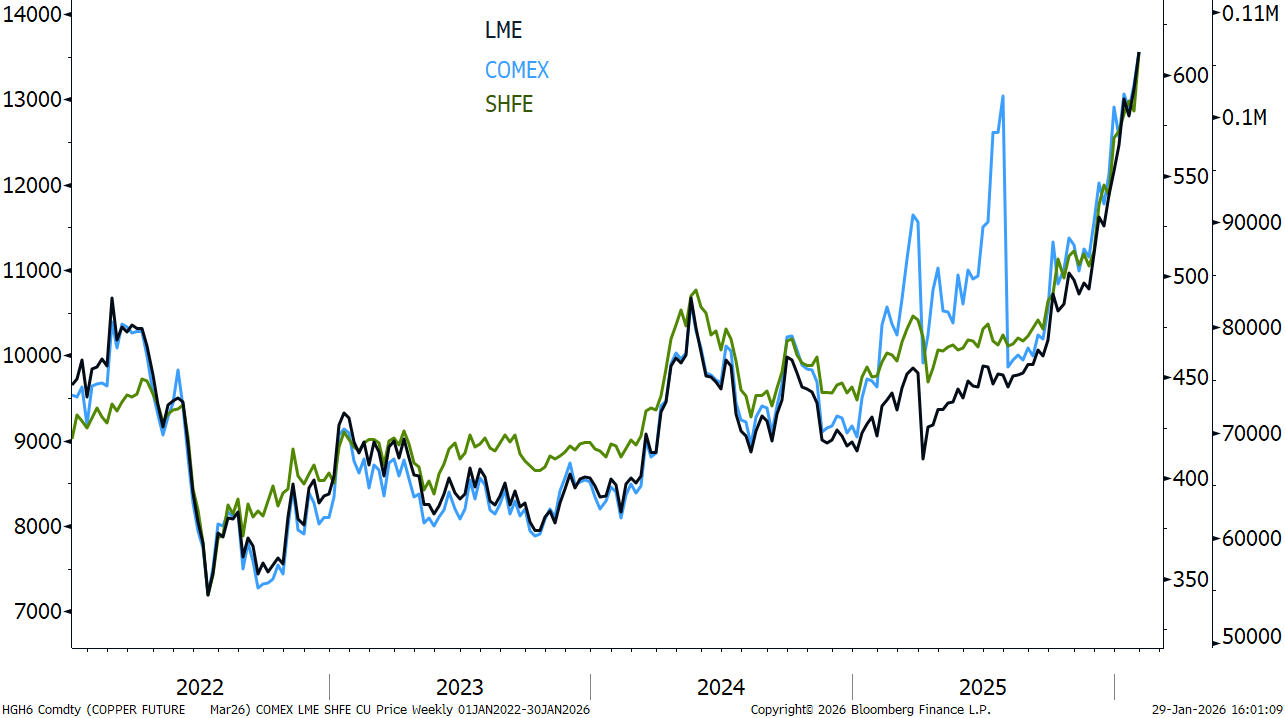
Source: Bloomberg
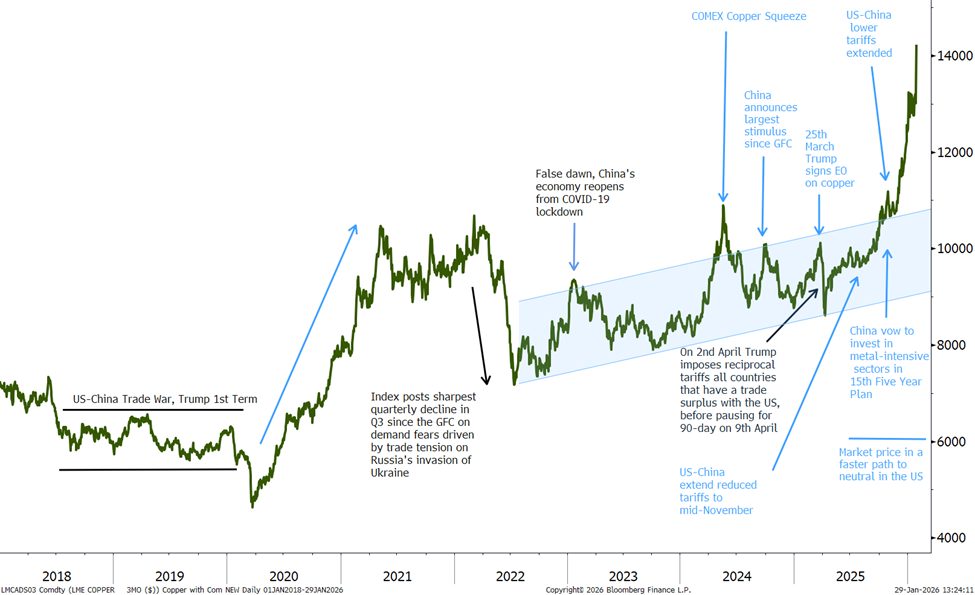
LME 3M Copper Price Performance
LME 3M Copper Annual Price Change – 2025 Posted Largest Gains Since 2009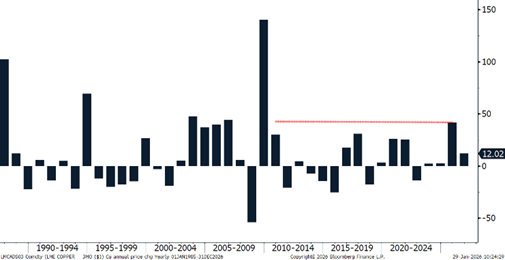
Source: Bloomberg
LME 3M Copper Quarterly Price Change – 2025 Posted Largest Gains 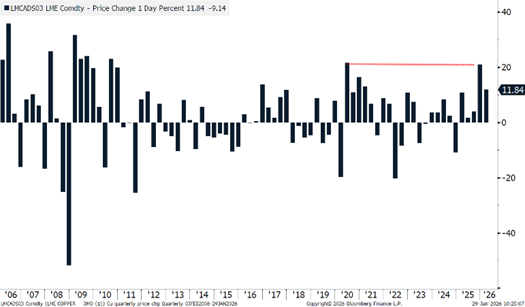
Source: Bloomberg
What is driving copper prices?
Typically, when it comes to price forecasting for copper, we look at impacts that will affect the metal from a macroeconomic, fundamental and speculative perspective; however, on the introduction of global and sector specific tariffs from the US this year, we now include this as one of our major price driving parameters.
Looking over 2025, in particular to the final quarter of the year, copper benefited from a perfect storm of factors across all key price drivers:
- Firstly, we encountered a warming in the macroeconomic outlook (especially as we headed to the end of the year), with China-US tensions lowering, the Federal Reserve having cut rates three times in 2025, China outlining metal-intensive spending in the year ahead, the end of the US Government shutdown and tentative talks of peace in Russia and Ukraine
- Secondly, within the fundamentals side (we’ve had a year in which elevated disruption rates in key producing countries such as the DRC, Indonesia and Chile push the market into deeper deficits in 2025 and 2026 both on the refined and concentrate side of the market, with market participants still adjusting to a record low environment for RCTCs)
- Meanwhile, the expectations of future US import tariffs on refined copper have singly handily been responsible for global trade re-rerouting, creating tightness ex-US with more than 1.1Mt having entered the US last year.
- Given these factors, speculators have piled into copper with net longs on COMEX and LME reaching a record high and highest level since March 2025, respectively.
However, as we’ve entered 2026, the sheer pace of gains has moved copper price action away from these traditional drivers. Indeed, given the speed at which fundamentals can change (months-to-quarters), these recent prices moves cannot be justified by them. Therefore, it is evident that the role of speculators is behind this.
Just how influential is the role of speculators in the copper market?
Simply put, it can be very influential, holding the ability to move copper prices away from realities in the market. Indeed, if we look back to H1 2024, we have a classic example of this.
On 20th May 2024, copper posted a record nominal high of $10,899/t, well above the previous March 2022 high of $10,674/t, recorded when Russia invaded Ukraine. Here, while there were bullish drivers in the market stemming from copper’s long-term use in the green transition, significant supply shocks on the concentrate side of the market, in addition to a view that cyclical demand recovery was in sight, copper prices rising towards $11,000/t was unjustifiable simply on a macroeconomic and fundamental basis. Instead, it was the impact of money flow on the copper market that moved prices to these levels.
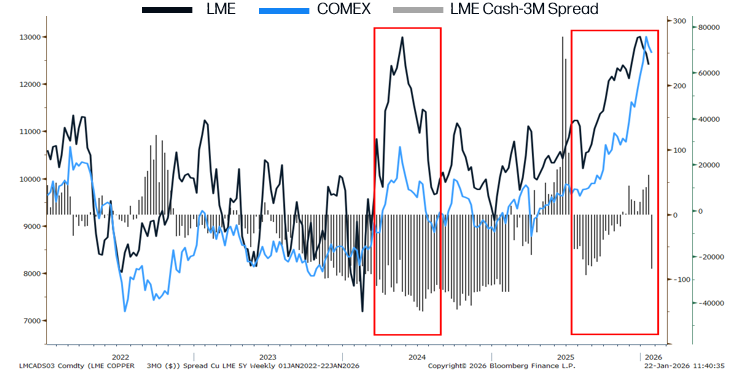
LME Cash-3M Copper Spread Versus LME 3M Price & Net Investment Firm Positions
Source: Bloomberg
Firstly, if we look at a chart of LME 3M copper prices versus the LME Cash-3M spread in H1 2024, we had never seen copper prices at such elevated levels in such a wide contango market, highlighting a disconnect. Furthermore, the statical relationship between net positions and the change in copper prices was evident, with the correlation on COMEX rising to 0.70 over the period, versus just 0.35 over 2023. From a wider perspective, in just a six-week period, the rise in copper took the base metal index from the worst performing commodity asset to the second best. However, this was short lived, with copper returning to its previous trading range over the course of the rest of the year, following a sharp exit in long positions.
To read the report in June 2024, Fastmarkets Copper Seminar – 12th June New York, click HERE.
What About Now?
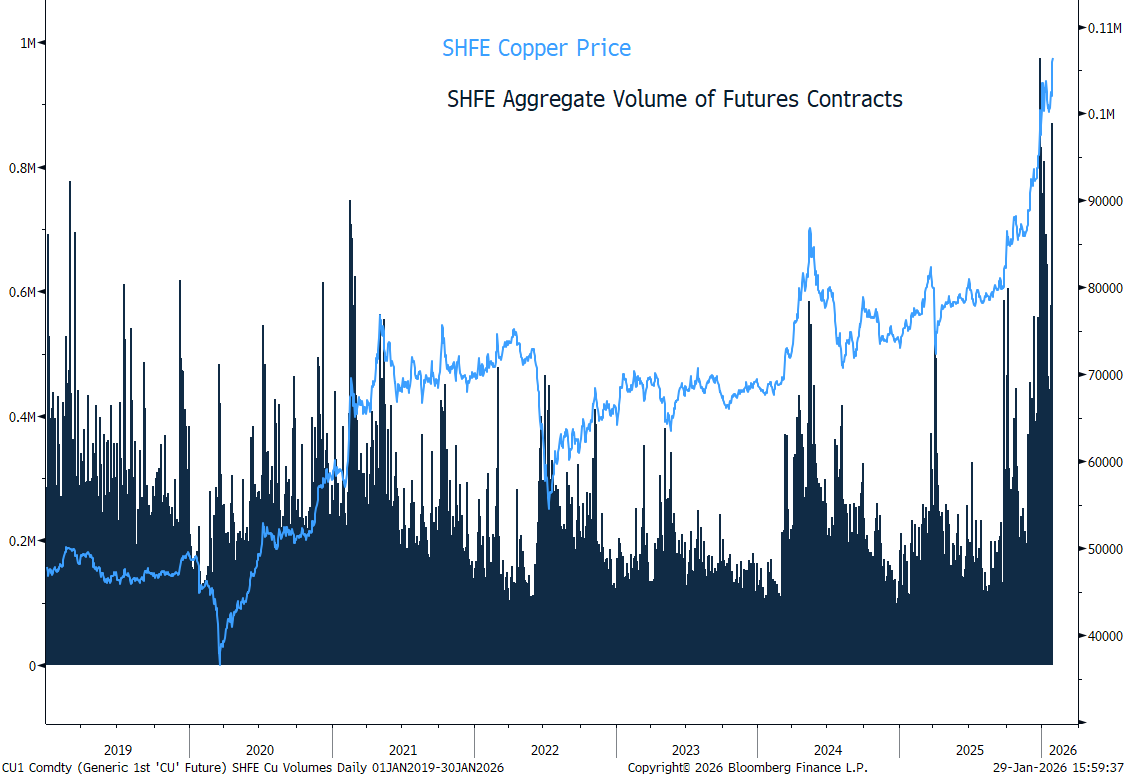
Over the last four months, the role of speculators has been pivotal and the leading driver behind copper hitting these new record highs over $14,000/t. Indeed, looking at trading volumes in recent months:
- In Q4 2025, LME copper trading volumes rose to their highest level since 2013
- In December, SHFE trading volumes rose to their highest level since November 2015
- Over 2025, CME micro copper contract posted a 20% Y/Y jump
As it stands, not only does copper hold its own bullish themes, but in wider market context, we are seeing a spillover from safe haven buying in precious metals to copper, and that is changing how copper prices react to market news. For example, historically when we have a backdrop of rising geopolitical tensions, industrial metals face downward pressure, with building concerns for economic growth, leading to lower investment, demand and prices, with copper taking up its role of Dr. Copper. However, at present, investor concerns surrounding a weakening dollar (which fell to its lowest level in four years against a basket of currencies), are increasing the desire to hold alternative hard assets. Indeed, the appeal of the US dollar has weakened amid an environment of heightened uncertainty, as President Trump’s military rhetoric and tariff threats have increased market volatility, while also raising questions about the independence of the Federal Reserve. Furthermore, recent regulatory restrictions on safe haven assets, such as gold and silver on Asian exchanges such as SHFE, have created a spillover effect into copper. Therefore, we are in a period of escalating geopolitical tensions, yet copper remains at historically high levels.
SHFE Copper Price Versus Aggregate Volume of Futures Contracts
Source: Bloomberg
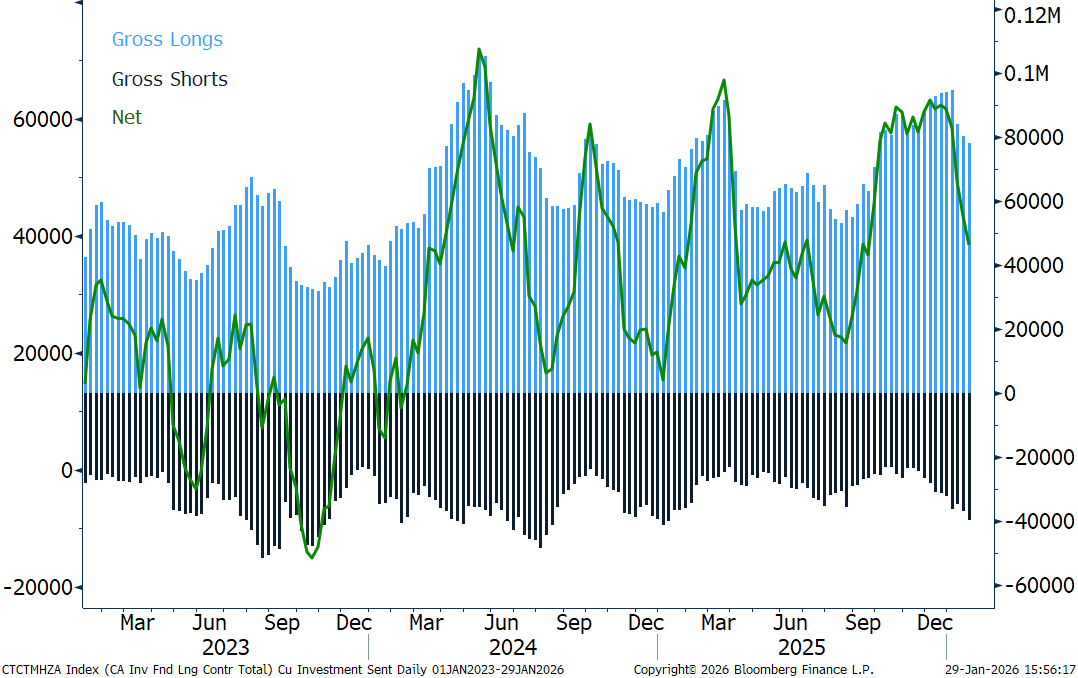
LME Investment Firm Positions
Source: Bloomberg
However, taking a deeper dive into LME Commitment of trader reports (COTR), which is designed to “reflect the nature of the predominant business activity that LME members and their clients are involved in using”. The most recent rise in copper prices (29th January) isn’t purely driven by speculative appetites; in fact the speculative market appears to have moved into profit-taking mode.
Instead, it is commercial undertaking positions that are increasing their long exposure to copper, a bullish signal to the market, suggestive (we believe in this case) that producers, consumers and merchants of copper are hedging to lock in prices before potential further price spikes.
COTR Classifications:
- Investment Firms and Credit Institutions
Regulated legal entities, such as banks and brokers, whose primary business is providing investment services or conducting investment activities on a professional basis. This includes firms trading on their own account, including market makers.
Entities responsible for managing collective investment vehicles, including Undertakings for Collective Investment in Transferable Securities (UCITS) and Alternative Investment Funds (AIFs).
- Other Financial Institutions
Financial entities not classified as investment firms or funds, including insurance companies, reinsurance undertakings, and institutions for occupational retirement provision.
Non-financial entities that produce, process, or consume metals and use the LME to manage commercial risk. This category also captures market participants that do not fall within other classifications, including certain private companies and individuals.
Where will copper prices go in the months ahead?
Looking at the very near-term, we expect copper prices to continue to be led by sentiment from investors seeking alternative ‘safe haven’ exposure, while attention will be paid to developments regarding US copper specific tariffs, in addition to focus on regional levels of global stocks and material entering the US. We expect movements in the US dollar will remain a key price driver, offsetting concerns from underlying global fundamentals such as demand. In turn, we expect copper to trade in a new higher normal range over this period, posting bouts of volatility within the forward curve.
Correlation LME 3M Copper Versus US Dollar
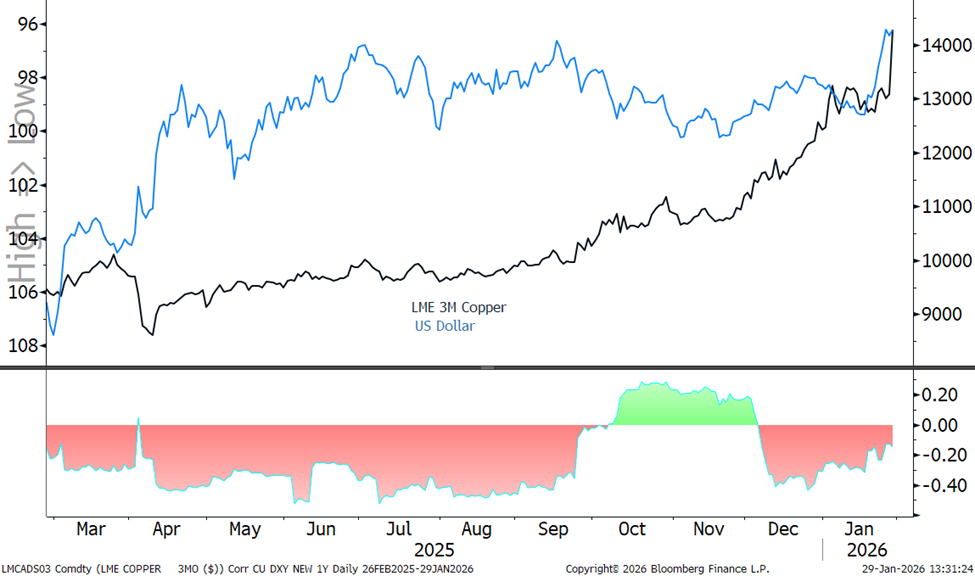
Source: Bloomberg
Where will copper prices go in the year ahead?
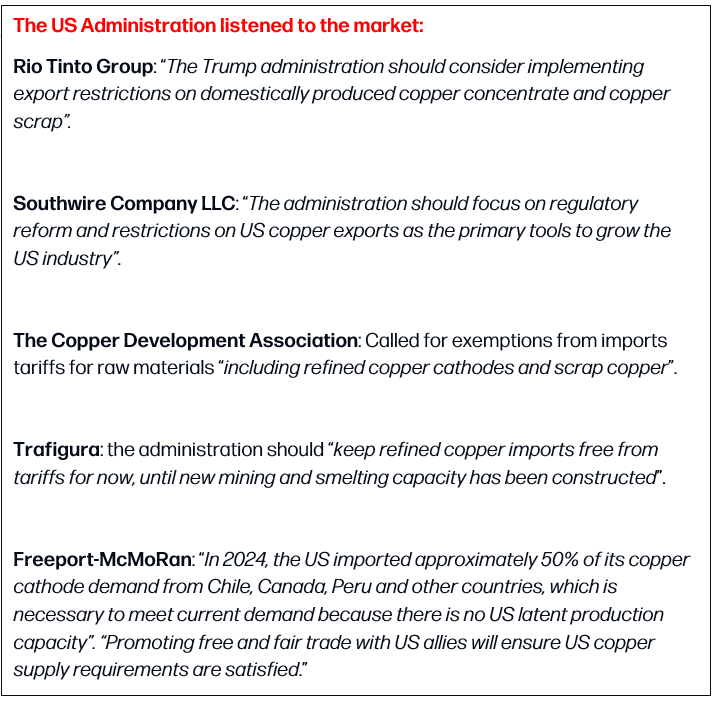
Looking across the year, we see prices for copper above $13,000/t as unsustainable with downwards pressure likely to come from
- The very real potential that no tariffs are imposed on refined copper going into the US.
A minimum of 1.1Mt of copper entered the US in 2025, driven by a record premium in the COMEX-LME spread, given anticipation that the US administration would move forward with import tariffs on refined copper. However, as we enter 2026, there is building sentiment that these tariffs may not materialize. Indeed, the COMEX-LME arbitrage is pricing in just a 5% chance of tariffs by year-end, while the move in January to delay a decision over tariffs on critical minerals under Sections 232, further feeding the view. In addition, based on market player feedback (see below), there is non-existent support for tariffs on refined material.
These tables include predictions/forecasts. Past performance may not be a reliable guide to future performance.
Source: Whitehouse.gov, Bloomberg; SMM,, ICSG, StoneX
If we look at the spread for the COMEX-LME March-March contract, the arbitrage has inverted, showing a premium for LME copper prices, with material being brought on warrant in US based LME warehouses. Therefore, in the absence of an attractive premium we do not expect the same level of inflows as last year, however; it is evident some material is entering the country still (based on COMEX data), likely stemming from long-term deals with producers made last year. In addition, we do not expect the material held in the country to be re-directed to the rest of the world until there is absolute certainty no tariffs will be put on refined copper, with high shipping costs a key driver.
Copper COMEX-LME Arbitrage
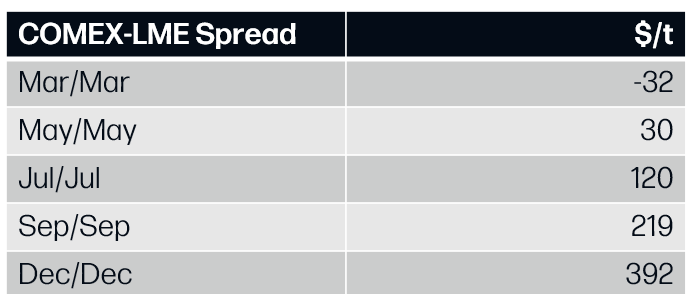
Source: Bloomberg
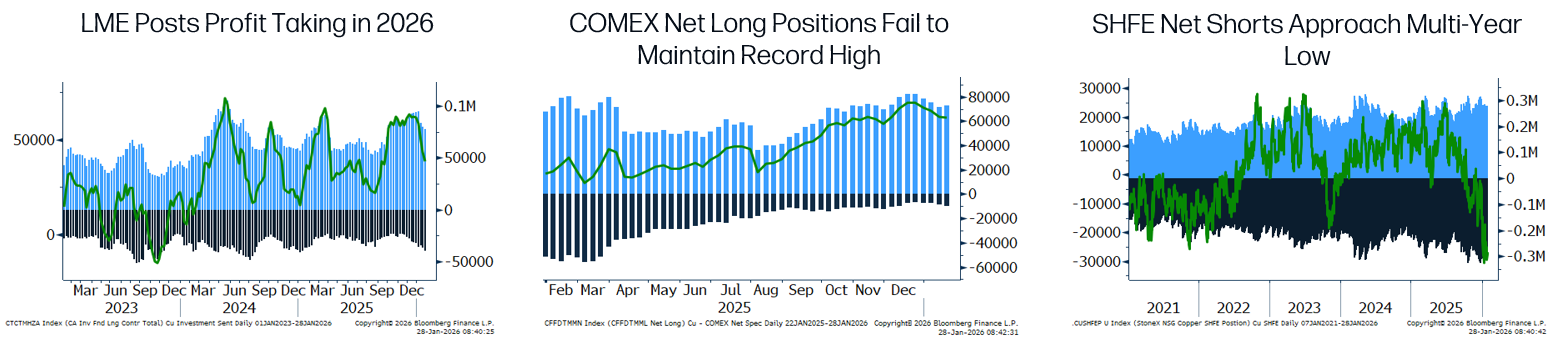
- Market speculative positioning is at risk of being overdone
We see current market speculative positioning at risk of being overdone, with a global divergence in view, further providing support. Note, net positions on the SHFE (at the time of writing) are posting multi-year net shorts versus LME net positions hovering near record net longs. When extreme levels are formed, this is often accompanied by sharp reversals and we expect this to be the key area to watch in the year ahead, especially given building evidence of recent profit taking.
Image Title
Source: Bloomberg
- The fundamentals, do not support copper at historical highs (see annual outlook HERE)
While we forecast copper in a deeper deficit market Y/Y in 2026, we still do not see the market as historically out of balance. And although supply risks do outweigh a demand slowdown (on high prices, alongside a slowdown in Chinese consumption), fundamentals certainly do not support copper at current levels.
Supply risks will continue to hold the copper market in a tight balance
We expect that mine production came in flat in 2025, driven by a host of supply disruptions within key producing countries such as the DRC, Indonesia and Chile. Indeed, in the DRC, the Kamoa-Kaula complex cut its 2025 production guidance by a significant 28% in 2025, while YTD output from the largest producing country Chile, remains below five-year averages. Meanwhile, Freeport-McMoRan suspended all operations in September at its Grasberg mine in Indonesia (the second largest mine in the world) due to a mudslide, with pre-accident operational levels not set to return until 2027. Looking to the years ahead, we forecast that mine production will steadily improve (CAGR~2.4% 2026-29 period), given the number of announced projects and ramp-ups (Zambia, Mongolia and Chile). However, risks are skewed to the upside with the average disruption allowance exceeding expectations over seven of the last ten years. This is enhanced by the reality that more than 50% of copper production stems from just three countries, Chile, Peru and the DRC, with South American producers' long-suffering from falling ore grades, droughts, alongside social and political unrest. The return of production from Grasberg’s Block Cave mine in H22026, and potential reopening of Cobre Panama will remain significant swings factor in our forecast.
Looking to refined production, we expect copper output grew at 2.3% in 2025, its lowest level since 2023, before recovering to average growth above 2.4% over 2026-27. Output has been limited this year on a tight concentrate market, with Antofagasta Plc and Chinese smelter Jinchuan Group Corporation setting their mid-year RCTC at $0.0/t and 0.0 cent per pound respectively. This is down from the 2024 mid-year level of $23.25/t and annual benchmark (at end-2024) of 21.25/t. This is the first time long-term copper RCTCs have fallen into negative territory. Global copper smelters will enter a state of loss when TCs fall below $20/t, and therefore because of building smelter capacity globally, several smelters ex-China have shuttered, including Sinomine’s Tsumeb plant in Namibia and Glencore’s Pasar smelter in the Philippines. However, despite these negative treatment charges, Chinese production continues to remain healthy, with output hitting a record high in 2025, and set to jump 7.5%Y/Y in 2026, supported by state-backed funding and high prices of byproduct credits (e.g. sulphuric acid and precious metals).
Copper demand dampened by high prices and previous front loading in China
Copper demand in 2026 is set to slow Y/Y to 2.3% from 4.1% last year, in large part driven by a slow down in Chinese consumption following a year of front-loading ahead of the conclusion to China’s 14th Five Year Plan, with growth down from 4.4% Y/Y to 2.2% in 2026. We expect the most significant growth areas will arise from copper’s use in renewable energy, AI, the state grid and NEV, while demand from copper’s largest end use, contruction, is set to come under increasing pressure from deepening declines in property investment and a large inventory overhang. Meanwhile, we expect steady demand from Asia ex-China, in addition to a return to growth in key consuming regions Europe, Japan and the United States. In turn, with forecast lower interest rates, we expect copper demand to benefit not just from fast growing digital and green demand sectors, but from recovery in the global industrial cycle; however, risks from trade tariffs and high copper prices remain a key headwind. Indeed, on a seasonality basis China’s import premium has fallen to its lowest level on record in January, further encouraging substitution efforts. Furthermore, while copper’s use in AI is deeply embedded in projections via infrastructure build outs, electrification of transport and modernization of power grids (renewable energy). It is important to realize that the percentage of copper demand is very small by end-use market. The most bullish case is for 1-2Mt of copper demand a year from AI by 2030, while lower estimates range from 500-600,000t. As it stands, that is less than 1.5% of total copper demand in 2026.
Copper:Gold Ratio
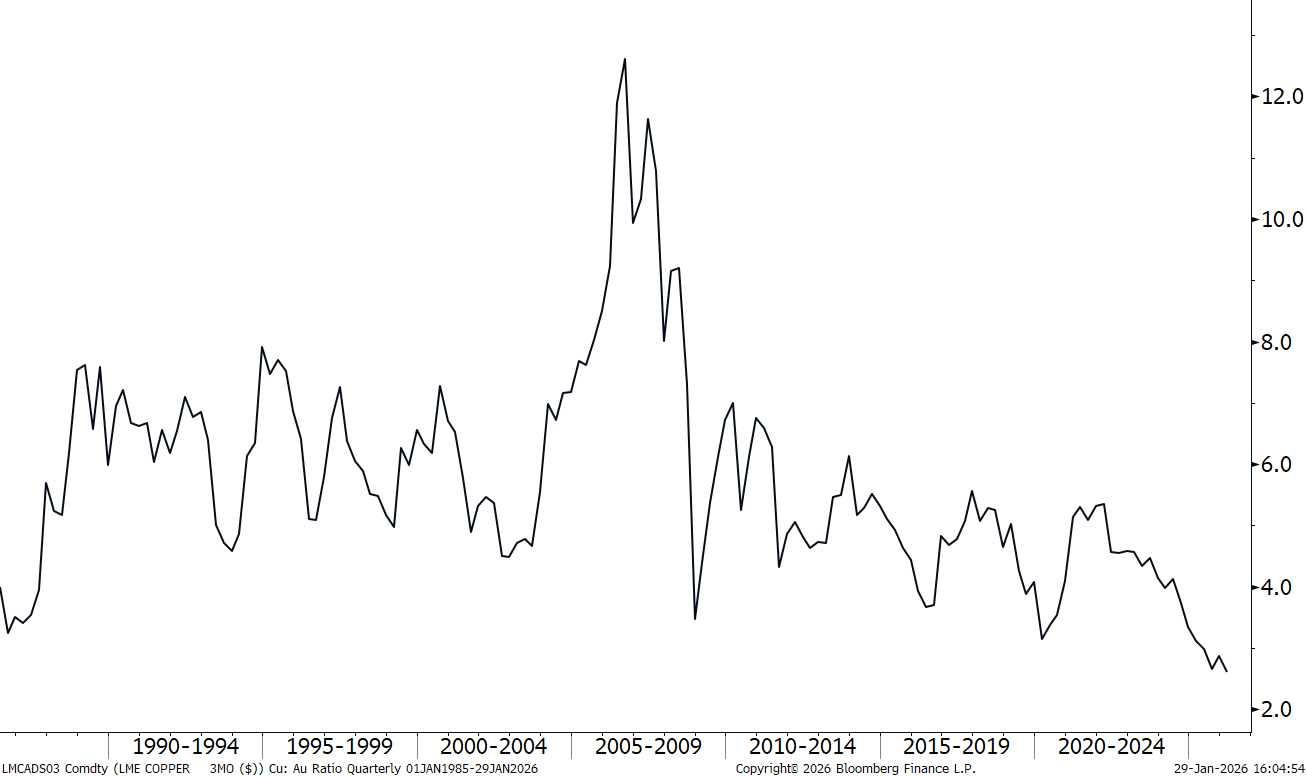
Source: Bloomberg
This material should be construed as market commentary and represents the opinions and viewpoints of the author, and does not reflect tailored advice associated with any specific account.
The views are current only through the date stated and are subject to change at any time based upon market or other conditions, and StoneX Group Inc. (“SGI”) disclaims any responsibility to update such views. Actual results, performance, or achievements may differ materially from those expressed or implied. Information is based on data gathered from what we believe are reliable sources. Past performance does not guarantee future results.
The StoneX Group Inc. group of companies provides financial services worldwide through its subsidiaries, including physical commodities, securities, exchange-traded and over-the-counter derivatives, risk management, global payments and foreign exchange products in accordance with applicable law in the jurisdictions where services are provided.
References to certain OTC products or swaps are made on behalf of StoneX Markets, LLC (SXM), a member of the National Futures Association (NFA) and provisionally registered with the U.S. Commodity Futures Trading Commission (CFTC) as a swap dealer. SXM’s products are designed only for individuals or firms who qualify under CFTC rules as an ‘Eligible Contract Participant’ and who have been accepted as customers of SXM.
StoneX Financial Inc. (SFI) is a member of FINRA/NFA/SIPC and registered with the MSRB. SFI is registered with the U.S. Securities and Exchange Commission (SEC) as a Broker-Dealer and with the CFTC as a Futures Commission Merchant and Commodity Trading Advisor. StoneX Financial (Canada) Inc. (SFCI) is registered in Canada and is a member of CIRO and CIPF. References to certain securities trading are made on behalf of the BD Division of SFI and are intended only for an audience of institutional clients as defined by FINRA Rule 4512(c). References to certain exchange-traded futures and options are made on behalf of the FCM Division of SFI. Wealth Management is offered through SA Stone Wealth Management Inc., member FINRA/SIPC, and SA Stone Investment Advisors Inc., an SEC-registered investment advisor, both wholly owned subsidiaries of SGI.
R.J. O’Brien & Associates, LLC (RJO) is registered with the CFTC as a Futures Commission Merchant and is a member of NFA.
StoneX Financial Ltd (SFL) is registered in England and Wales, company no. 5616586. SFL is authorized and regulated by the Financial Conduct Authority (FCA) (registration number FRN:446717) to provide services to professional and eligible customers including: arrangement, execution and, where required, clearing derivative transactions in exchange traded futures and options. SFL is also authorized to engage in the arrangement and execution of transactions in certain OTC products, certain securities trading, precious metals trading and payment services to eligible customers. SFL is authorized and regulated by the FCA under the Payment Services Regulations 2017 for the provision of payment services. SFL is a category 1 ring-dealing member of the London Metal Exchange. In addition SFL also engages in other physically delivered commodities business and other general business activities which are unregulated and not required to be authorized by the FCA.
This communication is issued in the European Economic Area by StoneX Financial Europe GmbH (SFEG). StoneX is the trade name used by STONEX GROUP INC. and all its associated entities and subsidiaries. StoneX Financial Europe GmbH (“SFEG”) is a securities trading firm registered in Germany under Company No. HRB 80844.
StoneX APAC Pte. Ltd. (“SAP”) (Co. Reg. No 200616676W) is regulated as a Dealer (PS20190001002) under the Precious Stones and Precious Metals (Prevention of Money Laundering and Terrorism Financing) Act 2019 for purposes of anti-money laundering and countering the financing of terrorism. SAP is an “Approved International Trading Company” authorized to act as a “Spot Commodity Broker” under the Commodity Trading Act.
StoneX Financial Pte Ltd (Co. Reg. No 201130598R) (“SFP”) is regulated by the Monetary Authority of Singapore and is a Capital Markets Service Licence holder (for dealing in capital market products), an Exempt Financial Adviser (for advising on investment products and issuing or promulgating analyses/ reports on investment products) and a Major Payment Institution (for domestic and cross-border money transfer services).
SFP may distribute analysis/report produced by its respective foreign affiliates within the StoneX Group of companies pursuant to an arrangement under Regulation 32C of the Financial Advisers Regulations Recipients should contact SFP at (65) 6309 1000 for any matters arising from, or in connection with, this webinar.
StoneX APAC Pte. Ltd. (“SAP”) (Co. Reg. No 200616676W) is regulated as a Dealer (PS20190001002) under the Precious Stones and Precious Metals (Prevention of Money Laundering and Terrorism Financing) Act 2019 for purposes of anti-money laundering and countering the financing of terrorism.
StoneX Financial (HK) Limited (CE No.: BCQ152) (“SHK”) is regulated by the Hong Kong Securities and Futures Commission for Dealing in Securities and Dealing in Futures Contracts.
StoneX Financial Pty Ltd (ACN 141 774 727) holds an Australian Financial Service License (AFSL: 345646) for Dealing in Securities, Exchange-Traded Derivatives Contracts, OTC Derivatives Contracts and Foreign Exchange Contracts, and is regulated by the Australian Securities and Investments Commission.
StoneX Securities Co., Ltd. (“SSJ”) (Co. Reg. No 010401047199) is regulated by the Japanese Financial Services Agency as a Type-I Financial Instruments Business Operator (Kanto Local Finance Bureau (FIBO)No.291’), is a member of the Financial Futures Association of Japan for dealing and broking FX and FX Option transactions, and is a member of the Japan Securities Dealers Association for dealing and broking stock indices and option transactions.
Trading swaps and over-the-counter derivatives, exchange-traded derivatives and options and securities involves substantial risk and is not suitable for all investors. Past performance of any futures or option is not indicative of future success. Indicators are not a trading system and are not published as a specific trade recommendation. The information herein is not a recommendation to trade nor investment research or an offer to buy or sell any derivative or security. It does not take into account your particular investment objectives, financial situation or needs and does not create a binding obligation on any of the StoneX group of companies to enter into any transaction with you. You are advised to perform an independent investigation of any transaction to determine whether any transaction is suitable for you. No part of this material may be copied, photocopied or duplicated in any form by any means or redistributed without the prior written consent of StoneX Group Inc.
The report/analysis herein is not directed to, or intended for distribution to or use by, any person or entity who is a citizen or resident of or located in any locality, state, country or other jurisdiction where such distribution, publication, availability or use would be contrary to law or regulation.
© 2026 StoneX Group Inc. All Rights Reserved.