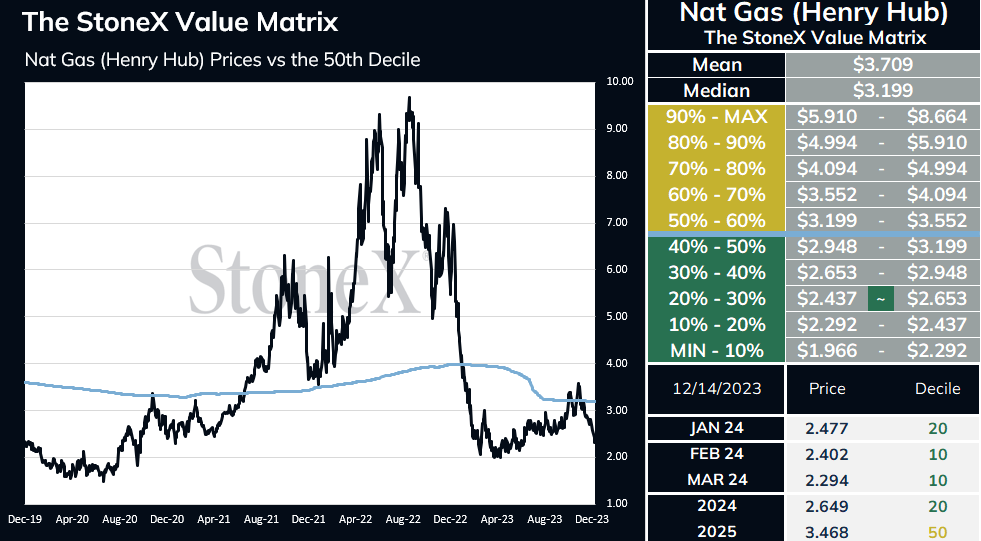
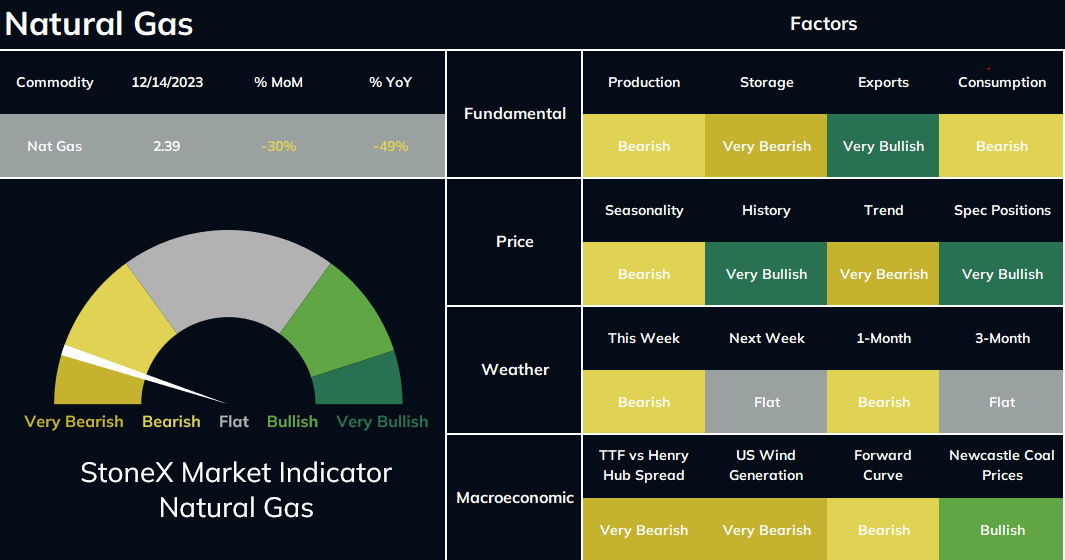
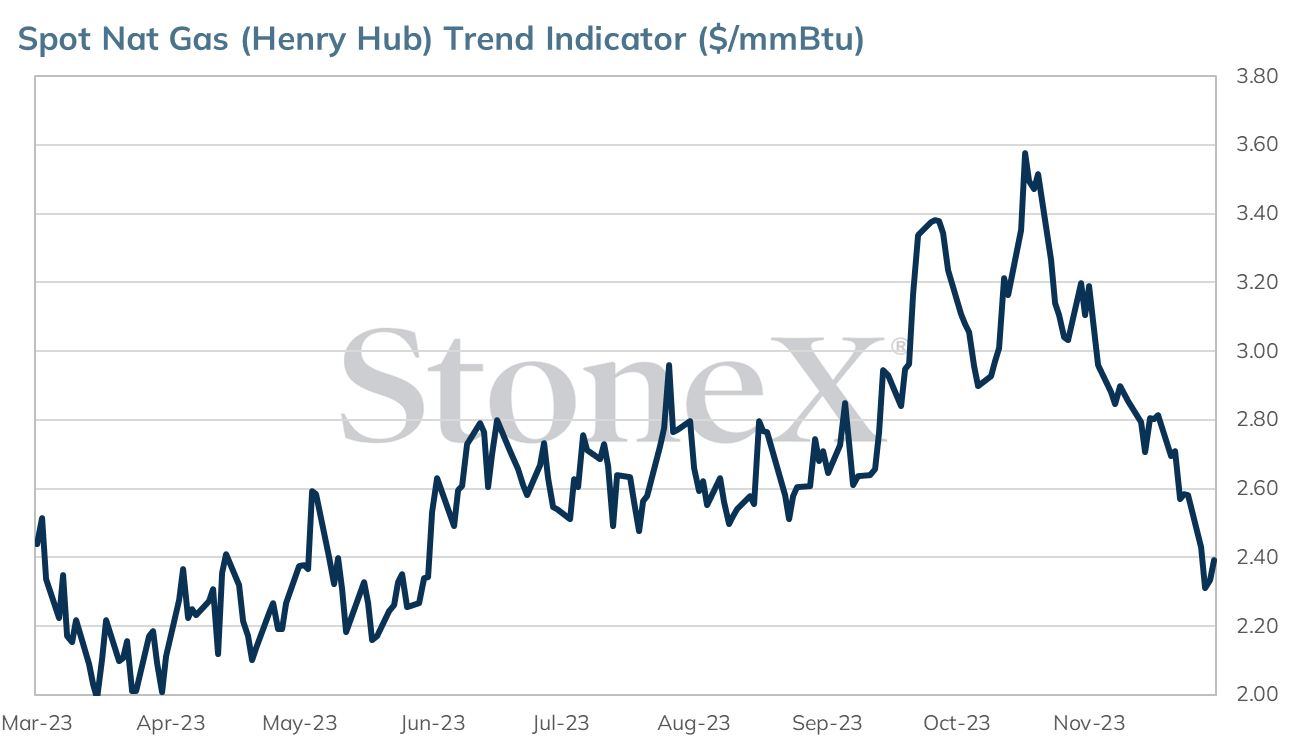
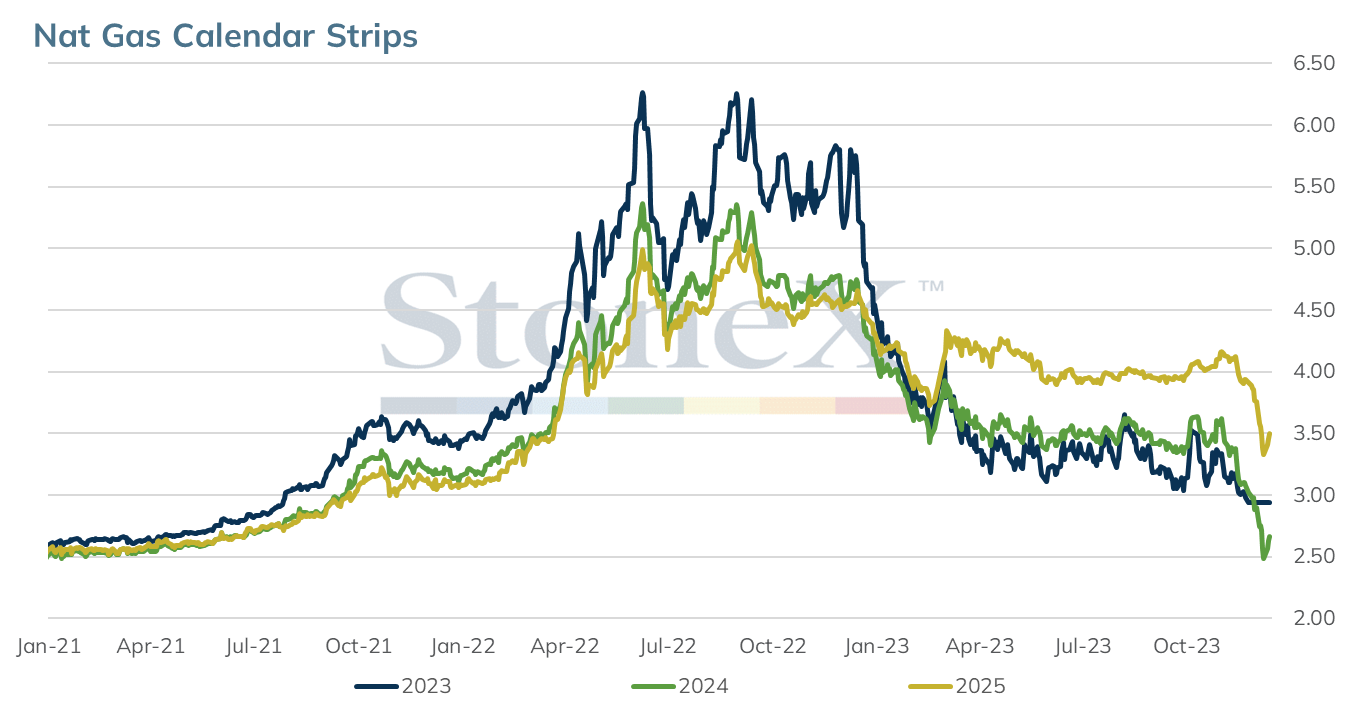
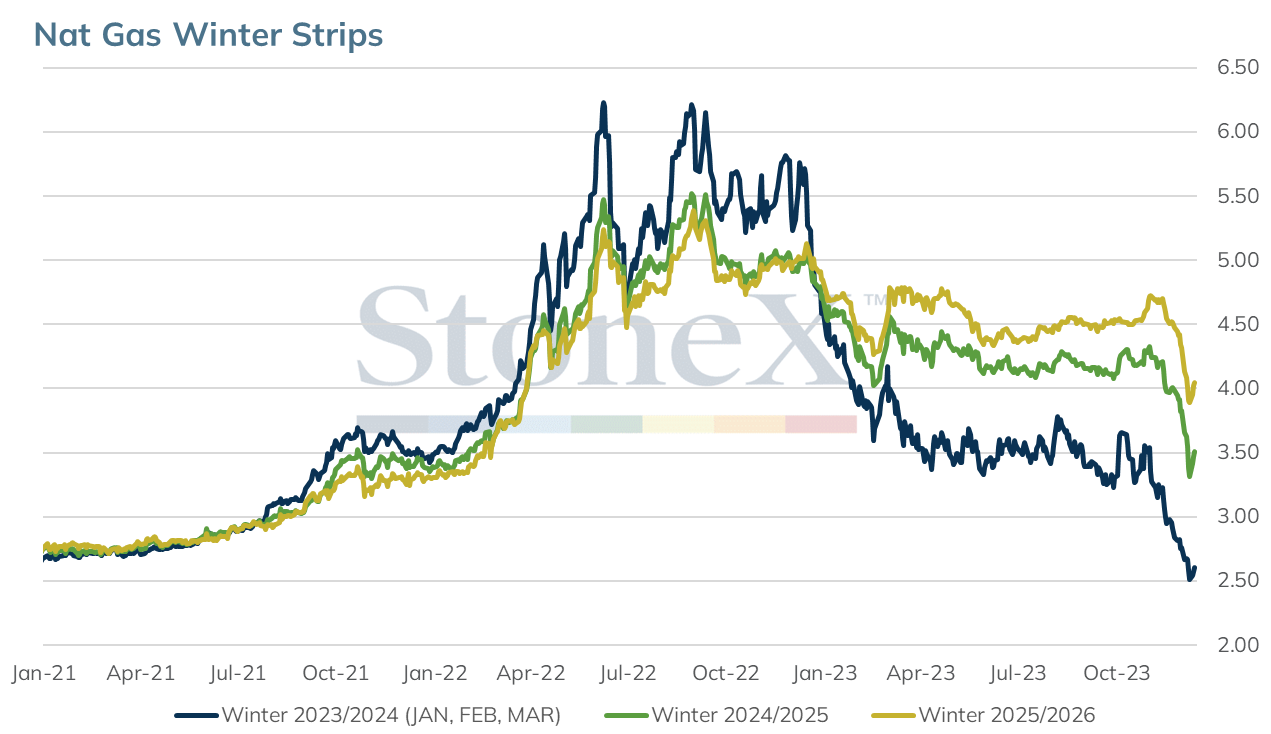
After hitting 6 month lows on Wednesday, the spot month contract settled Thursday’s trade with a small gain. While national demand has been on the lighter side, exports to Mexico are averaging 5.7 BCF/day this month given attractive US prices. This is up 0.3 BCF/day from Dec 2022. Jan futures closed yesterday's trade 6.9 cents higher at $2.40.
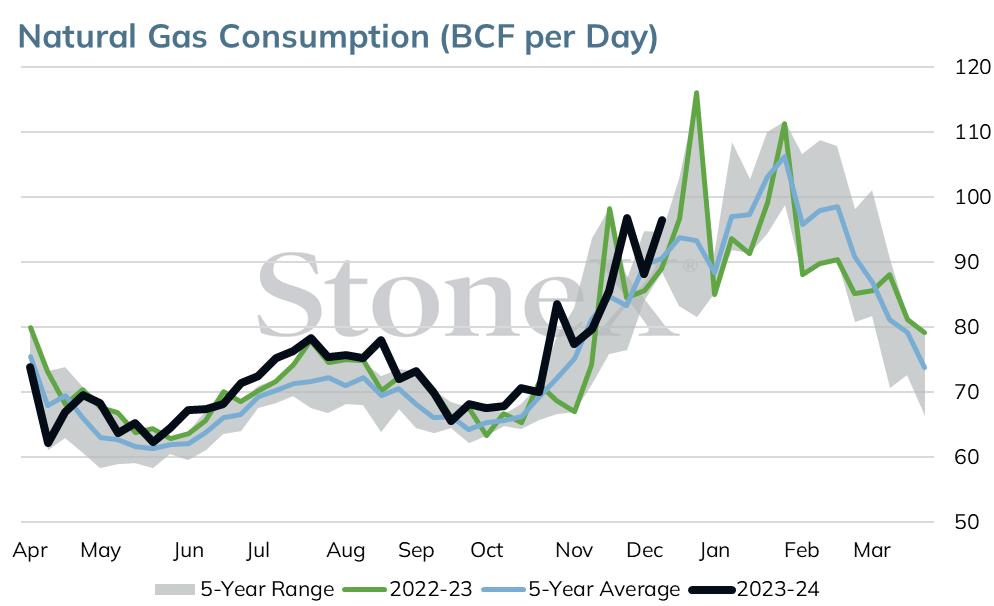
The EIA reported a withdrawal of 55 BCF for the week ended Dec 8, in line with estimates for a 54 BCF draw. The pull was much lower than the 5 yr avg draw of 81 BCF and slightly larger than last year’s draw of 46 BCF. Total gas in storage stands at 3.664 TCF, 260 BCF above the 5 yr avg and 245 BCF above last year. Demand last week fell by nearly 9.6 BCF/day amid lower heating needs and small declines in power and industrial demand. Output last week remained firm at 105 BCF/day.
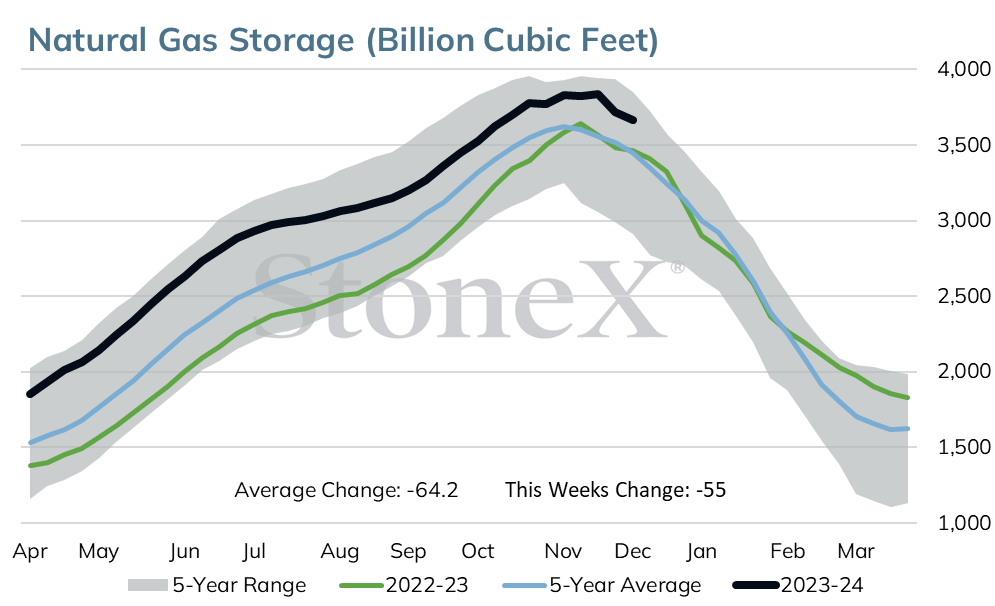
The week in progress has seen a slight rebound in demand, which is widely expected to result in a larger withdrawal. Platts is calling for a draw in the 88 to 95 BCF range which compares to the 5 yr avg draw of 107 BCF and last year’s draw of 82 BCF.
Over the next week, res/comm usage is expected to average 34.6 BCF/day, trailing the 5 yr avg by 6.8 BCF/day. Mild temps are also expected to continue over the next 2 weeks. The north and central Plains, Rockies and Midwest have the strongest probability for above normal temps.
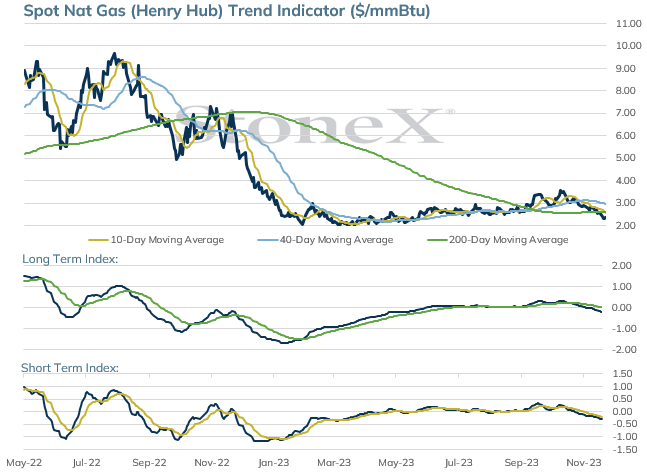
The January 24 natural gas contract is on course for a 6th consecutive lower weekly settle but has closed up the past two sessions.
After settling at 2.392 on Thursday the January contract is currently up another .040 today as it nears a key area of resistance.
This resistance near the 2.500 area is 10 day moving average on the daily continuation chart and trend line resistance beginning at the early-November high on the 60 minute chart.
If 2.500 resistance is reached and holds, the primary trend will remain down.
2.235 is weekly low support followed by 2.150, the final 88% retracement of the April-October uptrend.
If 2.500 resistance is broken, the 200 day moving average at 2.615 will become the next upside objective.
Moving Average Alignment – Neutral-Bearish
Long Term Trend Following Index – Bearish
Short Term Trend Following Index – Bearish
Relative Strength Index – 33.50
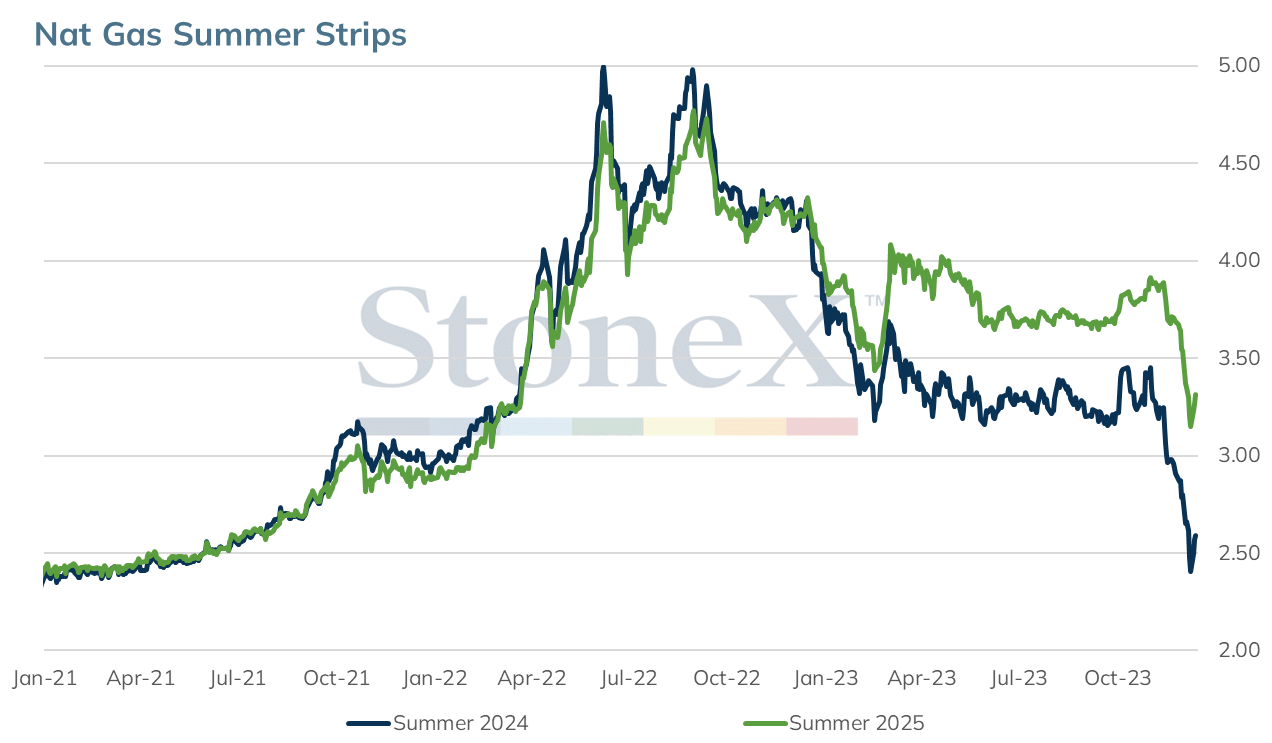
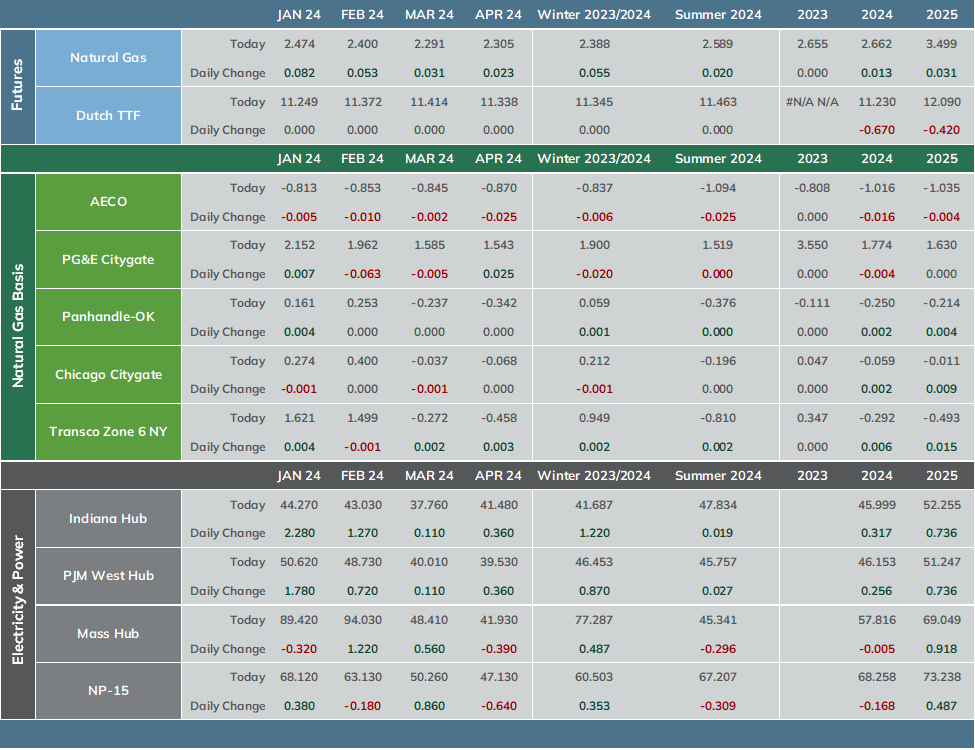
The StoneX Market Indicator provides an overall view of market sentiment for a commodity based on the quantification of fundamental, technical and historical market data related to that commodity. Each factor is quantified by comparing data for the current period versus last year, versus the previous period, versus its history and versus the yearly average. This quantification is converted to a number and summed together. The sum of all factors are reweighted by the 4-year decile of its history. The 4-year deciles redistribute the StoneX Market Indicator to obtain an equal share between the bullish and the bearish signals. The StoneX Market Indicator History graphically represents each day’s actual very bearish to very bullish signal. This history contains the sum of all factors, excluding weather forecasts
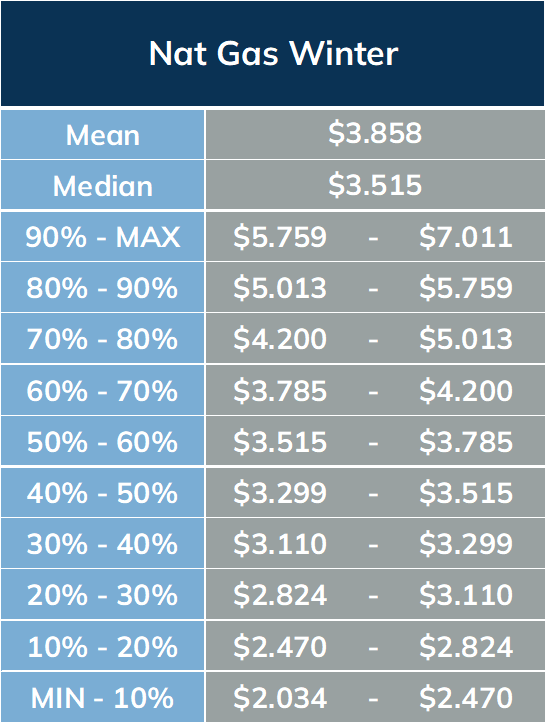
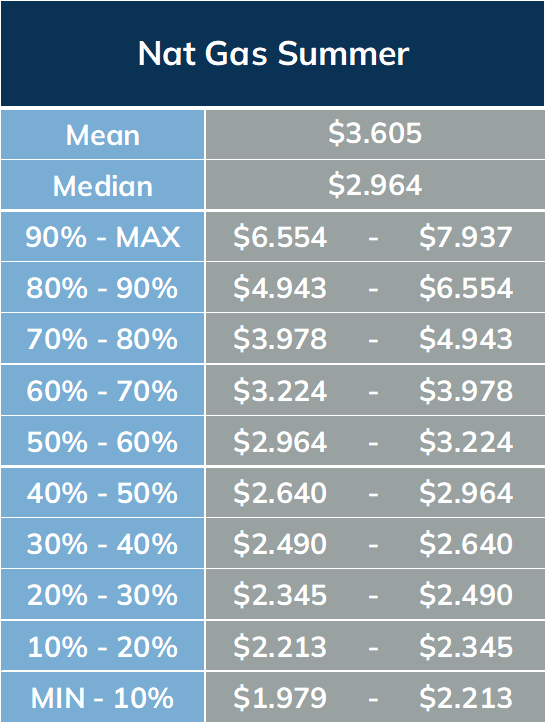
The StoneX Value Matrix provides a measure of historical value by analyzing 4 years historical price data distributed into 10 deciles. All of the years are weighted at 20% with the exception of the most recent year which is weighted at 40%. The prices are adjusted for inflation using the Producer Price Index (PPI).
This communication includes data and analytics supplied by Precipice Analytics. Stonex does not own, control, create, or author this data and has not independently verified its accuracy. Stonex does not endorse its use for anything other than informational purposes. You are advised that Precipice Analytics technology may be protected by intellectual property and other rights that prohibit the unauthorized use and dissemination of the information contained herein.
Reproduction or use in any format without authorization is forbidden. © Copyright 2023. All rights reserved.