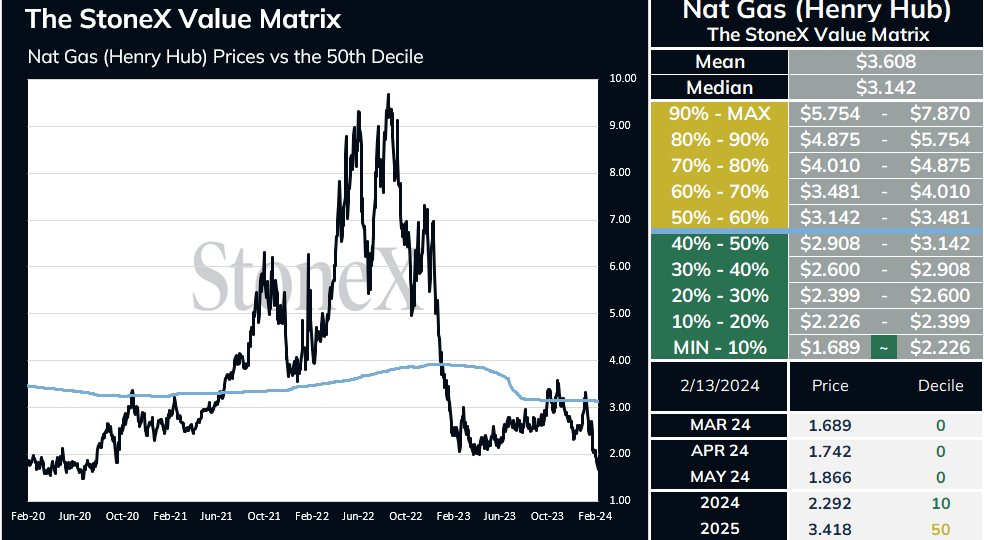
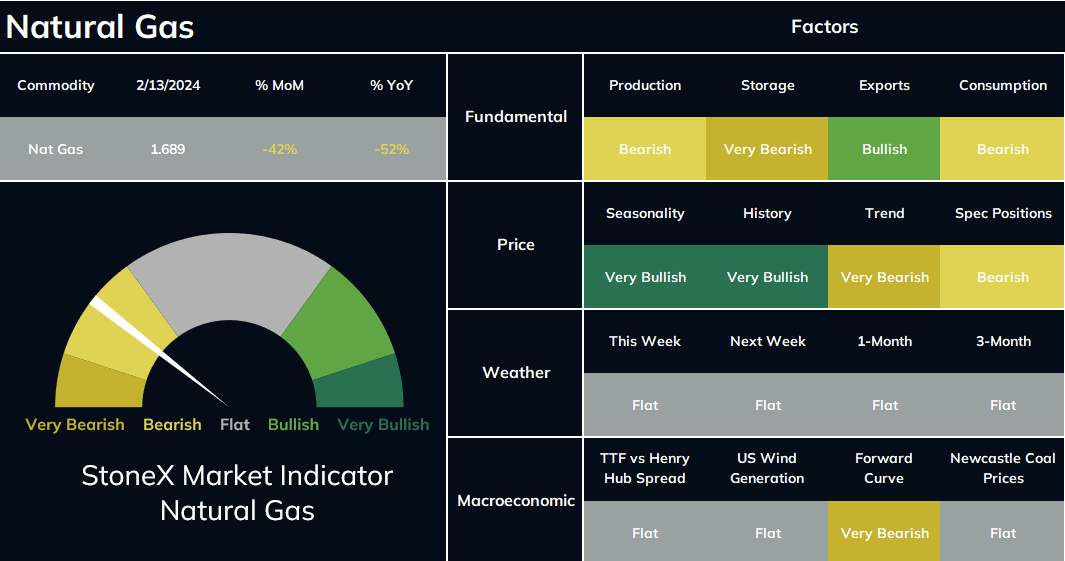
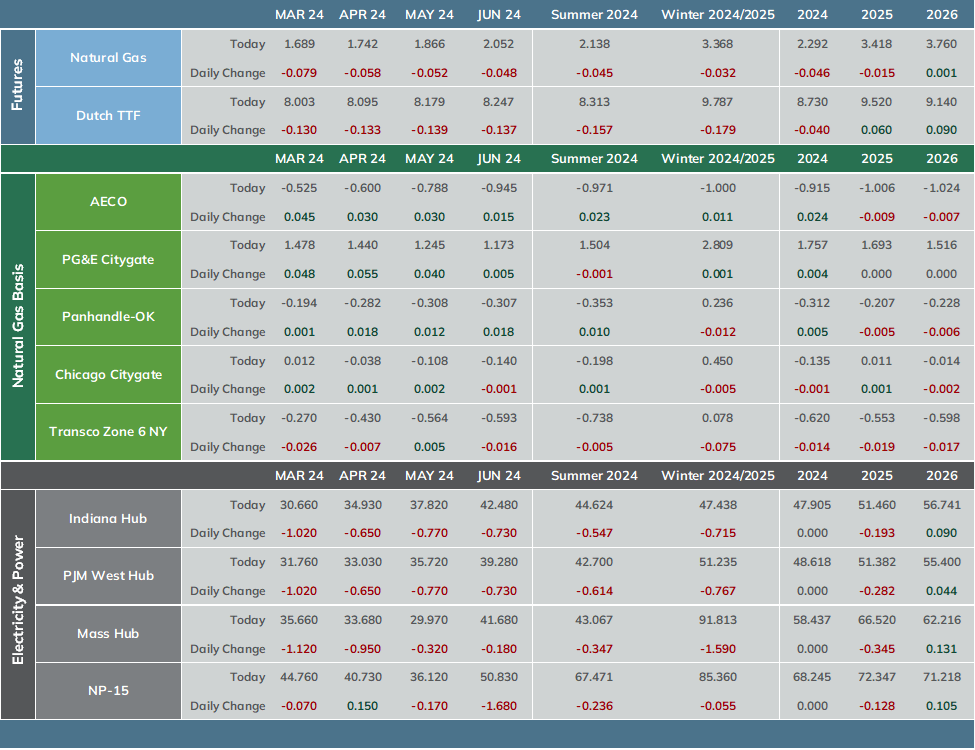
The nat gas market continued to selloff during Tuesday’s trade, pushing the spot month down to fresh lows 3 ½ yr lows. Mostly mild weather conditions later this month along with strong output and elevated supply levels remain in play. The longer term impact of mild late winter weather is adding further downward momentum. Mar futures settled 7.9 cents lower at $1.689 while the Apr contract remains at a 5 cent premium.
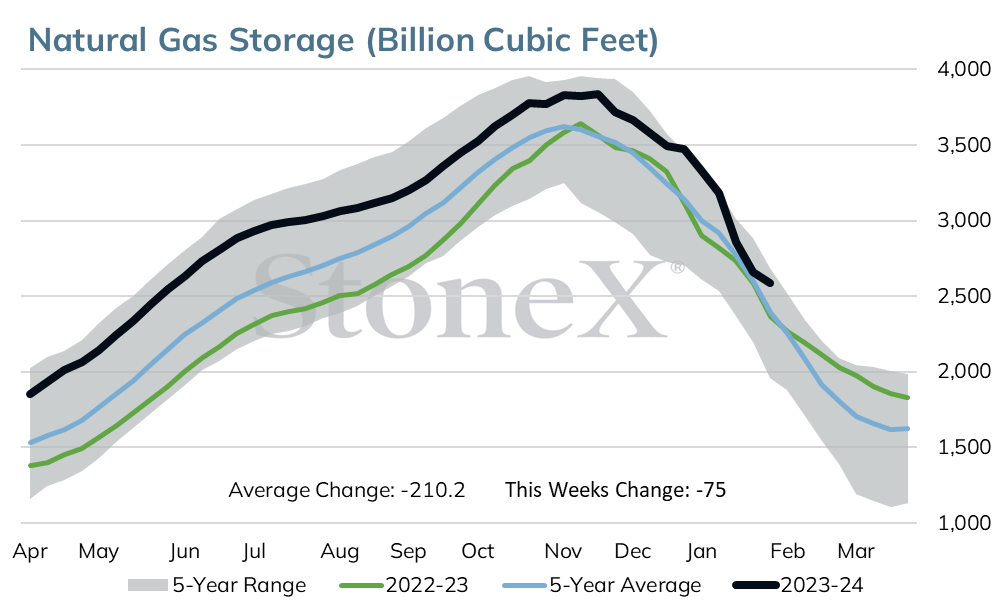
Mild weather, low demand and recovering output leave storage levels on track to rise by lower than normal levels over the coming few weeks. Tomorrow’s report for the week ended Feb 9 is projected by Platts to show a draw of 71 BCF which is less than half the 5 yr avg draw of 149 BCF and lower than last year’s pull of 117 BCF. Compared to the week ended Feb 2, total demand fell by nearly 2 BCF/day while output climbed about 1 BCF/day.
Another bearish draw of 61 BCF is expected for the week in progress which could ultimately widen the surplus to more than 400 BCF. demand is currently at 13.8 BCF/day.
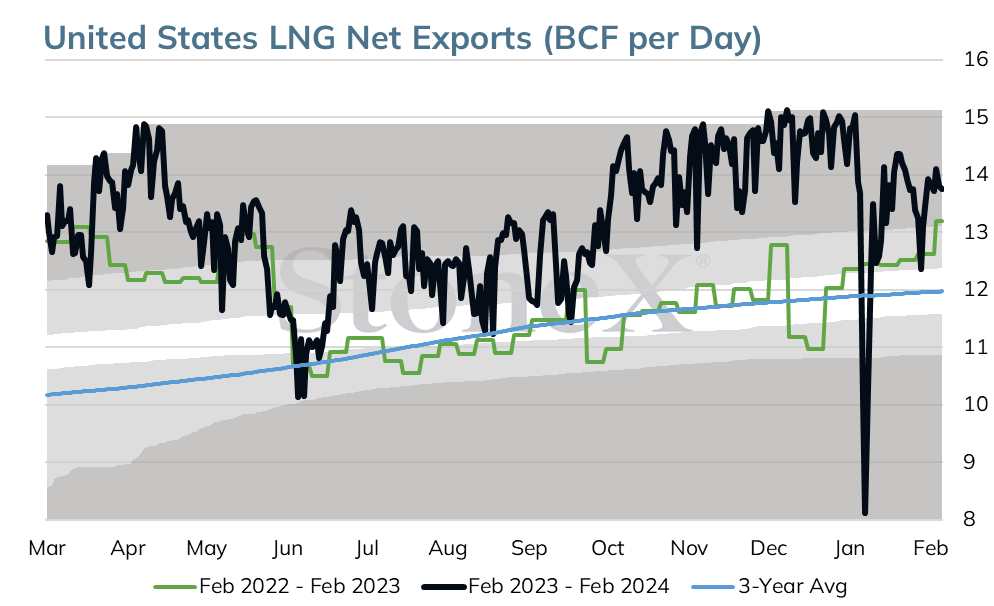
LNG feedgas demand is back below 14 BCF/day, coming in this morning at 13.8 BCF/day. Platts projects feedgas demand will remain at this level over the next 2 weeks. Reduced liquefaction at Freeport LNG has pushed LNG exports down to an average of 13.6 BCF/day so far this month, 0.3 BCF/day lower than January. Freeport LNG is still anticipated to return to service later this month.
Bearish fundamentals continue to weigh on the gas market this morning. Weather models overnight shifted slightly warmer but a brief cold spell is still expected this weekend into next week.
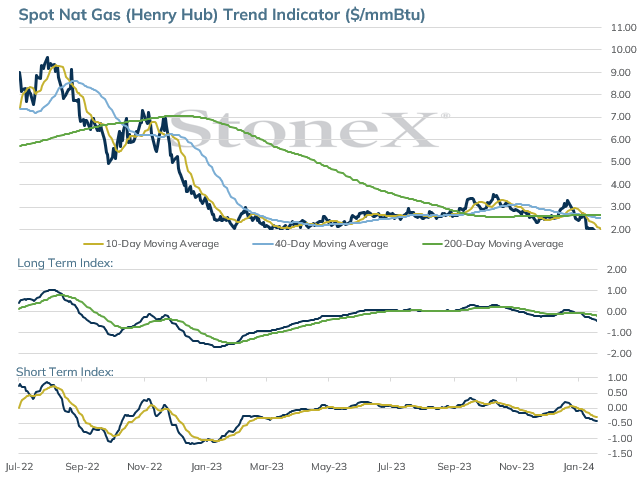
The March 24 natural gas contract has traded lower in six consecutive sessions after closing under the 2.000 level for the first time since 2020.
The March contract has lost .158 (8.5%) this week closing Tuesday at 1.689 as it nears a key area of support.
This support begins at the March 2023 low at 1.611 extending down to 1.550 which is 60 minute chart trend line support which has been in place from the January high.
Long term monthly low support areas are 1.432 from June 2020 and 1.250 from January 1995.
Daily trading volume which had been relatively high near the 250,000 contract level in three prior sessions moved up to 286,586 on Tuesday. Volume levels tend to rise near market highs or lows.
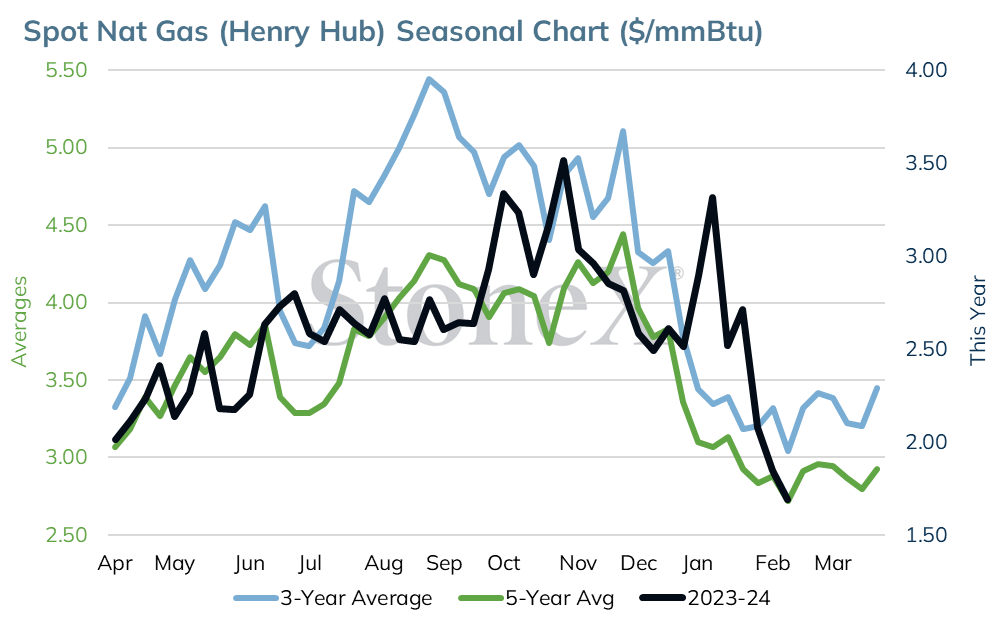
While there is no sign of a low being in place, the seasonal trend for natural gas favors a post-winter low being set in upcoming trade. During 7 out of the past 8 years (2022 the exception), a post-winter low has been set in February or March. In each year, it was the low price point for that year.
Moving Average Alignment – Bearish
Long Term Trend Following Index – Bearish
Short Term Trend Follow Following Index - Bearish
Relative Strength Index - 26.36 (in oversold territory)
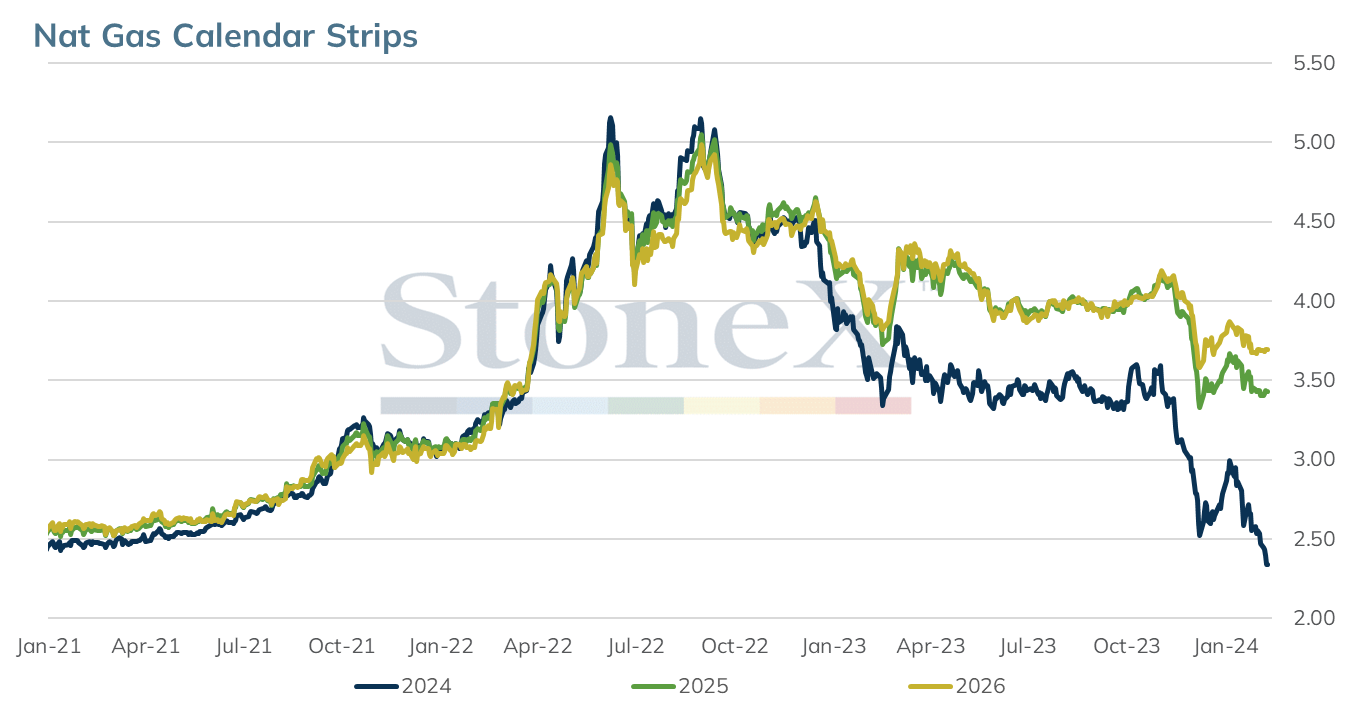
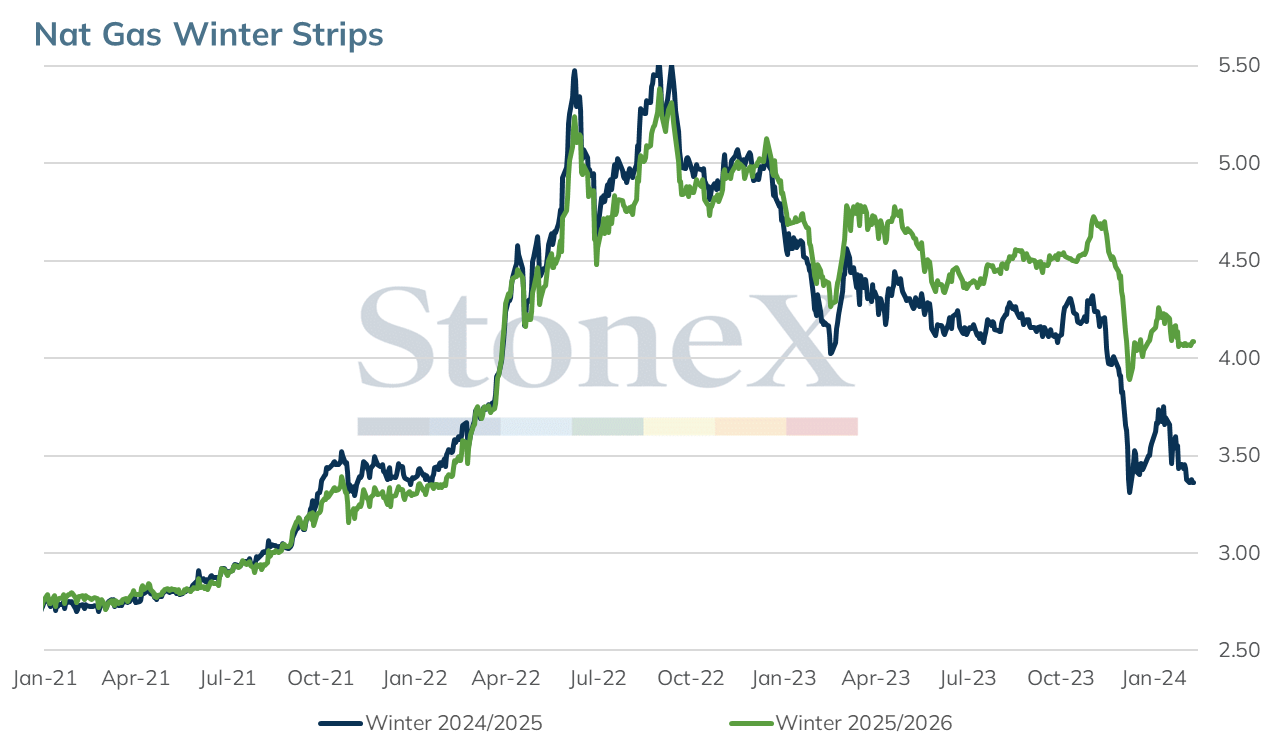
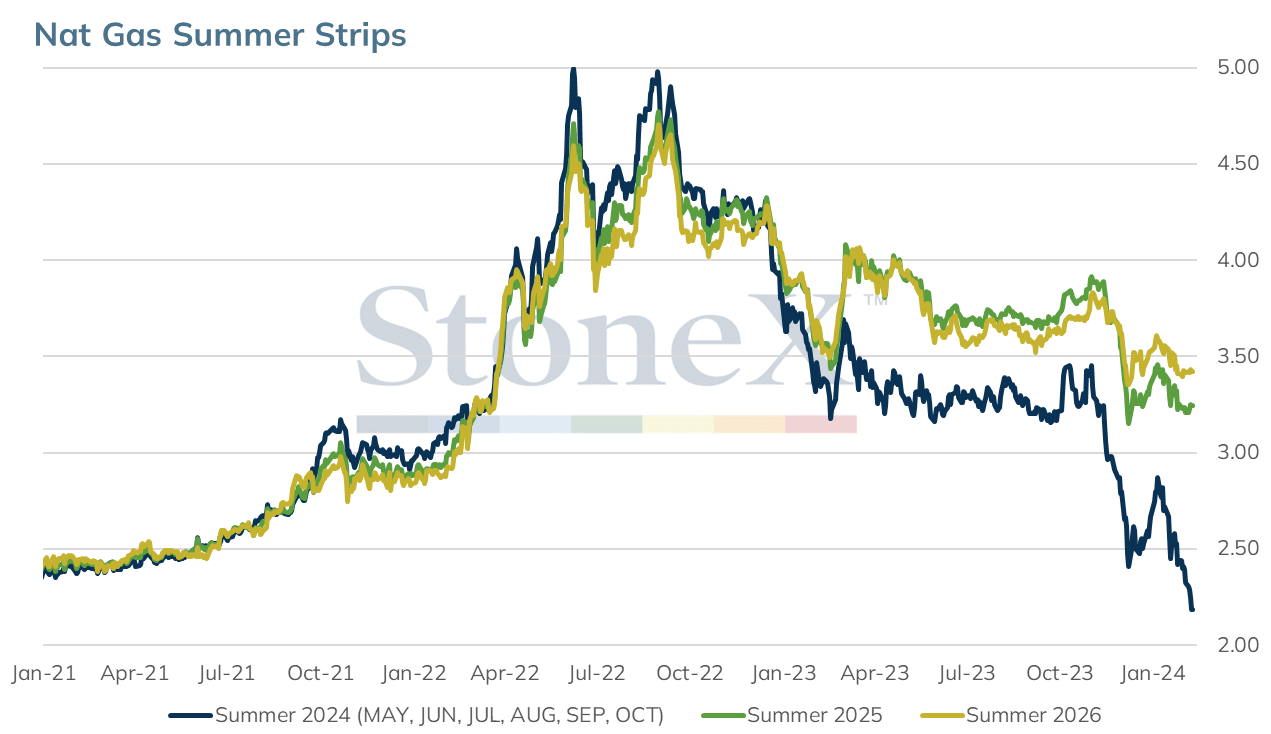
The StoneX Market Indicator provides an overall view of market sentiment for a commodity based on the quantification of fundamental, technical and historical market data related to that commodity. Each factor is quantified by comparing data for the current period versus last year, versus the previous period, versus its history and versus the yearly average. This quantification is converted to a number and summed together. The sum of all factors are reweighted by the 4-year decile of its history. The 4-year deciles redistribute the StoneX Market Indicator to obtain an equal share between the bullish and the bearish signals. The StoneX Market Indicator History graphically represents each day’s actual very bearish to very bullish signal. This history contains the sum of all factors, excluding weather forecasts.
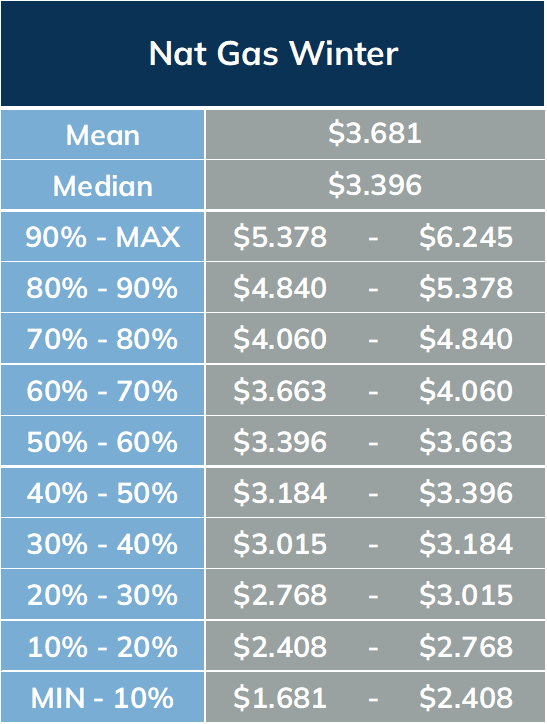
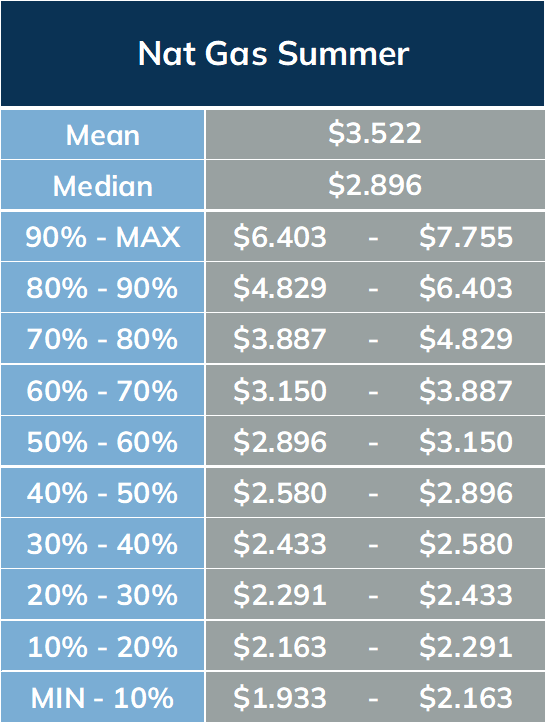
The StoneX Value Matrix provides a measure of historical value by analyzing 4 years historical price data distributed into 10 deciles. All of the years are weighted at 20% with the exception of the most recent year which is weighted at 40%. The prices are adjusted for inflation using the Producer Price Index (PPI).
Reproduction or use in any format without authorization is forbidden. © Copyright 2024. All rights reserved.