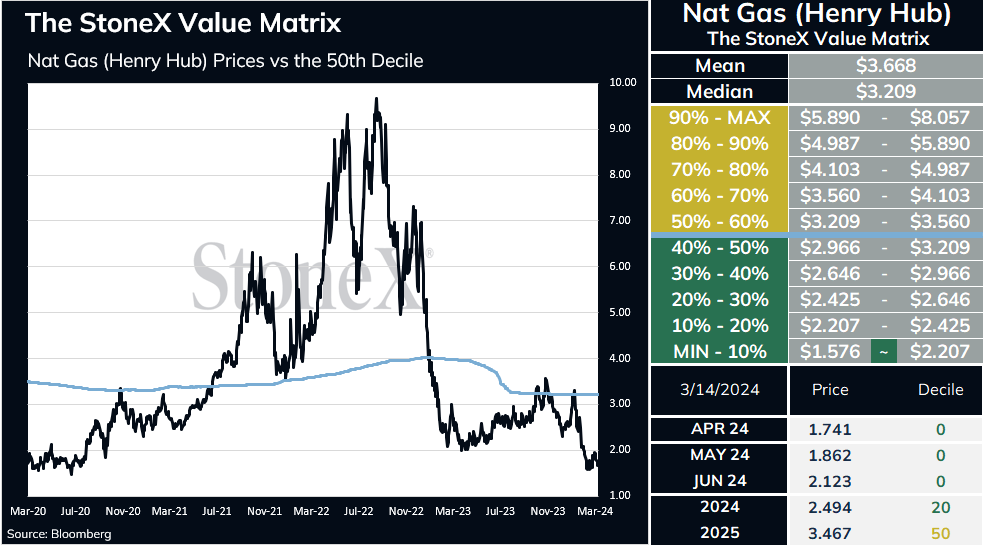
Ending 6 straight losing sessions, Apr nat gas rebounded yesterday. Prices added onto early morning gains following slightly supportive storage data and climbed further in the afternoon on signs that Freeport LNG could soon be restarting Train 3 as repairs have concluded. Apr futures rose 8.3 cents to settle at $1.741.
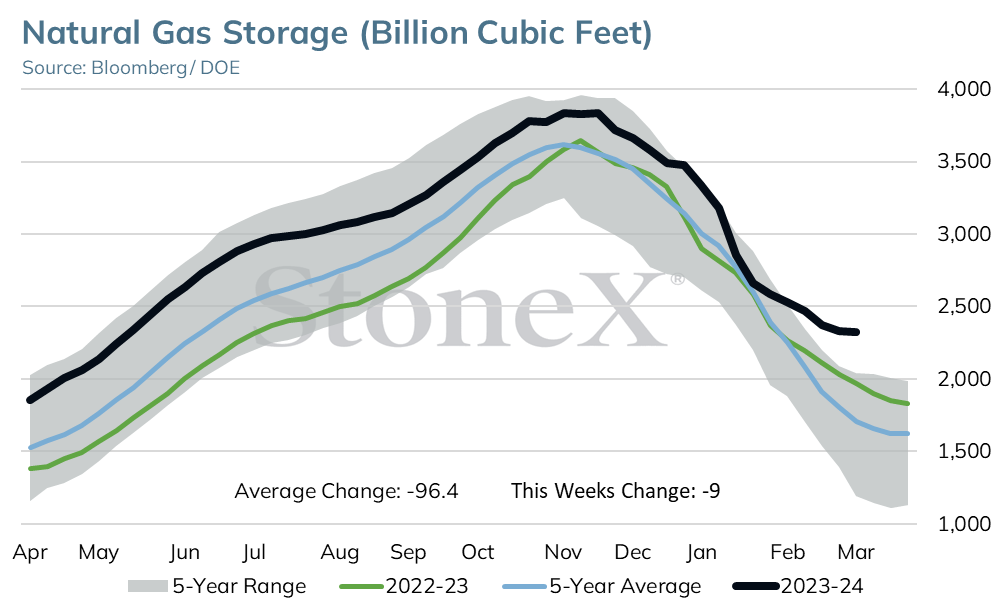
The EIA reported another well below normal withdrawal yesterday of 9 BCF for the week ended March 8, leaving total gas in storage at 2.325 TCF. The draw came in 6 BCF higher than expected but was far lower than the 5 yr avg draw of 87 BCF and lower than last year’s pull of 65 BCF. Stocks are now 629 BCF, or 37%, above the 5 yr avg and 336 BCF, or 17%, higher than last year.
The surplus appears likely to grow further in the coming weeks. Analysts are currently forecasting a net injection between 4 and 17 BCF for the week ending Mar 15, which compares to the 5 yr avg draw of 42 BCF.
Weather updates this morning suggest late March will not be as cold as expected earlier in the week across the Rockies and Plains. Below normal temps will still dominate much of the Northern tier of the US. The 11-15 day period shows below normal temps across the West while normal to above normal temps encompass the East.
After falling below 96 BCF/day yesterday, total demand has risen this morning to an estimated 102.3 BCF/day. The increase stems mostly from a 5 BCF/day rise in res/comm usage to 24 BCF/day. LNG feedgas demand has fallen below 13 BCF/day while output has been consistently below 103 BCF/day since Monday.
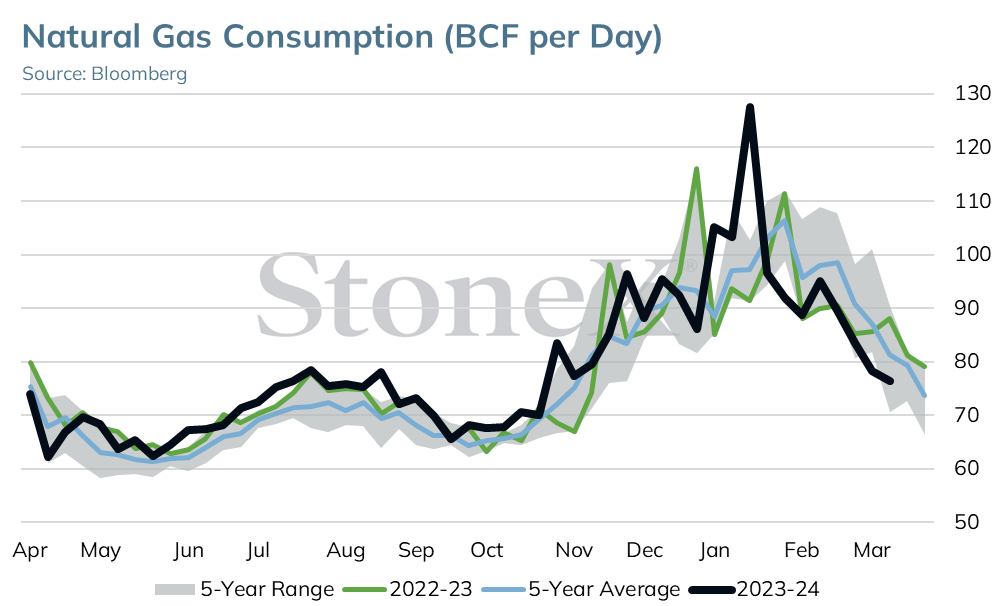
Despite reports that Freeport LNG’s 3rd train is close to restarting, prices are currently trading lower as strong wind generation is causing less reliance on natural gas.
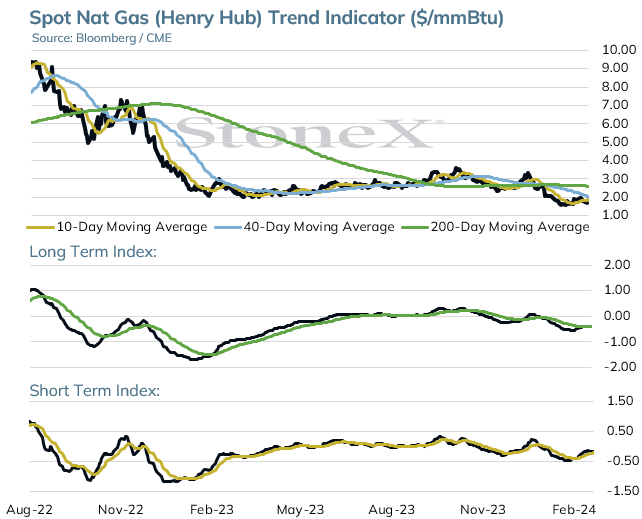
The spot April 24 natural gas contract gained .083 on Thursday closing at 1.741, ending a 6-day run of consecutively lower closes.
The April contract has been unable to breakout above 10 day moving average resistance at the 1.805 level today. This keeps the near term trend sideways to down.
Weekly low support is at 1.643 followed by the 1.511 late-February low. Whether or not this support can hold will be an important test of underlying support.
If the April contract can hold above 1.511 as support. A post-winter seasonal low should be in place.
A breakout above the 10 day moving average at 1.805 will turn the 40 day moving average currently at 1.944 into the next area of resistance.
Trend following indexes are in a bullish alignment but 10, 40 and 200 day moving average alignment remains bearish offering a mixed technical outlook.
Moving Average Alignment – Bearish
Long Term Trend Following Index – Bullish
Short Term Trend Follow Following Index - Bullish
Relative Strength Index - 43.32
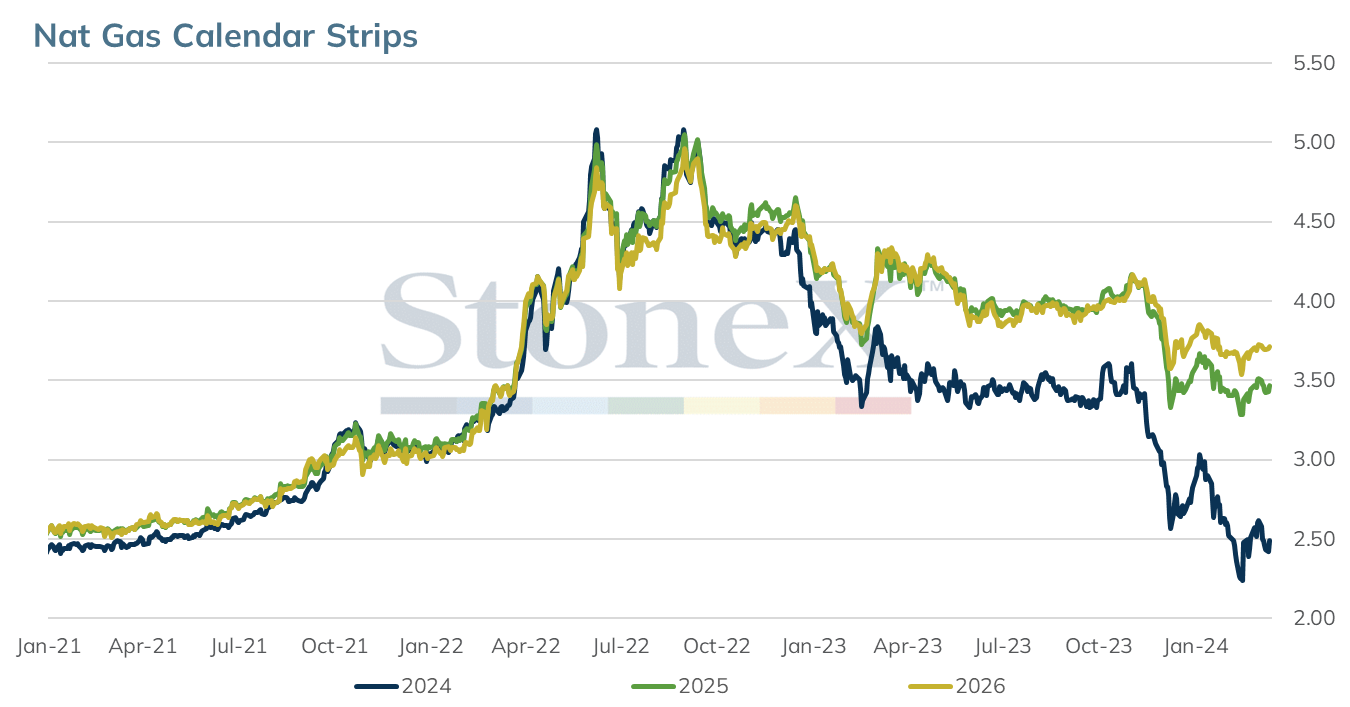
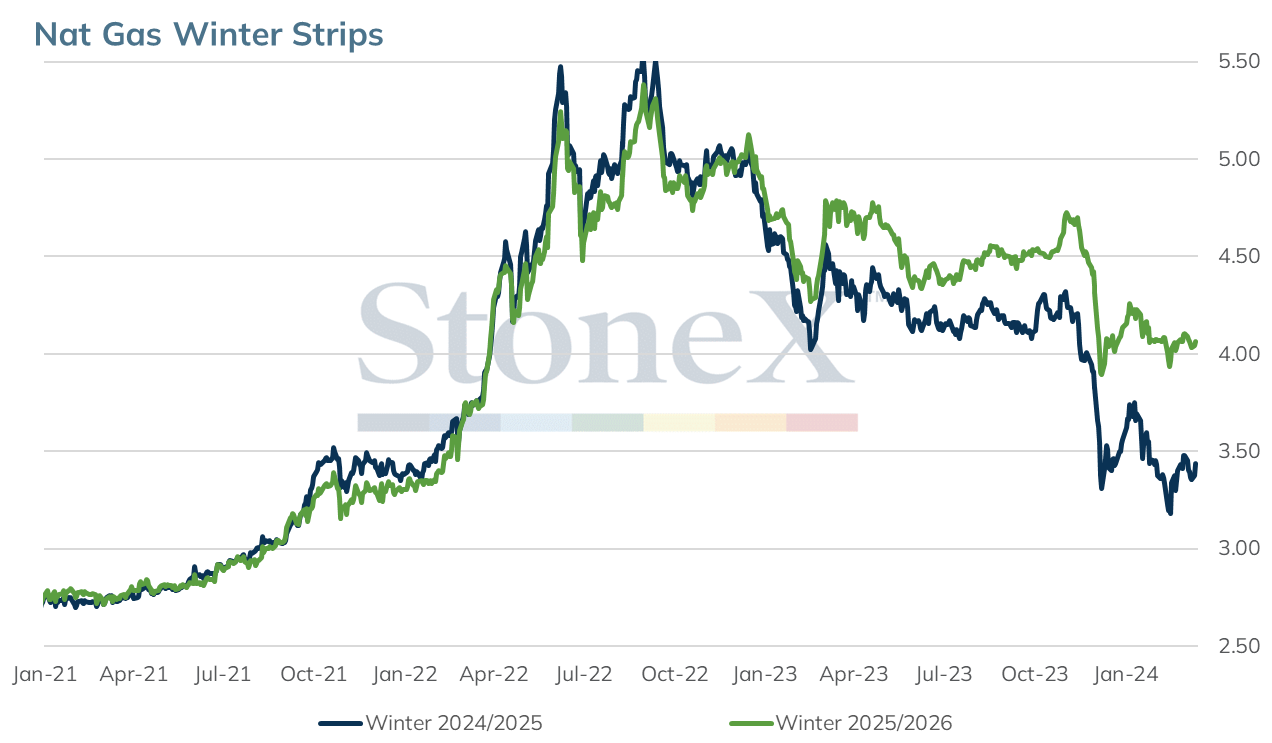
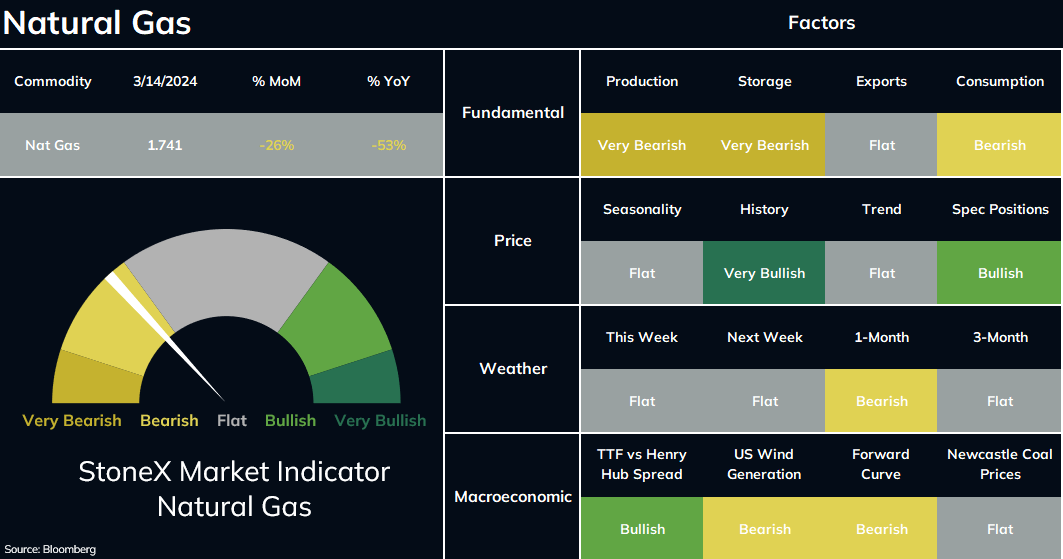
The StoneX Market Indicator provides an overall view of market sentiment for a commodity based on the quantification of fundamental, technical and historical market data related to that commodity. Each factor is quantified by comparing data for the current period versus last year, versus the previous period, versus its history and versus the yearly average. This quantification is converted to a number and summed together. The sum of all factors are reweighted by the 4-year decile of its history. The 4-year deciles redistribute the StoneX Market Indicator to obtain an equal share between the bullish and the bearish signals. The StoneX Market Indicator History graphically represents each day’s actual very bearish to very bullish signal. This history contains the sum of all factors, excluding weather forecasts.
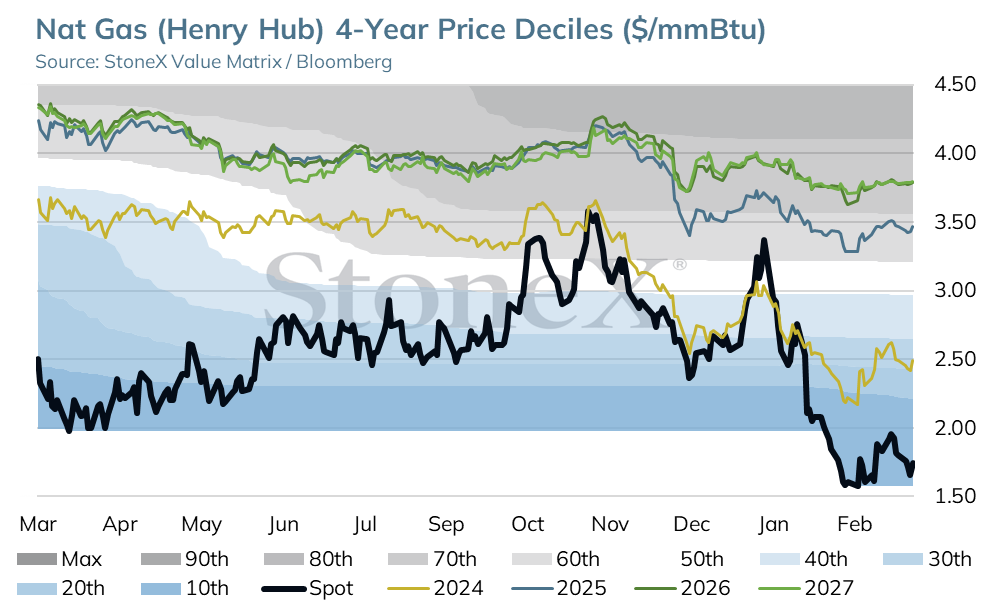
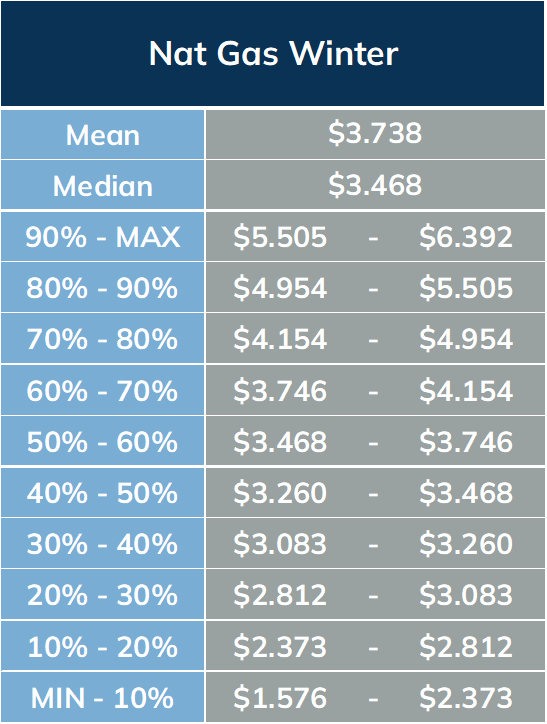
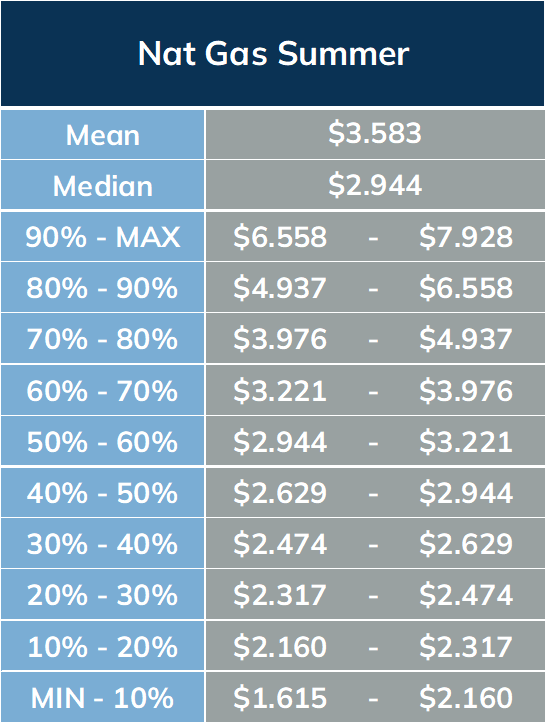
The StoneX Value Matrix provides a measure of historical value by analyzing 4 years historical price data distributed into 10 deciles. All of the years are weighted at 20% with the exception of the most recent year which is weighted at 40%. The prices are adjusted for inflation using the Producer Price Index (PPI).
Reproduction or use in any format without authorization is forbidden. © Copyright 2024. All rights reserved.