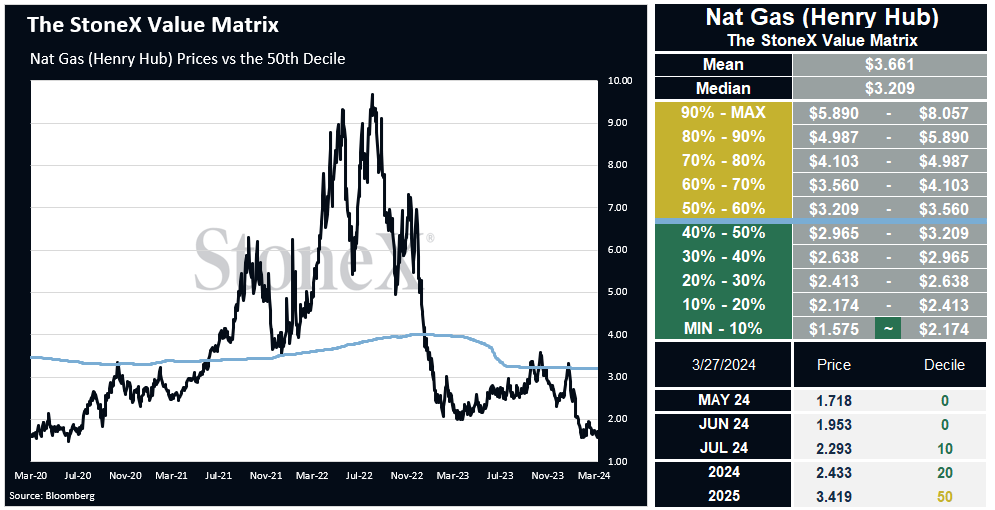
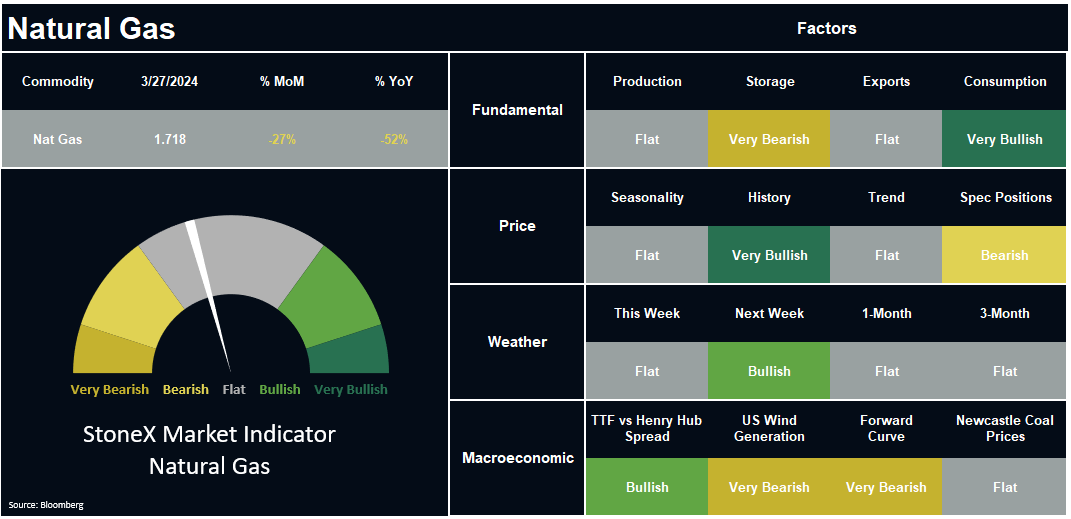
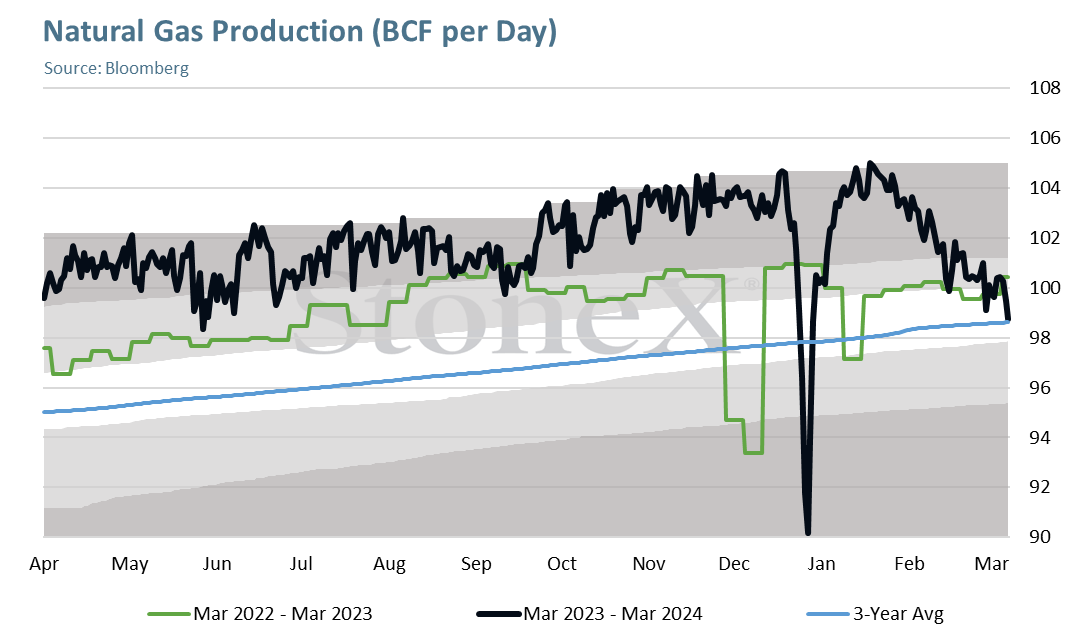
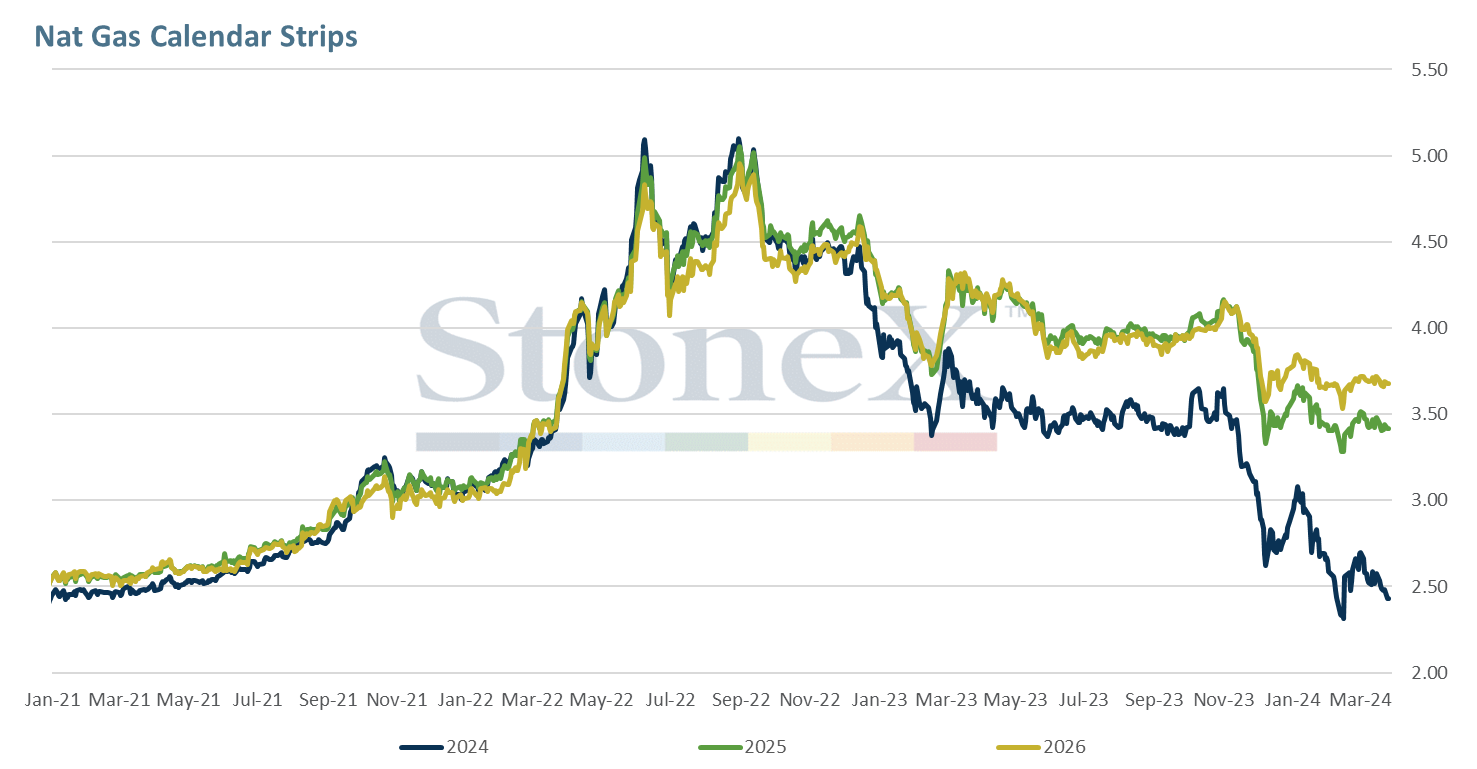
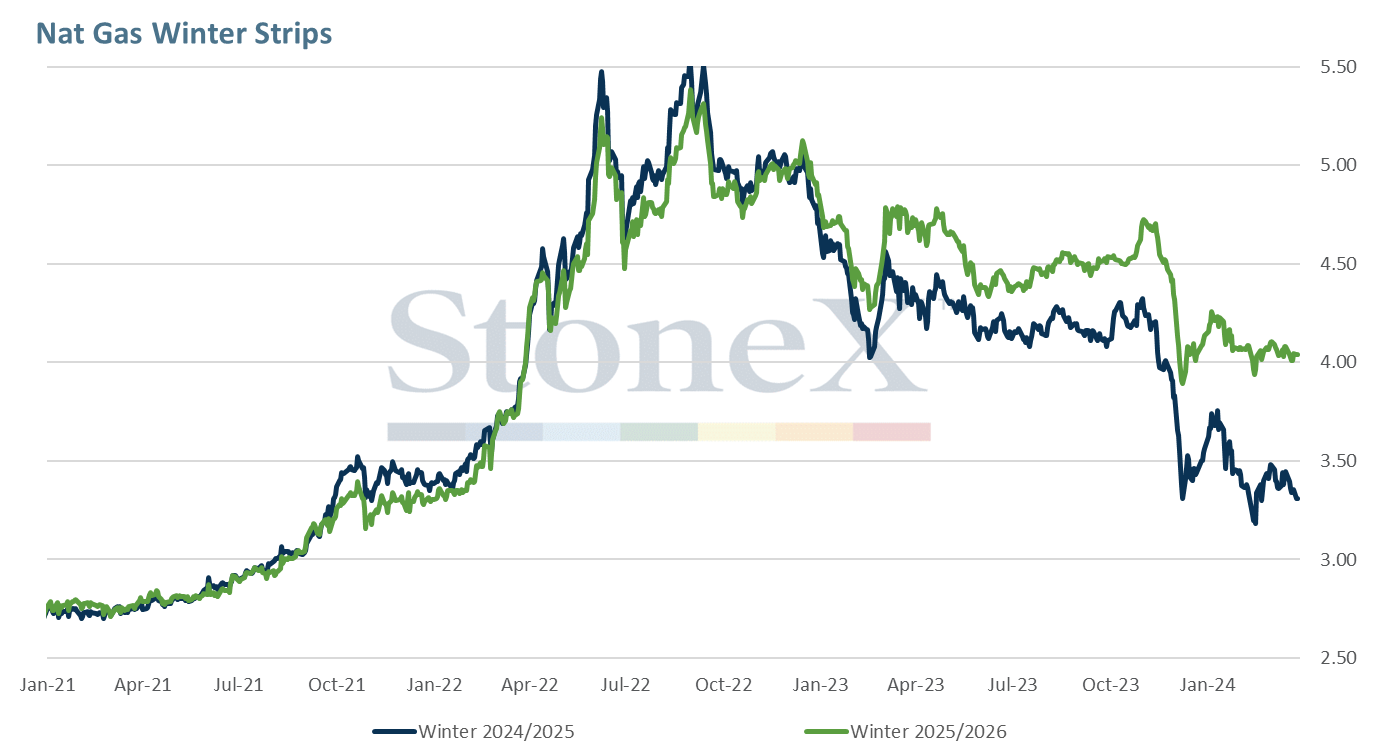
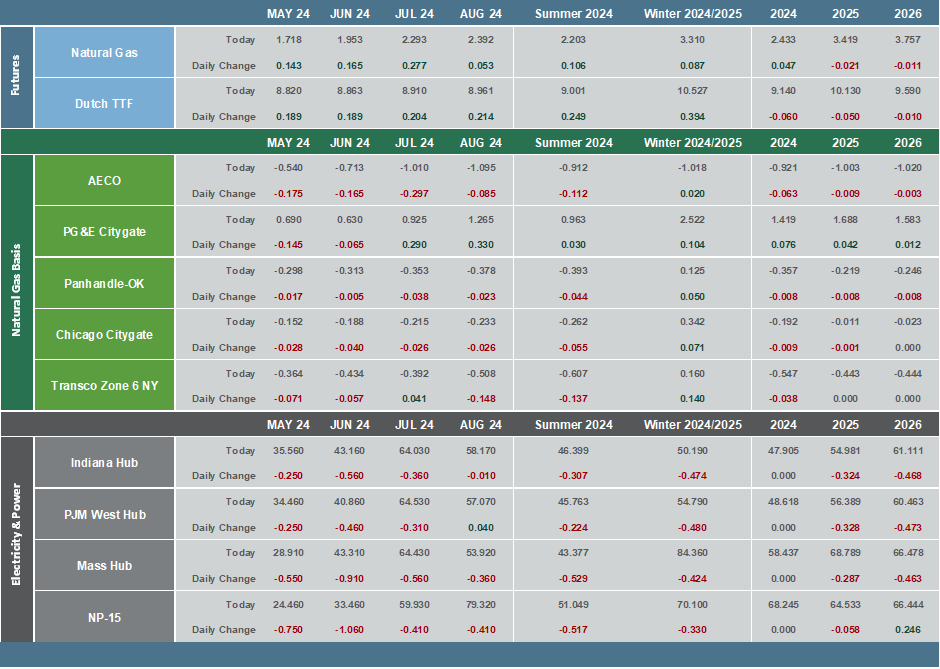
On its first day as spot month, May NG settled lower amid the continuation of abundant supply and low demand. Res/comm usage slid yesterday by more than 3 BCF/day while feedgas volumes also declined slightly to 12.4 BCF/day. May futures settled 7 cents lower at $1.718.
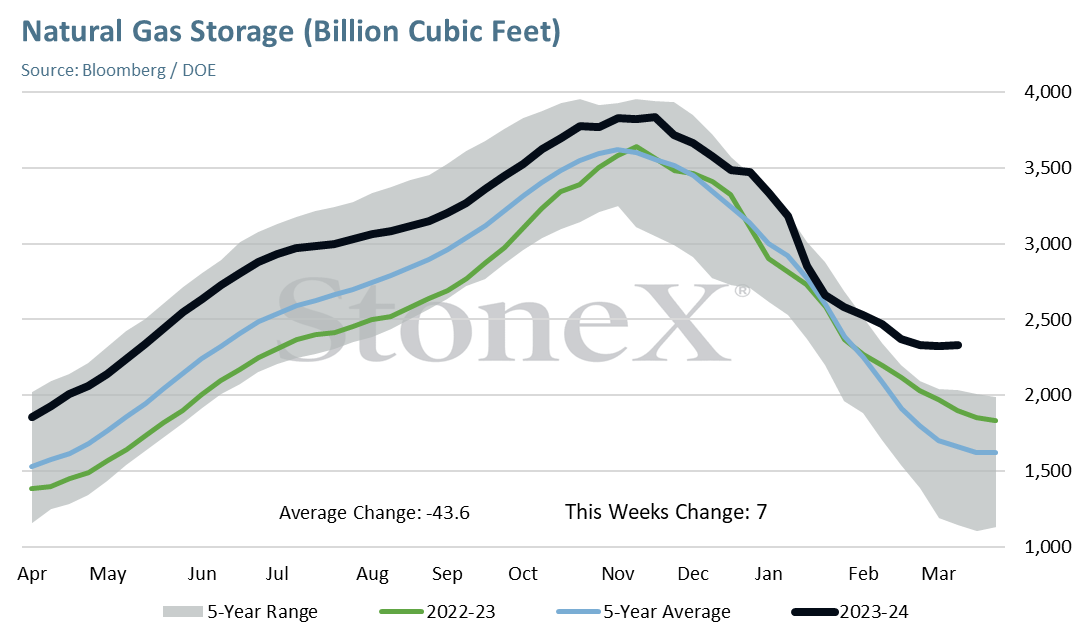
Last week’s cold front helped tighten the supply/demand balance by about 9.6 BCF/day for the week. Cooler temps are prompting a switch back to withdrawals following the previous week’s unseasonable injection. Storage levels are expected to fall by 28 BCF in the week ended March 22. This compares to last year’s pull of 55 BCF and the 5 yr avg pull of 27 BCF.
With cooler temps persisting this week across much of the South and West, the surplus is likely to narrow heading into April. Platts is calling for a pull of 38 BCF for the week in progress. This would exceed the 5 yr avg draw of 1 BCF and last year’s draw of 29 BCF.
Temperature variability is expected in the 6-10 day period outlook although readings should average within a few degrees of normal overall. The 11-15 day period is trending warmer with above normal temps likely across the East with much above normal temps in the Midwest pulled out HDDs for April.
This year’s Atlantic hurricane season is expected to be an active one given sea surface temps are well above average. Accuweather is forecasting a higher than normal 20 to 25 named storms with a 10-15% chance for 30 or more named storms. Eight to 12 hurricanes are expected of which 4 to 7 could be major. Direct US impacts are also expected to be above normal.
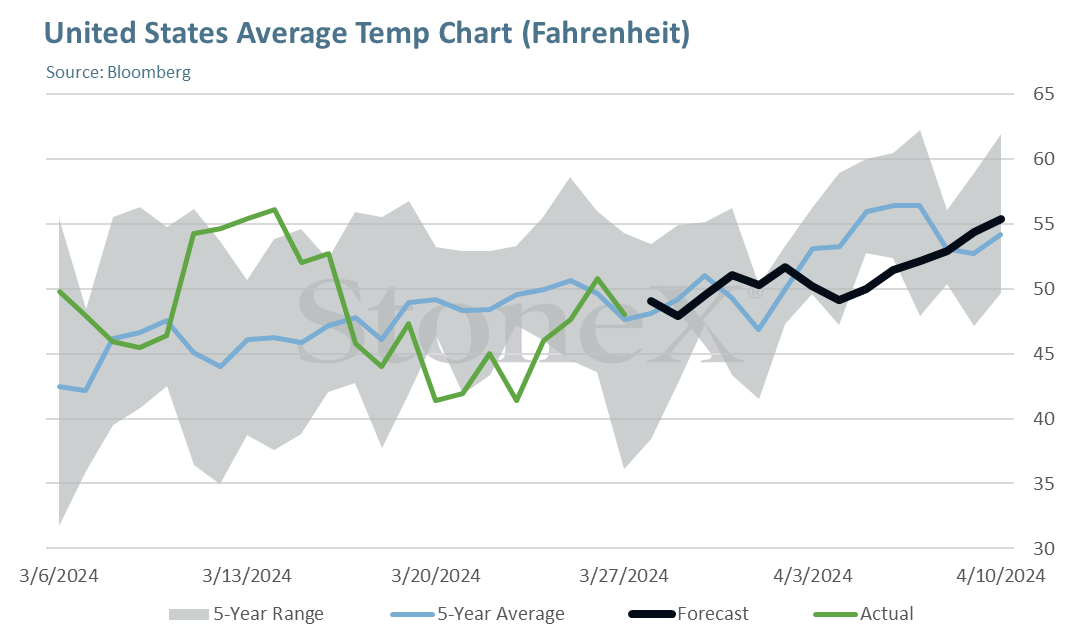
Prices are edging higher this morning as storage data is expected to come in near normal. Forecasts underwent small changes overnight in terms of demand but a big warm up is expected for the 2nd week of April.
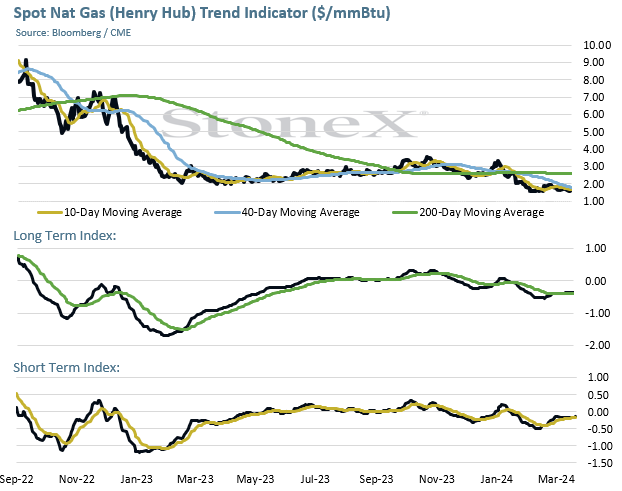
The new front month May 24 natural gas contract lost .070 on Wednesday to close at 1.718 but is finding buying interest today after reaching 10 day moving average support.
The open gap between 1.630-1.750 on the daily continuation chart created during the April 24 contract expiration was partially closed as the May contract bottomed out at 1.686 morning low.
The 10 day moving average at 1.680 held as support overnight leading to light buying interest in today’s early trade.
If 10 day moving average support is broken, the bottom of the gap at 1.630 and the 1.481-1.511 lows set over the past month will become the next support areas.
The 40 day moving average which held as resistance on Wednesday is at 1.770. A breakout above this resistance could lead to fund short covering and technical buying.
Moving Average Alignment – Bearish
Long Term Trend Following Index – Bullish
Short Term Trend Follow Following Index - Bullish
Relative Strength Index - 47.79
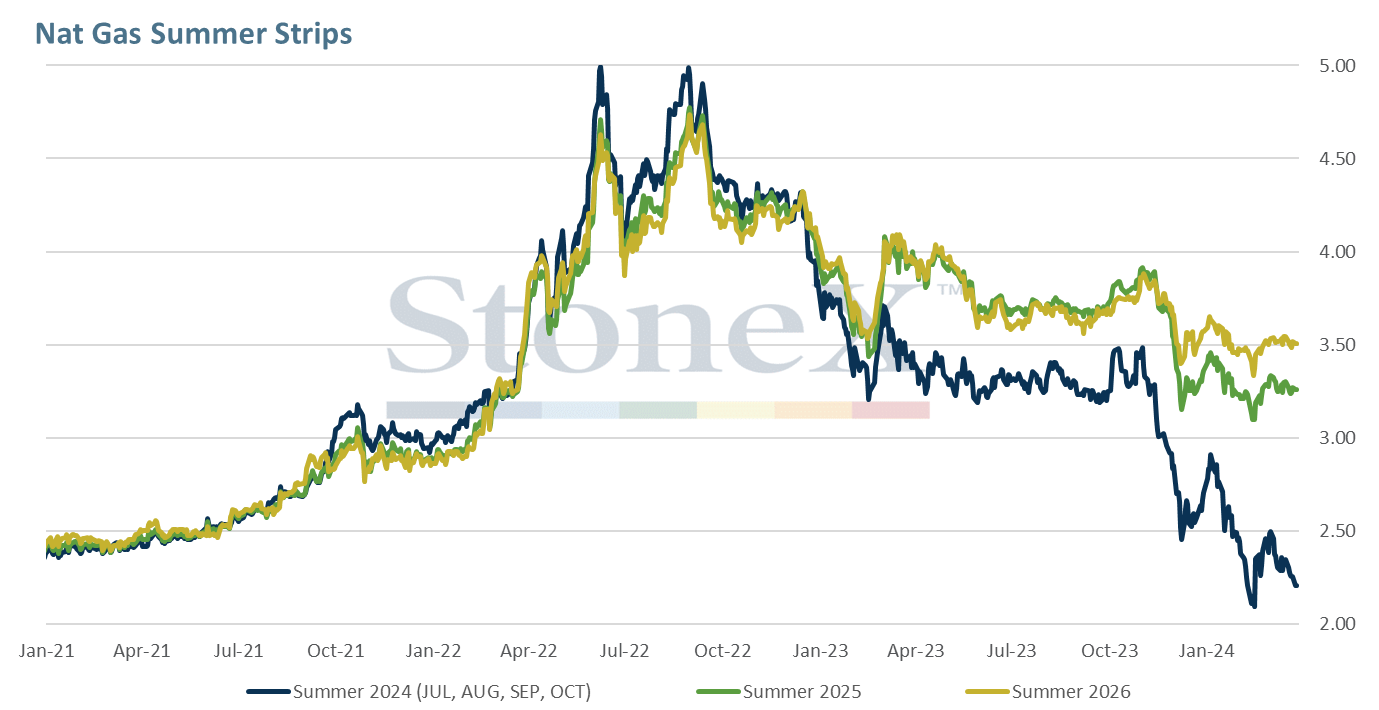
The StoneX Market Indicator provides an overall view of market sentiment for a commodity based on the quantification of fundamental, technical and historical market data related to that commodity. Each factor is quantified by comparing data for the current period versus last year, versus the previous period, versus its history and versus the yearly average. This quantification is converted to a number and summed together. The sum of all factors are reweighted by the 4-year decile of its history. The 4-year deciles redistribute the StoneX Market Indicator to obtain an equal share between the bullish and the bearish signals. The StoneX Market Indicator History graphically represents each day’s actual very bearish to very bullish signal. This history contains the sum of all factors, excluding weather forecasts.
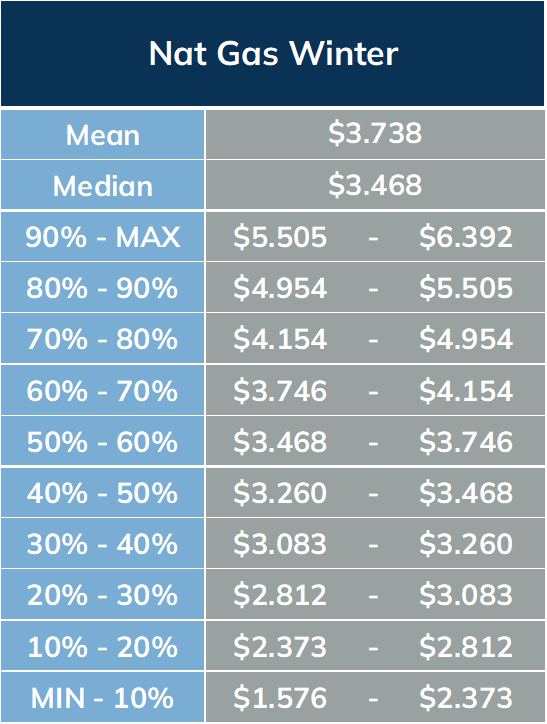
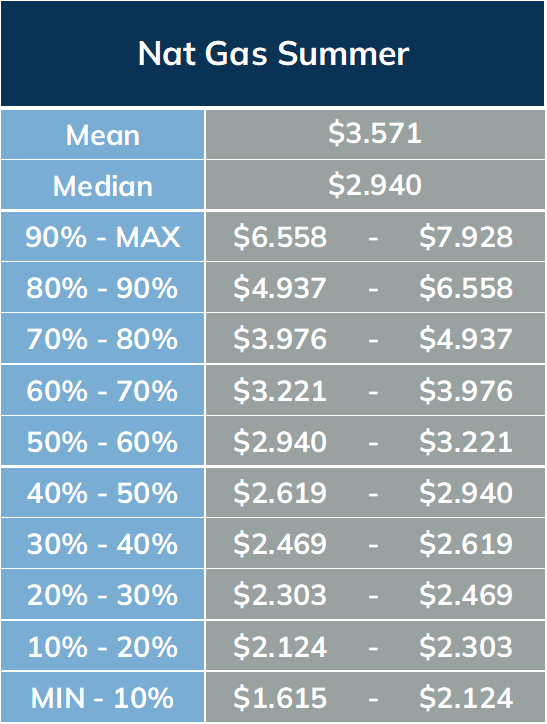
The StoneX Value Matrix provides a measure of historical value by analyzing 4 years historical price data distributed into 10 deciles. All of the years are weighted at 20% with the exception of the most recent year which is weighted at 40%. The prices are adjusted for inflation using the Producer Price Index (PPI).
Reproduction or use in any format without authorization is forbidden. © Copyright 2024. All rights reserved.