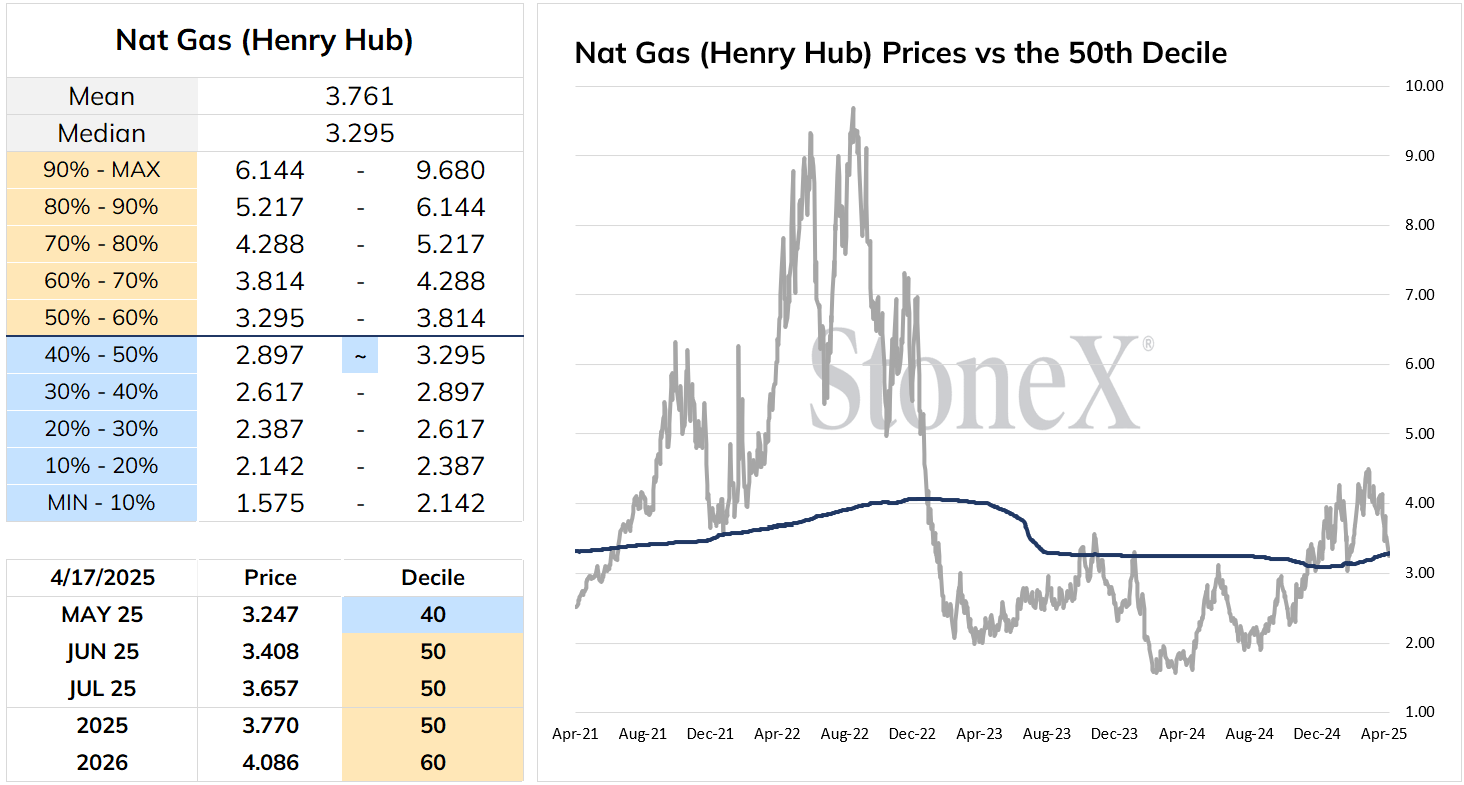
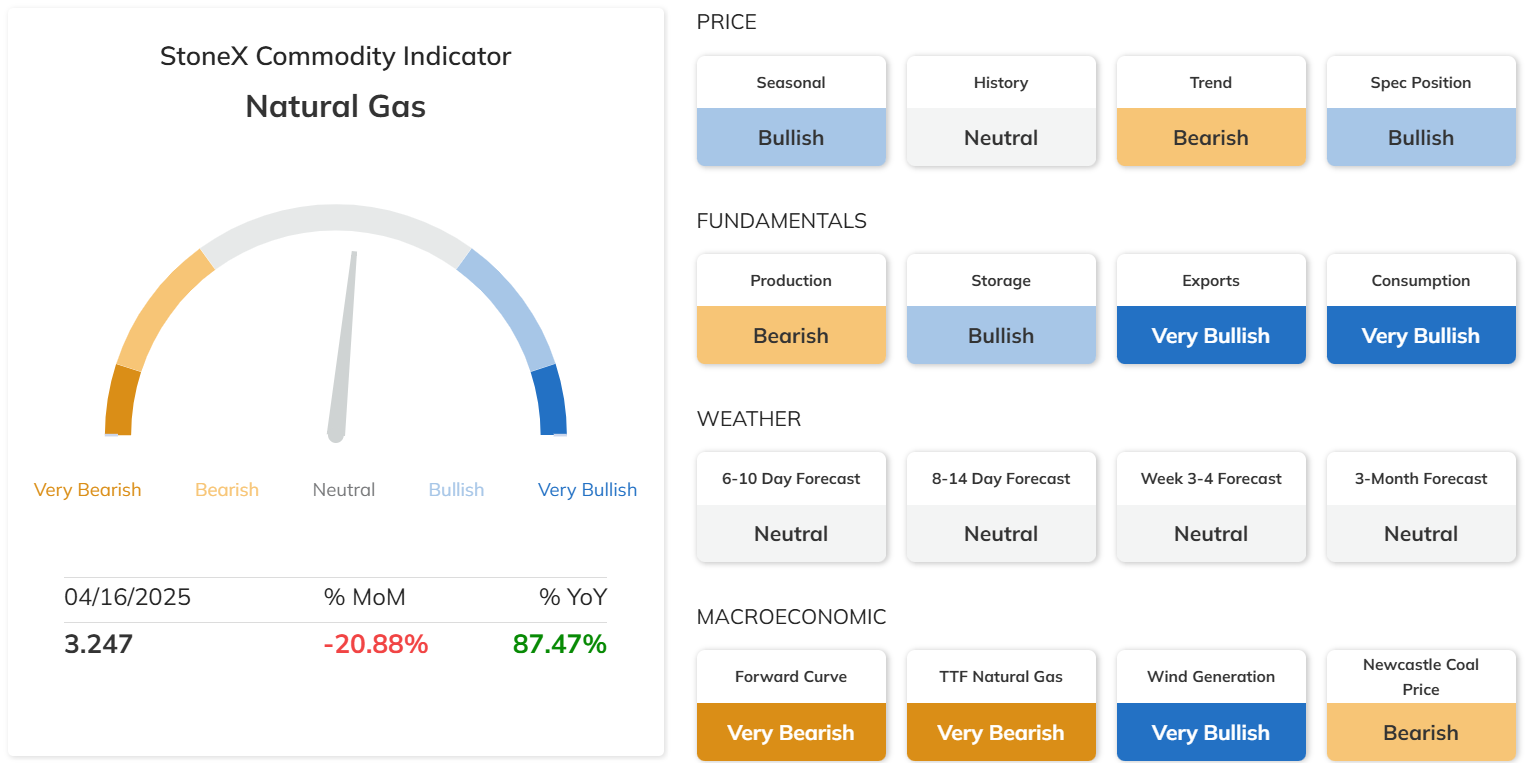
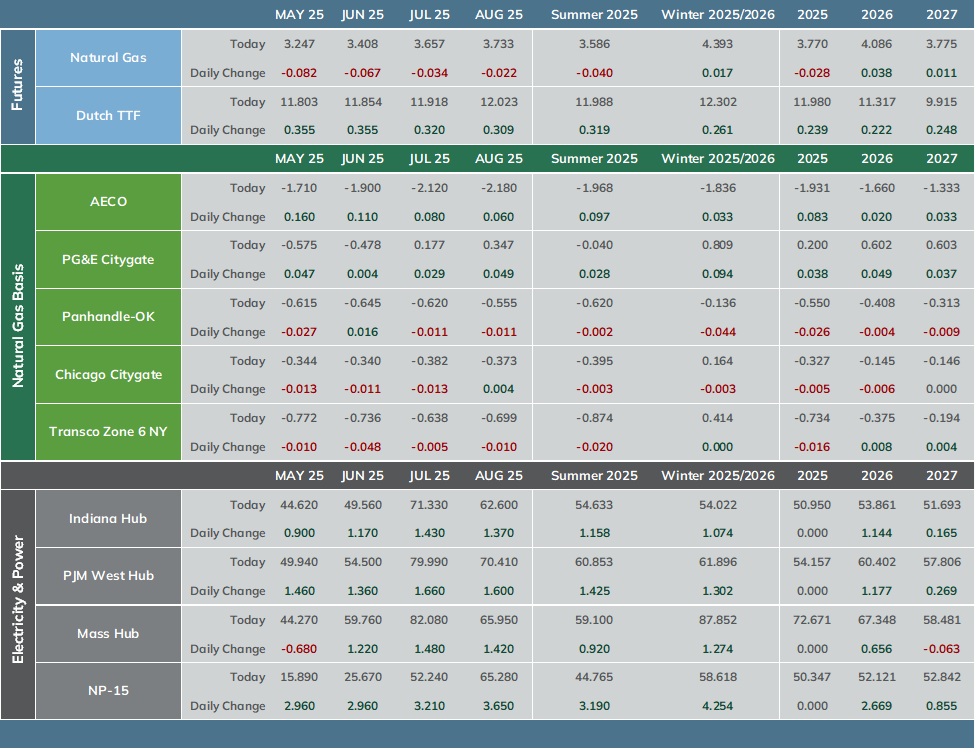
Prices settled lower Wednesday, hitting a 10 week low, as underlying pressure continues from fears tariffs will reduce economic growth and weigh on energy demand, particularly industrial and power generation. Mild weather on the horizon should keep weather related demand at bay. May futures settled 8.2 cents lower at $3.247.
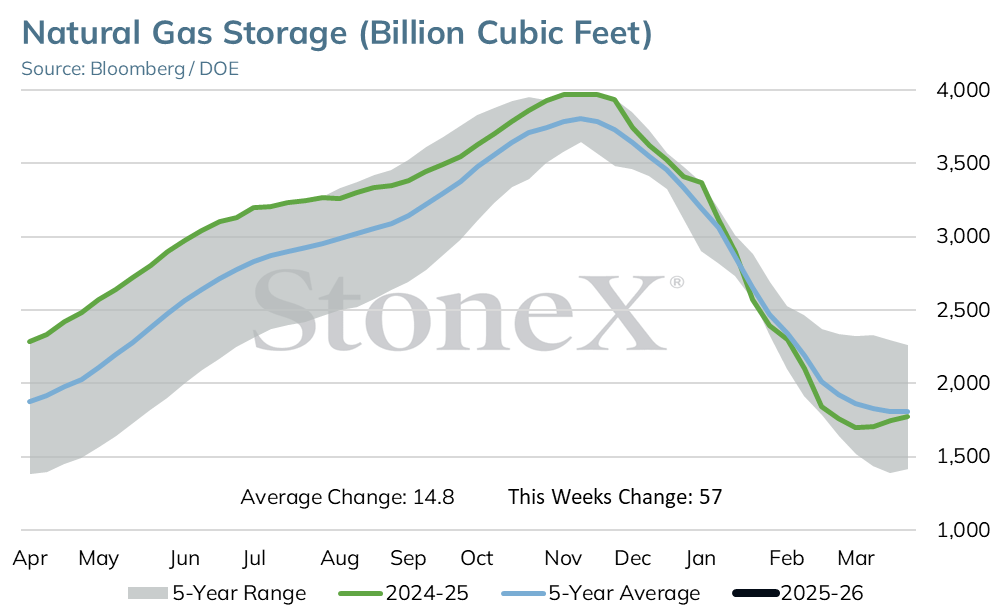
The 5 yr avg deficit is expected to widen for the first time in 5 weeks as last week’s tighter supply/demand balance is expected to result in a lower than injection. Today’s storage report is expected to show a build of 22 BCF for the week ended April 11 which compares to last year’s build of 46 BCF and the 5 yr build of 50 BCF. Next week’s number is expected to come in around 58 BCF which compares to the 5 yr avg build of 59 BCF and last year’s injection of 86 BCF.
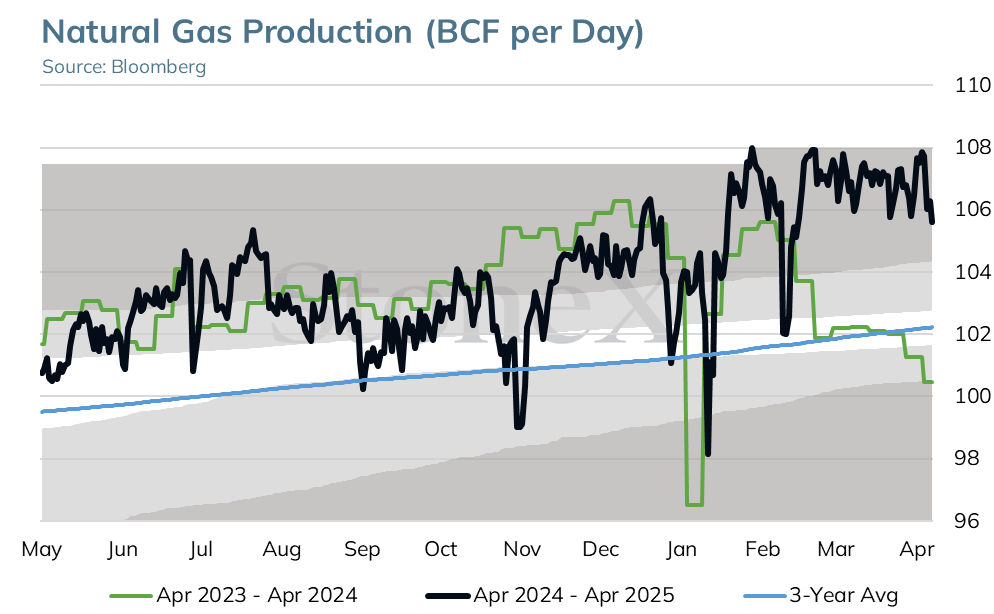
Production levels are still being impacted by pipeline maintenance while lower prices are not incentivizing a ramp up. Output has been running below 106 BCF/day for the past few days, coming in this morning at 104.6 BCF/day. Estimates show output should climb back to 105 BCF/day over the next 2 weeks.
Prices are currently trading higher following early session losses.
Technical Analysis
The May 25 natural gas contract held in a fairly narrow .114 range on Wednesday but closed .082 (2.4%) lower settling at 3.247.
The trend remains down with the lower-3.000 area being the next downside objective.
The lower-3.000 is a key technical support area as it is the 50% retracement of the 2024-2025 uptrend (3.015), the daily continuation chart 200 day moving average (3.055), and was former “breakout” resistance, now support.
If the lower-3.000 area holds on current weakness, a post-winter low could be in place.
However, if support is broken, the 61.8% retracement at 2.655 will become the next downside objective.
Former weekly low support at 3.336 is near term resistance followed by the 10 day moving average currently at 3.500.
Daily RSI is currently at 34.99. A drop under the 30 level is considered “oversold”. While RSI can remain in the oversold area from some time before a reversal occurs, a drop under 30 could coincide with trade down to the lower-3.000 level by the May contract.
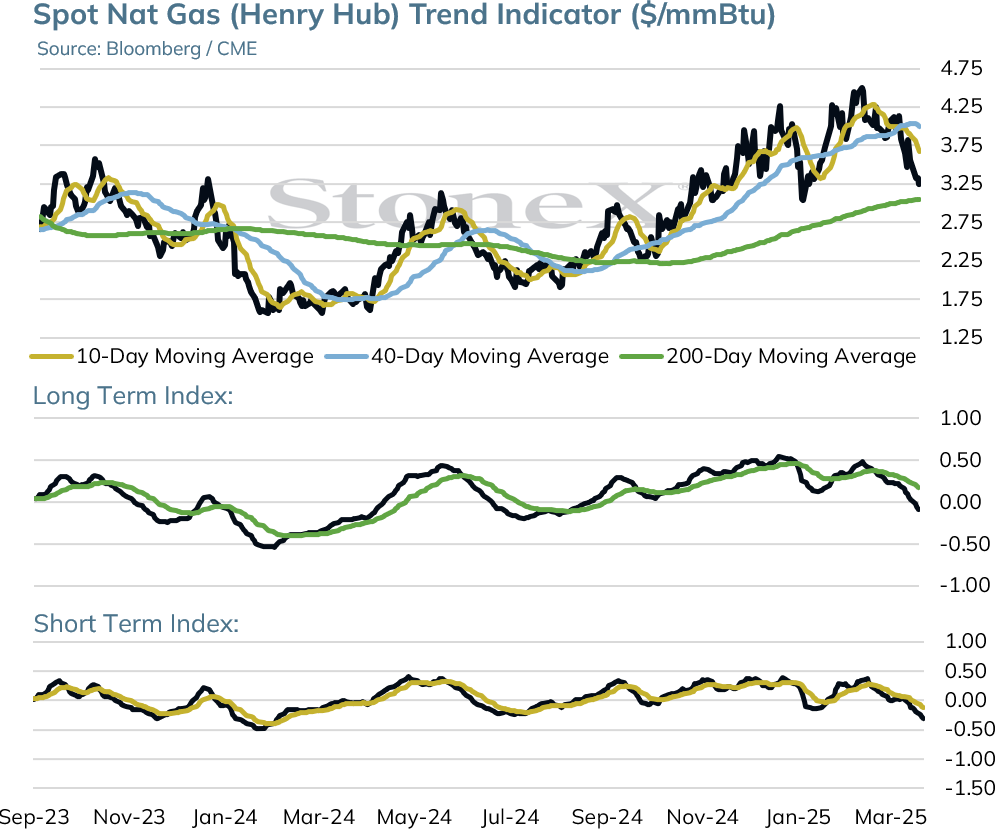
Moving Average Alignment – Neutral-Bearish
Long Term Trend Following Index – Bearish
Short Term Trend Follow Following Index - Bearish
Relative Strength Index - 34.99
This material should be construed as the solicitation of an account, order, and/or services provided by the FCM Division of StoneX Financial Inc. (“SFI”) (NFA ID: 0476094) or StoneX Markets LLC (“SXM”) (NFA ID: 0449652) and represents the opinions and viewpoints of the author. It does not constitute an individualized recommendation or take into account the particular trading objectives, financial situations, or needs of individual customers. Additionally, this material should not be construed as research material. The trading of derivatives such as futures, options, and over-the-counter (OTC) products or “swaps” may not be suitable for all investors. Derivatives trading involves substantial risk of loss, and you should fully understand the risks prior to trading. Past results are not necessarily indicative of future results.
All references to and discussion of OTC products or swaps are made solely on behalf of SXM. All references to futures and options on futures trading are made solely on behalf of SFI. SXM products are intended to be traded only by individuals or firms who qualify under CFTC rules as an ‘Eligible Contract Participant’ (“ECP”) and who have been accepted as customers of SXM.
SFI and SXM are not responsible for any redistribution of this material by third parties, or any trading decisions taken by persons not intended to view this material. Information contained herein was obtained from sources believed to be reliable, but is not guaranteed as to its accuracy. Contact designated personnel from SFI or SXM for specific trading advice to meet your trading preferences.
(1) The StoneX Commodity Indicator provides an overall view of market sentiment for a commodity based on the quantification of fundamental, technical and historical market data related to that commodity. The StoneX Commodity Indicator History graphically represents each day’s actual very bearish to very bullish signal. This history contains the sum of all factors, excluding weather forecasts.
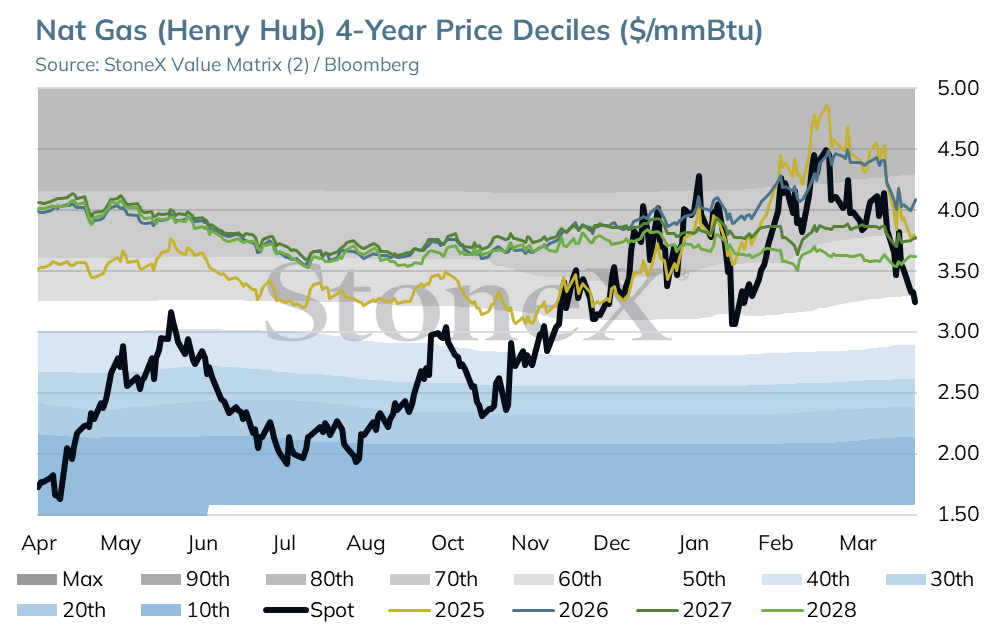
(2) The StoneX Value Matrix provides a measure of historical value by analyzing historical price data distributed into 10 deciles. The prices are adjusted for inflation using the Producer Price Index (PPI) published by the U.S. Bureau of Labor Statistics.
Reproduction or use in any format without authorization is forbidden. © Copyright 2024. All rights reserved.