Dow Tests Record While Liquidity Rebounds Through a Week of Heavy Anticipation
By: John Kicklighter, Head of Market Research
There is plenty of worthy global macro event risk on tap for this week’s post-holiday liquidity rebound, but a sense of anticipation for earnings, China GDP and Warsh testimony will distract.
Talking Points:
There was some uneven rebalance heading into the long-holiday weekend, but risk trends are far from a true discount
We are entering the 28th week of the year and in doing so wading into July and the second half, seasonal expectations will exact a greater influence
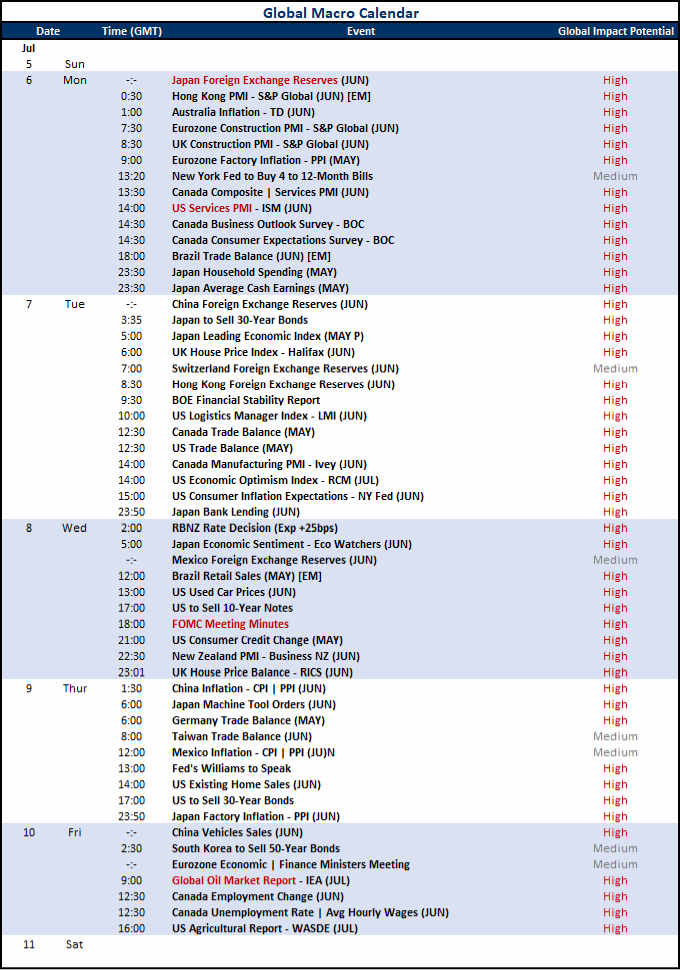
Top event risk over the coming week includes the ISM’s US service survey, RBNZ rate decision and FOMC minutes
Watch the Full Video
Risk Rebalanced Before Holiday Liquidity Drain…Sort Of
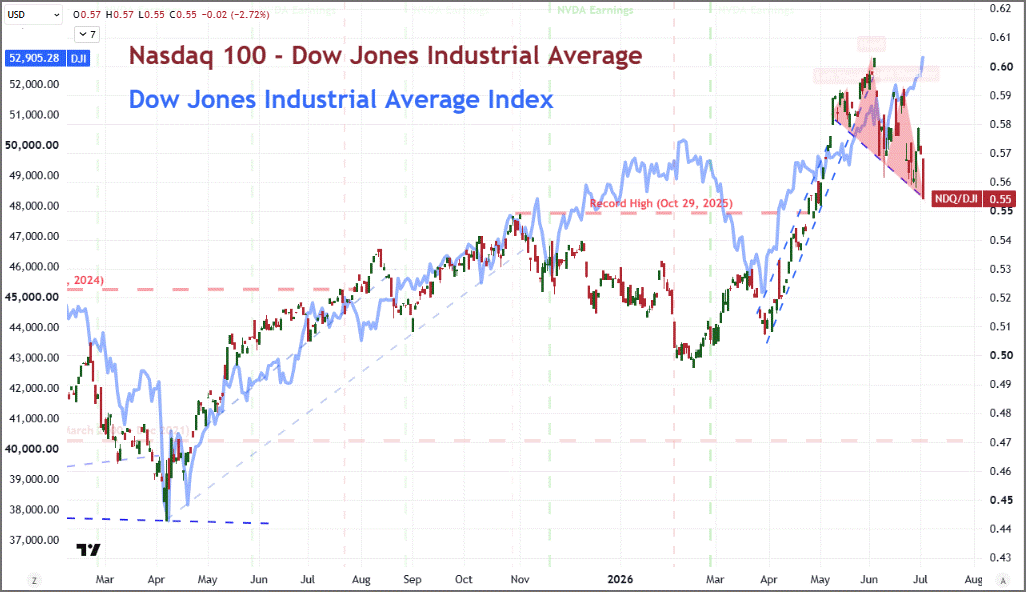
We are traversing well-known liquidity and activity gaps attributed to the transition into summer trading conditions. A downshift in volatility is typically a welcome shift for those defaulting to a ‘risk on’ orientation, but the more balanced the backdrop is relative to collective ‘value’, the better. While there are a few strong arguments to made for unrealized value in these buoyant markets, few would label our altitude as a significant discount. A rebalance in risk exposure can help establish a foothold for further fundamental improvements to extend the climb higher than it could have stretched otherwise – similar to how the US-Iran conflict or Liberation Day tariffs reloaded confidence. Heading into this past holiday weekend, there was a notable retrenchment in some of the most stretched risk exposure. The Nasdaq 100 merely extended a 7th weeks congestion; but relative to the blue chip Dow Jones Industrial Average, the tech-heavy index sunk to a two-month low. That takes pressure off, but it doesn’t fundamentally waylay the larger bull trend – nor does it materially provide fresh opportunity value-wise.
Chart of Dow Jones Industrial Average Overlaid with Nasdaq-Dow Ratio (Daily) Source: TradingView.com; John Kicklighter
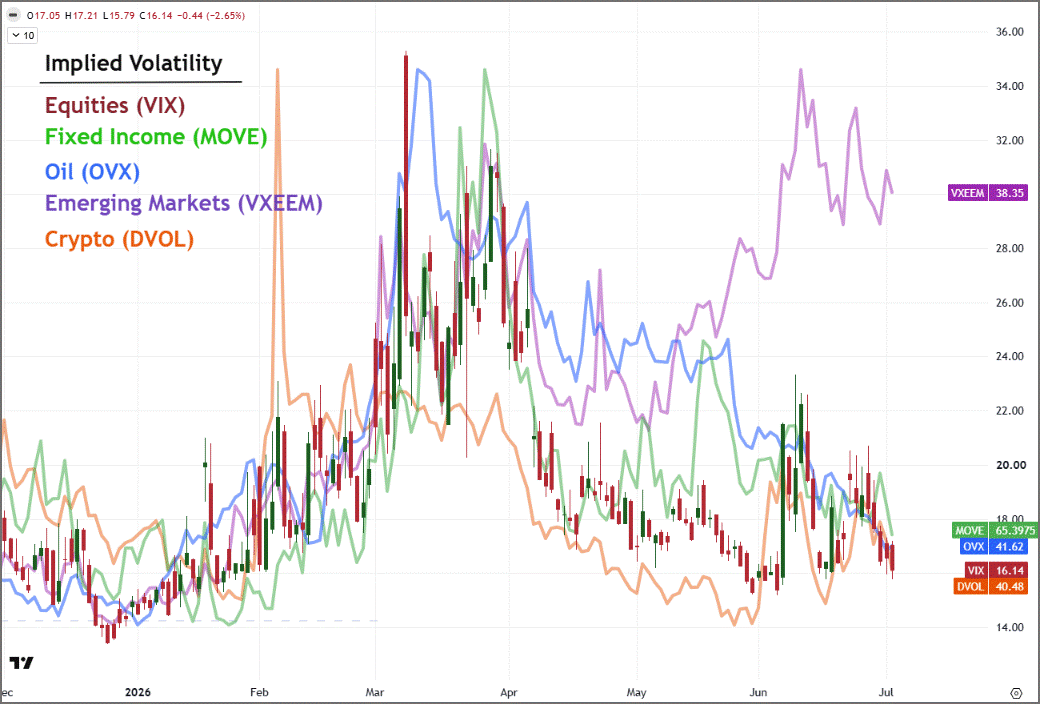
Another look at the market’s risk profile comes from implied (expected) volatility from the representative speculative benchmark categories. With the exception of an outlier for emerging markets (VXEEM); there has been a material and persistent deflation in volatility readings for US equities, fixed income (Treasuries), crude oil, gold, Bitcoin and other measures. That tends to align to seasonal expectations. However, there are some measures that should be monitored as representing perhaps an exaggerated expectation to the point of dangerous complacency. VIX futures – a market unto themselves – maintains a strong net speculative short positioning (-66,774 contracts) despite the index holding below its 20-day and 200-day simple moving averages. Further, the 9-day VIX stands at a -3.8 point discount to the standard 30-day measure – the lowest since January 16th. Then there is the level of implied correlation for the S&P 500 (the top 50 components) which has dropped to a two-year low for the one-month measure, while the three-month is holding near a series low stretching back two decades. These aren’t immediate issues, but they speak to a very sanguine market.
Chart of Various Markets’ Implied Volatility Measures (Daily)
Source: TradingView.com; John Kicklighter
Seasonality Will Factor In Strongly This Week
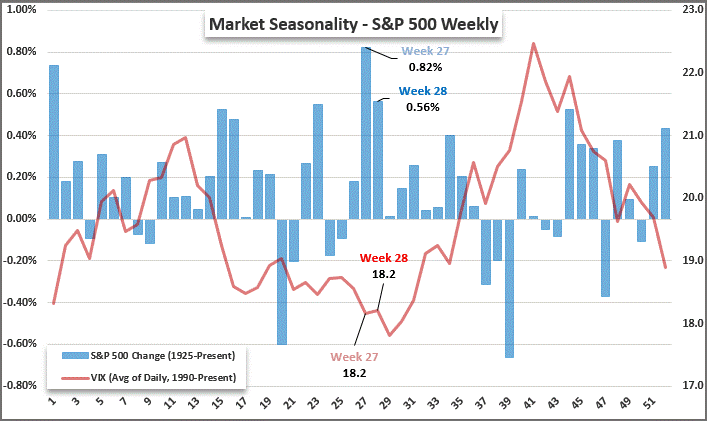
This week, we transition into the second half of the year. That brings with it significant expectations when it comes to activity levels and speculative trends. We have passed one of the most reliably restrained weeks of the year volume-wise, but the S&P 500’s 1.8 percent climb hardly lived up to its historical average as the year’s top week performance-wise. If we weren’t so close to record highs, the reduction in perceived risk may have generated more lift. Looking ahead, the 28th week of the year also averages a strong bullish performance from the benchmark index over the past century. The reality is that performance can vary dramatically from year to year given the particular circumstances of the period, but we seem to have downshifted on most of the major fundamental themes of the past months that could practically override the quiet.
S&P 500 Averaged Performance and Volatility by Calendar Week Source: Standard & Poor’s; John Kicklighter
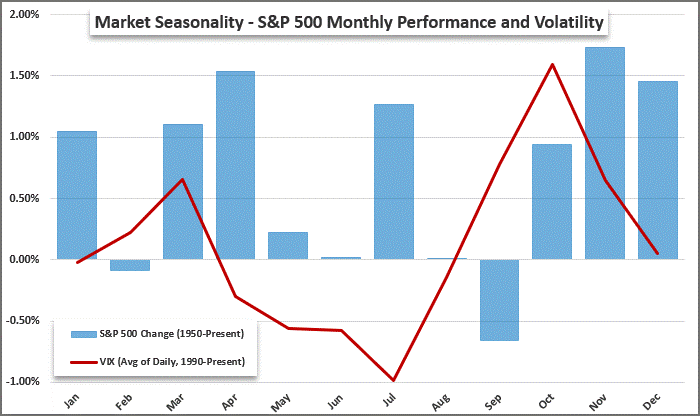
On a higher time frame, the month of July averages a strong bullish performance with a smaller distribution of historical examples. That is due in larger part to the reduced volume and volatility of the period, which is more consistent. Volatility – measured by the VIX – hits its nadir over the average calendar year this month. Volume, on a trading-day weighted basis, is very low but its absolute low on average is in August with December a close second. To override these participation norms would require a significant fundamental charge or a systemic risk unwinding.
S&P 500 Averaged Performance and Volatility by Calendar Month
Source: Standard & Poor’s; John Kicklighter
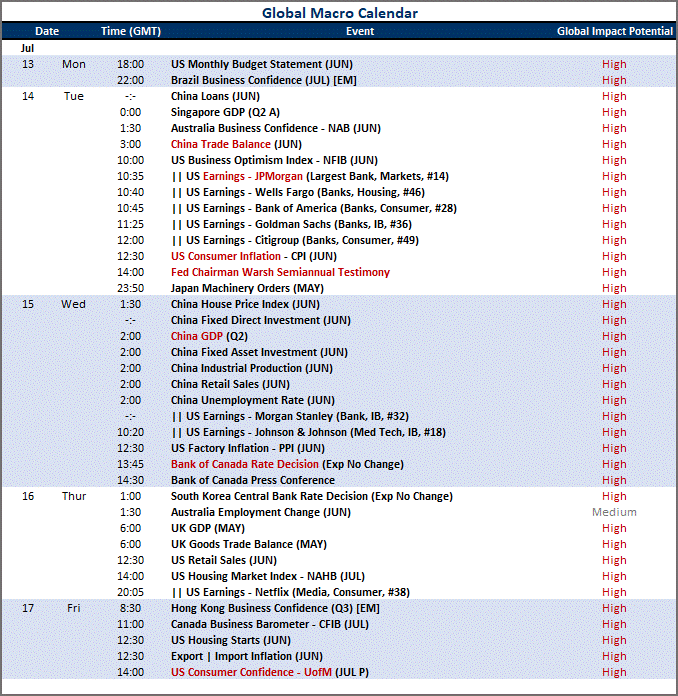
What is the chance of a systemic theme regaining traction or risk appetite suddenly kicking into gear? One curb against this happening through the immediate future is the crowded economic calendar one week ahead. We have a loaded docket just over the horizon of events that can readily tap thematically consequential nerves. Chinese 2Q GDP, the start of the quarterly earnings season with the major financial institutions reporting, a Bank of Canada rate decision and Fed Chairman Kevin Warsh’s first semi-annual testimony are all independently capable of generating global heat. It is often the case that anticipation has the stronger and more consistent influence over markets than variable event with a spectrum of possible outcomes and the complicating influence of anticipation.
Calendar of Major Macro Economic Event Risk Source: John Kicklighter
A Front-Loaded Week for Meaningful Event Risk
The docket this past week held more than a few high-profile releases and the same is true for what is ahead. However, considering we are coming off the holiday liquidity drain, the listings look more like outliers for taking the global markets’ reins. Thematically, there is plenty around inflation readings, trade figures and various sentiment surveys (largely business-oriented). While monetary policy may still represent a macro theme in the wings that some of this event risk can tap into, the bar to trigger a stronger move is probably set high to translate into wider market movement.
Calendar of Major Macro Economic Event Risk Source: John Kicklighter
Evaluating ISM Service Figure for Fed Versus Growth Implications
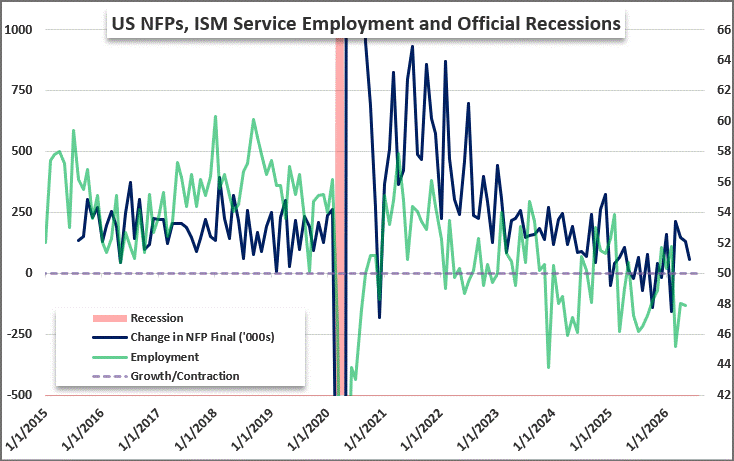
One top event risk of substance is the ISM’s US service sector activity report. As an indicator for the world’s largest economy, this represents arguably the engine of American output. That said, the timely indicator’s capacity to substantially move markets through shifting perspective around growth has been tepid at best. On the other hand, the components of the survey can register with more active and sensitive themes. This past week, the ISM’s manufacturing reading showed a steep drop in the prices paid component – potentially relieving significant pressure on the Fed’s dual mandate. Will the service report reflect the same? Similarly, the employment gauge from the service industry (the largest overall source of jobs for Americans) has run below 50 for the previous three months. Which is more indicative of US labor health: NFPs or this employment component?
Chart of US Change in NFPs Overlaid with ISM Service Sector Employment (Monthly)
Source: US Bureau of Labor Statistics; ISM; John Kicklighter
The RBNZ Rate Decision is More than an Isolated Policy Update
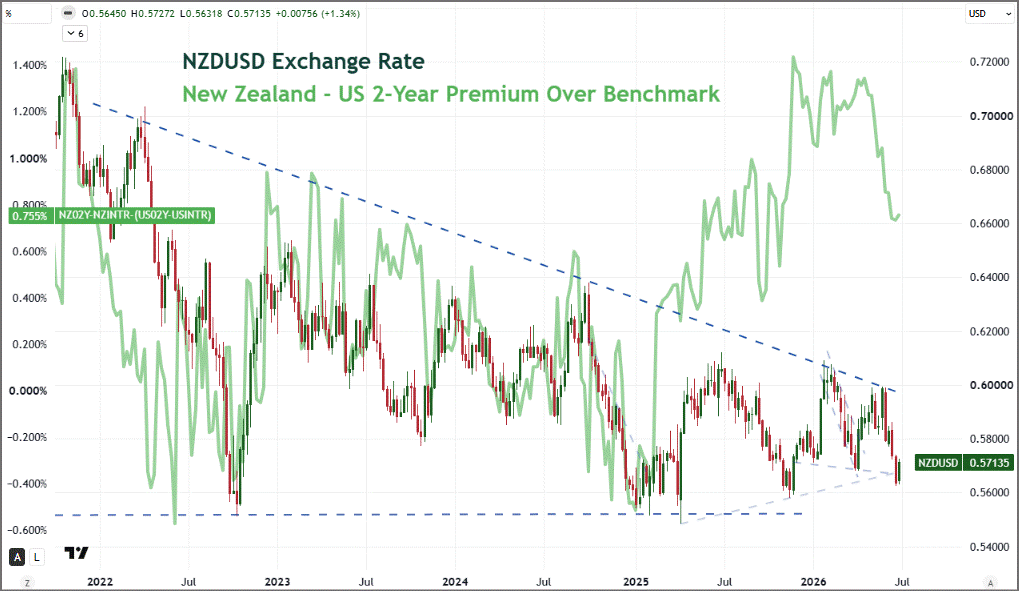
According to the BIS (Bank for International Settlements), the New Zealand Dollar accounts for a paltry 2.1 percent of all globally foreign exchange turnover. Nonetheless, that still makes it the 10th most traded currency globally. The scale of use of the currency is a step up from the actual standing of the underlying economy’s status, and it also amplifies the importance of its benchmark interest rate. Historically, the AAA-rated sovereign debt issued by New Zealand has drawn global interest through a higher overall interest rate. However, at 2.25 percent, this role has been flipped on its head. While still representing a carry trade versus the Japanese Yen or Swiss Franc, the Kiwi is a ‘funding currency’ to the Euro (2.4 percent), Dollar and Pound (3.75 percent) or Australian Dollar (4.35 percent). With an expected hike at this meeting, will we start to see a change in the tables to support a return of global capital?
Chart of NZDUSD Exchange Rate Overlaid with NZ-US 2-Year Premium Spread (Weekly) Source: TradingView.com; John Kicklighter
I Don’t Usually Watch the FOMC Minutes, But This One Matters
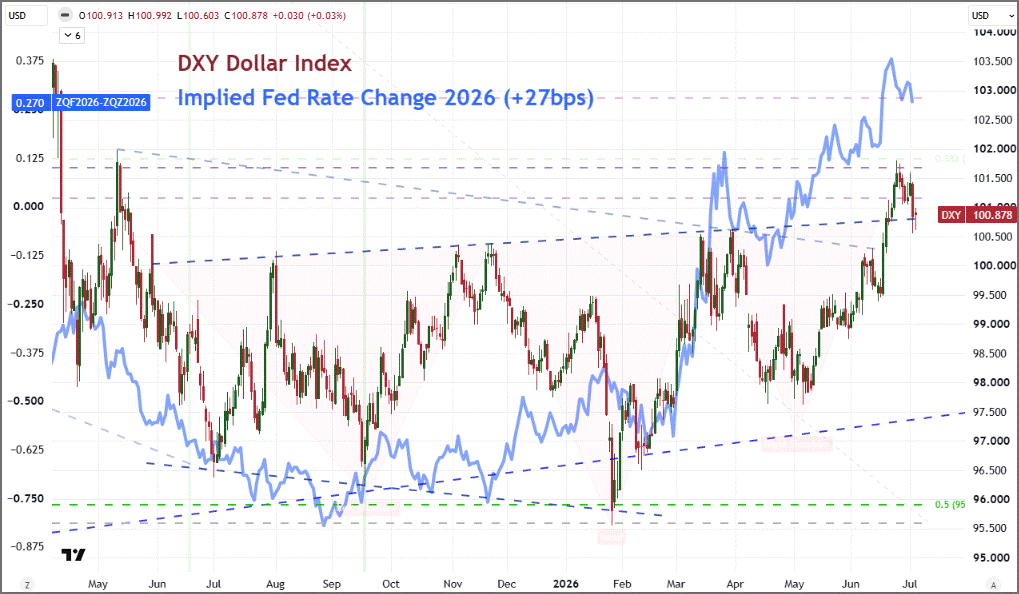
Usually, we get everything we need to fuel Fed rate expectations through policy decisions – whether a ‘regular’ event or a quarterly event with updated Summary of Economic projections – or key event risk that changes the expectations for the dual mandate mix. I rarely pay close attention to the minutes that the FOMC releases weeks after its official policy meeting and subsequent announcement, because there are usually no meaningful surprises to be found. However, with the central bank swapping out leadership and Warsh indicating meaningful change in communication policy moving forward, it will be important to take in how informative and consequential the group intends the official minutes to be in the future regime. We have seen a modest retreat in hawkish rate expectations for 2026 (and 2027) over the past two weeks, with an 11 basis point retreat in futures-priced forecasts to 27 basis points (of tightening). Keep that in mind as we take in the details of the report.
DXY Dollar Index Overlaid with 2026 Implied Fed Forecast (Daily) Source: TradingView.com; CME; John Kicklighter
Access More Global Macro Insights, Forecasts and Tools
Stay connected to timely global macro analysis designed to help market participants navigate shifting economic conditions and evolving risk. Gain access to regular market commentary, updated quarterly forecasts, a comprehensive two-week forward economic event calendar, and specialized tools built to support informed trading and risk management decisions.
The subsidiaries of StoneX Group Inc. provide financial products and services, including, but not limited to, physical commodities, securities, clearing, global payments, risk management, asset management, foreign exchange, and exchange-traded and over-the-counter derivatives. These financial products and services are offered in accordance with the applicable laws in the jurisdictions in which they are provided and are subject to specific terms, conditions, and restrictions contained in the terms of business applicable to each such offering. Not all products and services are available in all countries. The products and services offered by the StoneX Group of companies involve risk of loss and may not be suitable for all investors. Full Disclaimer. This content is not intended for residents of any particular country, and the information herein is not advice nor a recommendation to trade nor does it constitute an offer or solicitation to buy or sell any financial product or service, by any person or entity in any jurisdiction or country where such distribution or use would be contrary to local law or regulation. Please refer to the Regulatory Disclosure section for entity-specific disclosures. No part of this material may be copied, photocopied or duplicated in any form by any means or redistributed without the prior written consent of StoneX Group Inc. The information herein is provided for informational purposes only. This information is provided on an ‘as-is’ basis and may contain statements and opinions of the StoneX Group of companies as well as excerpts and/or information from public sources and third parties and no warranty, whether express or implied, is given as to its completeness or accuracy. Each company within the StoneX Group of companies (on its own behalf and on behalf of its directors, employees and agents) disclaims any and all liability as well as any third-party claim that may arise from the accuracy and/or completeness of the information detailed herein, as well as the use of or reliance on this information by the recipient, any member of its group or any third party.
Our market expertise, advanced platforms, global reach, culture of full transparency and commitment to our clients’ success all set us apart in the financial marketplace.
Reach
With access to 40+ derivatives exchanges, 180+ foreign exchange markets, nearly every global securities marketplace and numerous bi-lateral liquidity venues, StoneX’s digital network and deep relationships can take clients anywhere they want to go.
Transparency
As a publicly traded company meeting the highest standards of regulatory compliance in the markets we serve; our financials and record of accomplishment are matters of public record. StoneX’s commitment to “doing the right thing over the easy thing” sets us apart in the industry and helps us build respect, client trust and new partnerships.
Expertise
From our proprietary Market Intelligence platform, to “boots on the ground” expertise from award-winning traders and professionals, we connect our clients directly to actionable insights they can use to make more informed decisions and achieve their goals in the global markets.