Quarterly Commodities Outlook is available for free now.  Download your report  →

StoneX logo

Farmer Fertilizer Focus - Phosphates

By: Josh Linville, Vice President- Fertilizer

March '23 PHOSPHATES
 
Josh Linville
Vice President - Fertilizer
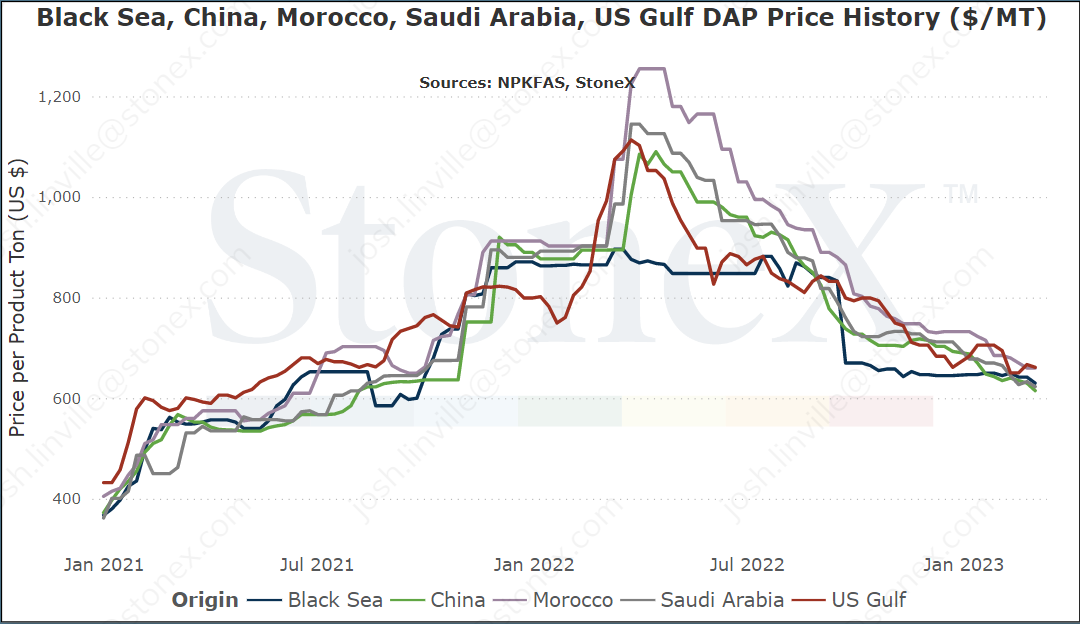
Major global phosphate export location price graphs
I will have 2 graphs:  one that lists historical pricing in short tons and one in metric tons so that everyone can read it in a form they prefer.  All prices are listed in USD.  All prices are FOB or priced at their origin.
I will say this now and will say it going forward to eternity:  these are the flat price graphs for each individual location.  Your price where you are is going to be different.  There are logistics.  There is the cost of storage/interest/insurance/etc.  These graphs should not be taken as "it shows the price at $700,  why isn't my price $700".  These graphs should be used to give an appreciation for price movements thru 2022.
image 65140
 
What everyone wants to know first, what do we think will happen going forward
Prices should hold thru the spring weeks but expect falling prices going into the summer.
Phosphate has been an interesting market this last month.  We are seeing major signs in the futures markets that values are expected to fall.  However, we continue to see promptish physical tons trading at even money.  It can be frustrating because we see what is coming but it isn't here in time to help us now.
Still, it feels like nearby tons will see prices hold and if spring demand hits hard enough, logistical strains could cause local values to increase.  
Once spring demand is over, we will see prices slide once again.
Should you buy your spring '23 phosphate needs?
If you are planning on putting down phosphate, it's March...you better.
Time is up, folks.  We have about 4 weeks or so of phosphate application season.  If you are going to put down phosphate this spring, you should be having that conversation with your retailer sooner than later.
The supply chain is scared today and that means scared buying/positioning.  It is no secret that forward price ideas for phosphate are lower today.  In fact, that has been the situation thru winter.  Farmers have been much more conservative with their buying patters and why not.  The longer you wait, the more chance of lower prices.  However, retailers are also conservative.  They can ill afford to buy tons and watch the price fall $50 - $100.  That pattern goes all the way up the chain.
I'm not saying there are going to be shortages.  I'm not saying all is lost.  We always find a way.  However, if we do not have these talks now and wait until the absolute last minute, it strains the system.  You are likely going to get your product...but it might take longer to arrive.  It might finally arrive...but it might cost more because it costs more to move in season.
I do not want to try and play the fear card.  That has been overused over the years.  That said, if you want the best chance of no hiccup's, go have a talk with your retailer.  Want it to go well, be nice.  Want it to go really well, bring their favorite bottle of whiskey!!!!
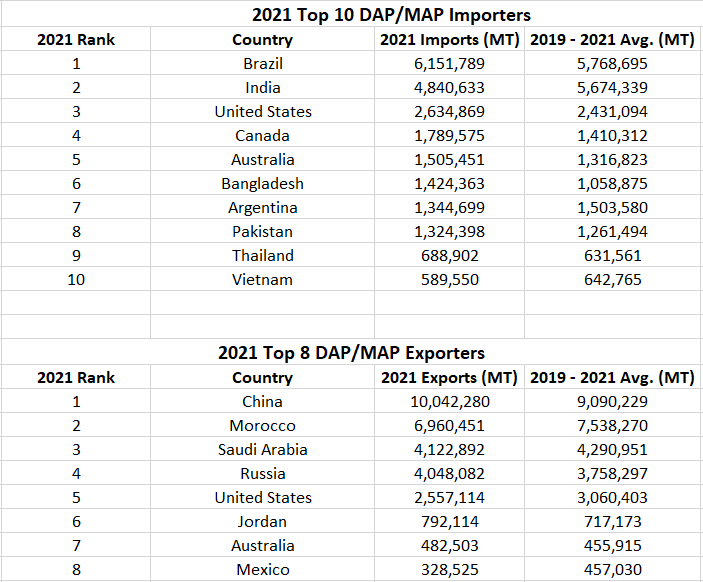
general global dap/map information
image 59247
What has happened in the last 30 days?
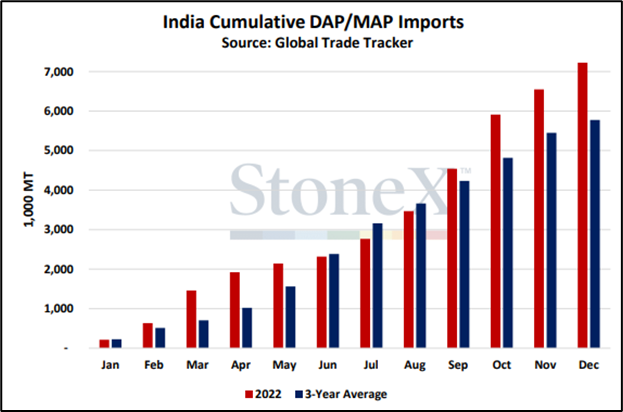
India, the 2nd largest importer in the world, was way ahead of average in 2022
When global phosphate values started going up around the world, one of our more popular topics was how far behind India was on their stockpiles.  Demand had surged, buying had struggled and their stockpiles suffered.
Since then, they have been doing a good job of playing catch up.  I'm not sure if this means they are exactly where they want to be with available tonnages, but they certainly made up ground in 2022 with their imports beating the 3-year average by over 1MMT.
There is a case to be made that India demand could be near non-existent in Q1.  They normally only import 1MMT Jan/Feb/Mar/Apr combined.  If they are ahead of the game, we could continue to see one of the world's largest buyers not really exist...which isn't a bullish factor for those wondering!!!!
image 64895
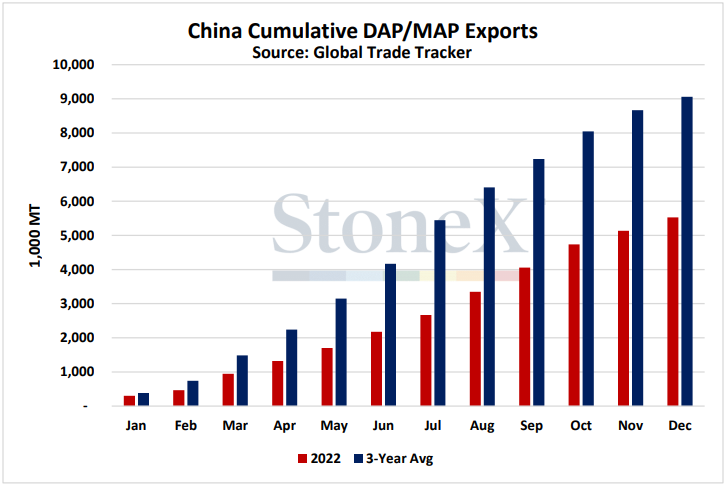
China, the world's largest phosphate exporter, finished 2022 down...which leaves global supplies tighter than they would have been
If we are going to talk about one of the world's largest buyers, it makes sense that we also need to consider the world's leading seller.
The 2022 year end results of Chinese exports are in...and they are a far cry from what would be considered normal.
Their 3-year average would put Chinese DAP/MAP exports at around 9MMT.  2022 put that number closer to 5.5MMT or 3.5MMT less than the world expects.
You might be looking at the above and thinking "if their exports were down so much, why have phosphate values been dropping smarta$$?".  That is EXACTLY the question that should pop into your mind.  The simple answer is that demand has been down as well as farmers around the world pushed back against high prices.  You speak with your pocketbook.
We need to keep in mind that these sorts of things have a way of catching up eventually.  We also need to be aware that this pattern could continue or worsen in 2023.  It could also improve.  I realize that but given some of the global political situations, I'm just struggling to see China wanting to improve exports which would help the rest of the world.
I know China is a long ways away from many of you but remember you are part of the world market.  Things that happen halfway around the world matter to you and your operation.  
image 64896
 
March Tampa NH3 fell $200 which means the cost of producing phosphate fell
The two biggest variable input cost products for phosphate manufacturing is sulfur and NH3.
That is why seeing Tampa fall by $200 is something that grabs our attention.  We believed we would see March lower but I would be lying if I said I expected that big a drop.
The first thing I need to point out is that we do not operate on a cost of production plus market.  The domestic and global S&D sets the price.  However, seeing the cost of production drop certainly adds a bit of bearishness to the situation.  A marketplace that was already skeptical of stepping forward to buy is not going to be excited to take that step if prices hold and they see this news.
The second is that this is a situation that likely has summer month ramifications...not spring.  We are too close to demand.  By the next newsletter, phosphate season should largely be complete.  Tons are in place and I can make a solid case that some inland points will see prices jump a bit just due to the demand on the logistical system.
Still, this is something to watch as we look for forward opportunities.  
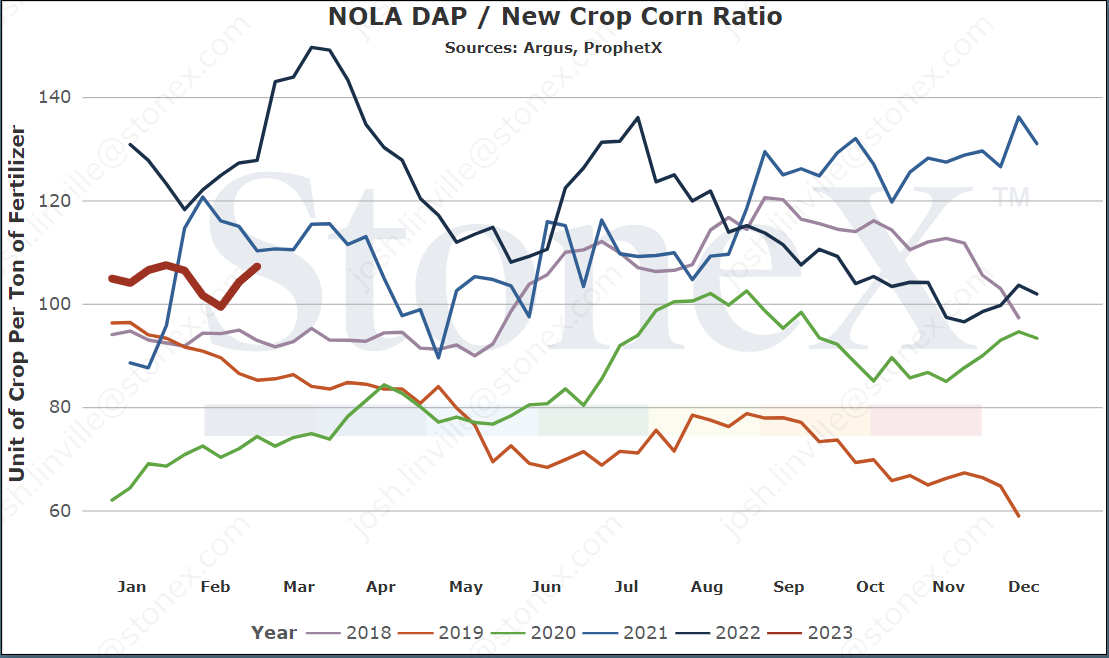
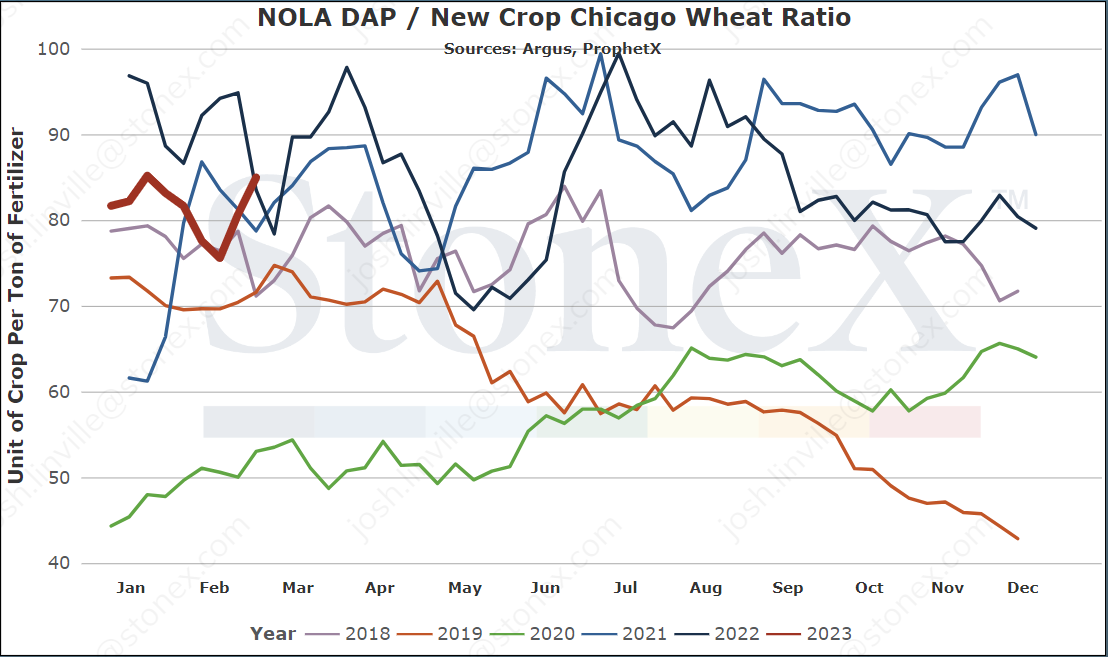
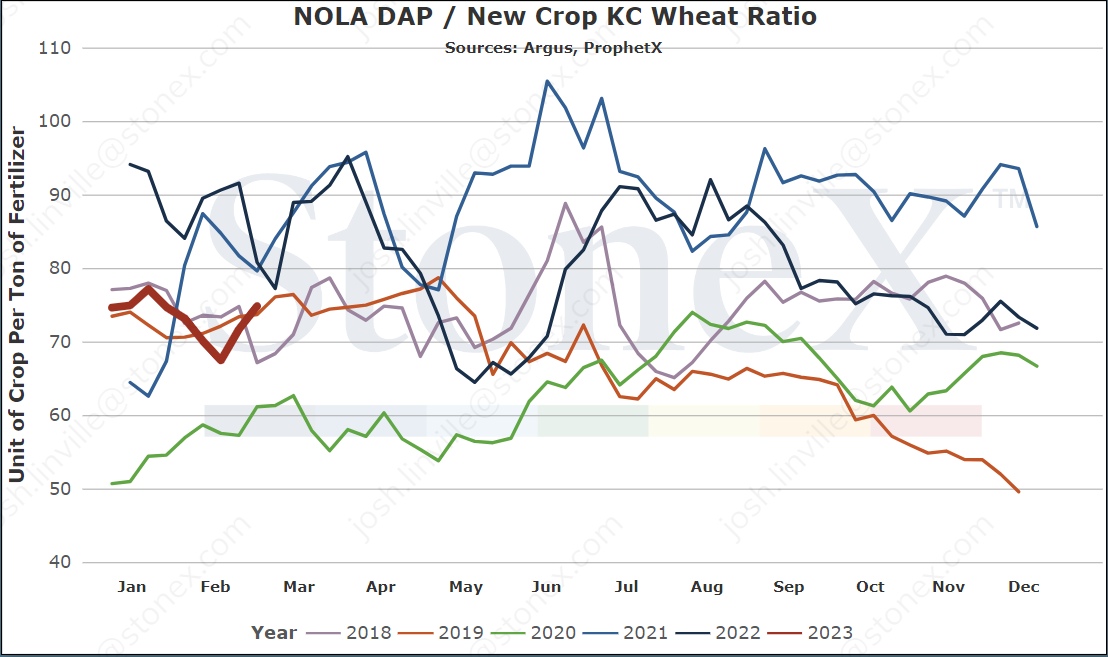
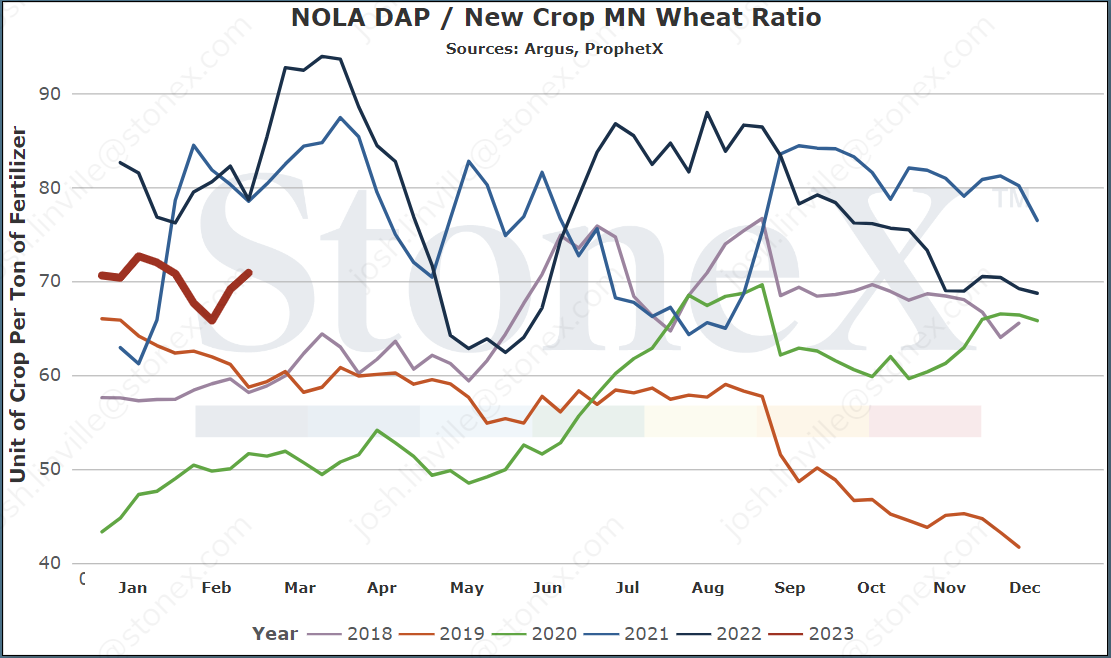
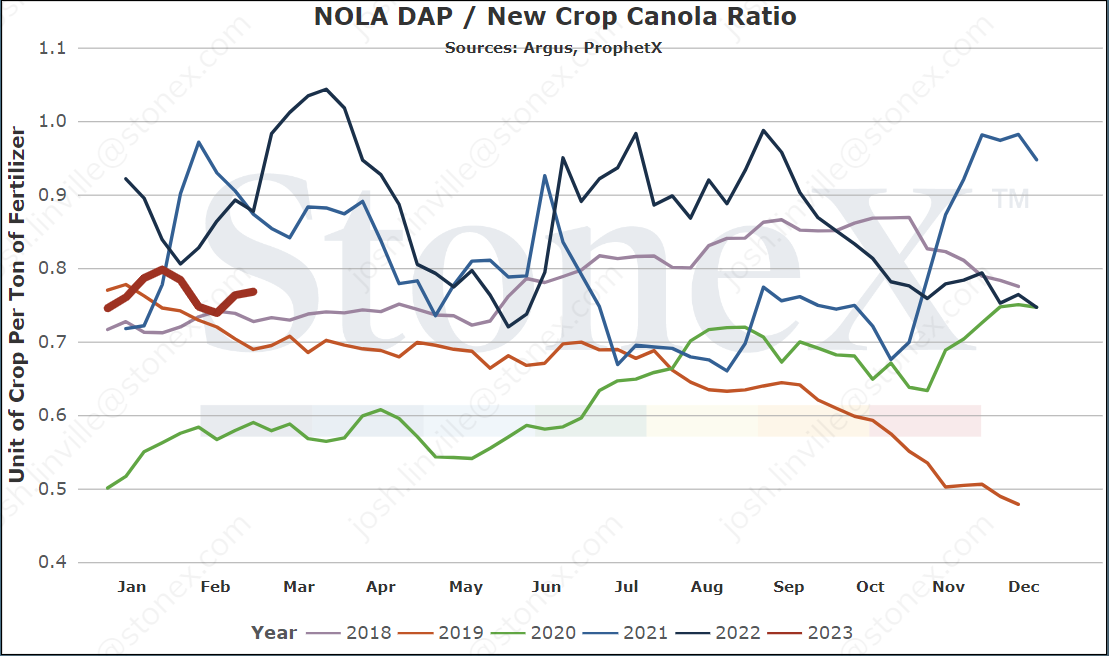
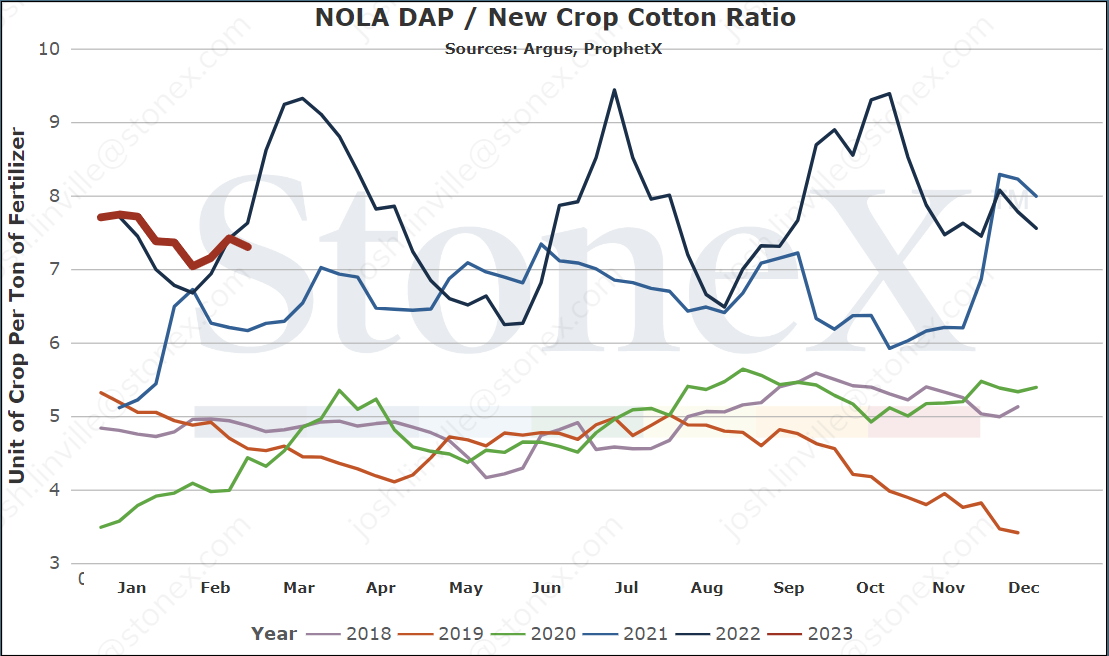
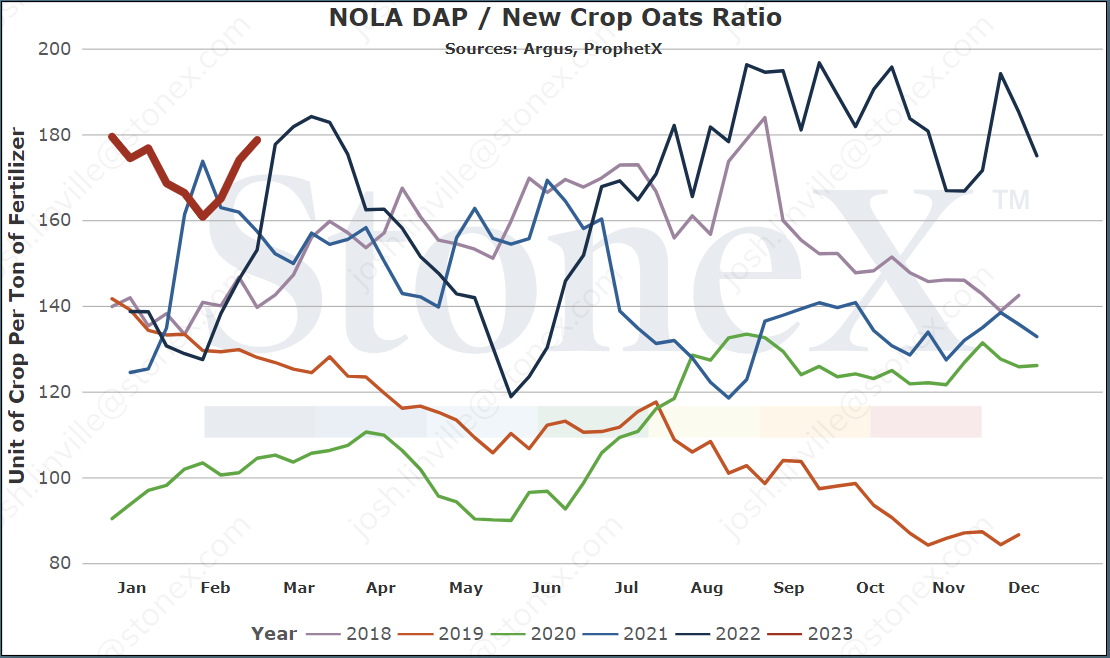
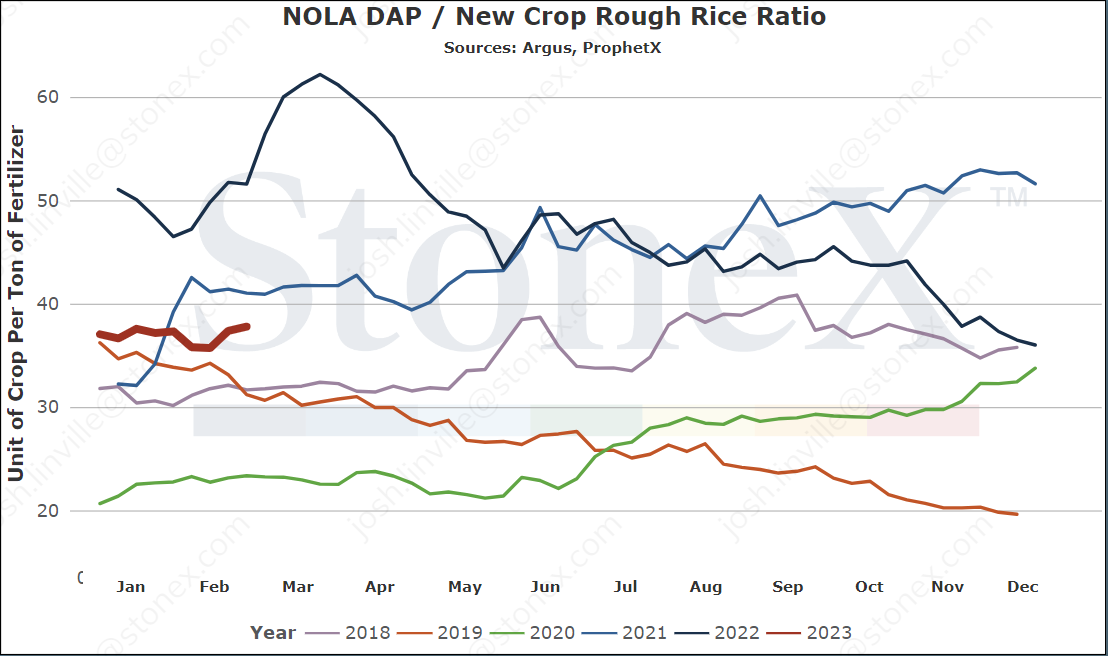
Phosphate prices are down hard from last year but high vs historical prices.  The ratios are much better than last year, but still middle of the road for recent years
Yes, this section is all over the place. That points to the current phosphate environment.  It feels like we are in a good place...and yet it doesn't.
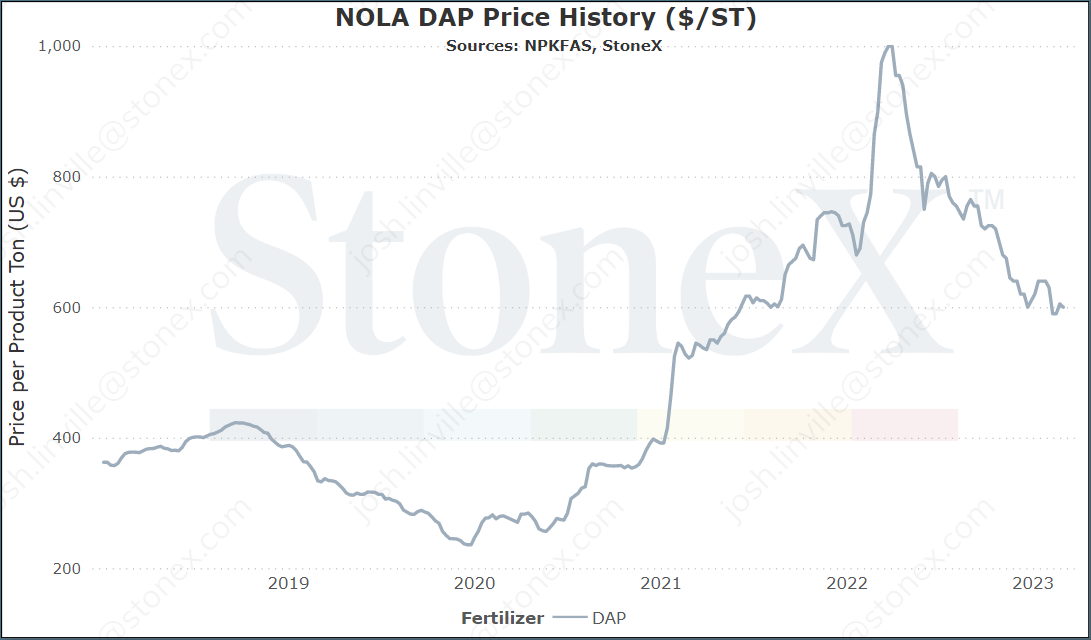
If we narrow our view to just the beginning of 2022, we are in a fantastic spot today.  NOLA DAP values are $250 lower with a bearish feel vs the bullish feel of last year.  The ratio is much better as last year the value was racing toward 150 bushels of corn for 1 ton of DAP.
However, we expand that view to 2018, prices today are still high and the ratio value is middle of the road.
We are just in that "bleh" spot.
The way I view the ratio chart is in thirds.  When we are in the highest third, we should be reducing application/pulling the nutrients from the soil (where possible).  When in the bottom third, we should be building soil phosphate levels for future use.
We are in that middle third.  We shouldn't be reducing but we shouldn't be adding.  Just need to be putting down enough to make sure we maximize our yield potential.
Again, we are just in that "meh" area.
Where are current values in relation to the past
NOLA/New Orleans, Louisiana DAP price comparison
Number 5 exporter of DAP/MAP in 2021
Top 5 export destinations (2.6MMT exported in 2021)
  1. Canada (63%)
  2. Brazil (11%)
  3. Colombia (7%)
  4. Mexico (6%)
  5. Australia (5%)

Price comparisons

  • Vs 30 days ago - -6% or approximately $40 lower
  • Vs 90 days ago - -6% or approximately $40 lower
  • Vs 6 months ago - -22% or approximately $165 lower
  • Vs 1 year ago - -33% or approximately $300 lower

image 65141

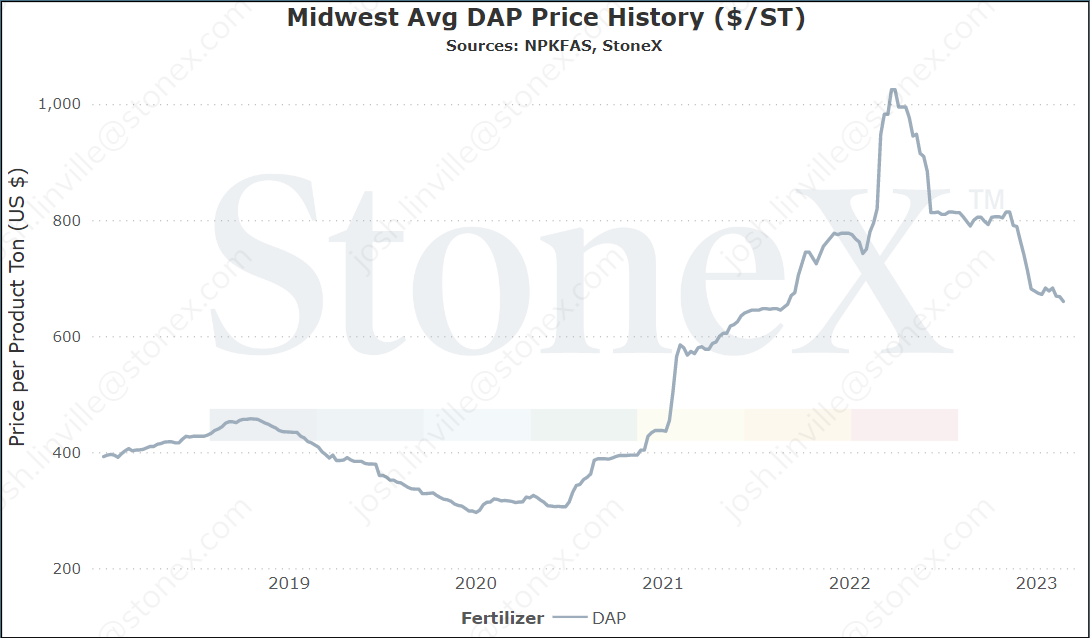
U.S. Midwest Average (using multiple points across Midwest) price comparison

  • Vs 30 days ago - -4% or approximately $28 lower
  • Vs 90 days ago - -14% or approximately $104 lower
  • Vs 6 months ago - -18% or approximately $140 lower
  • Vs 1 year ago - -30% or approximately $288 lower

image 65142

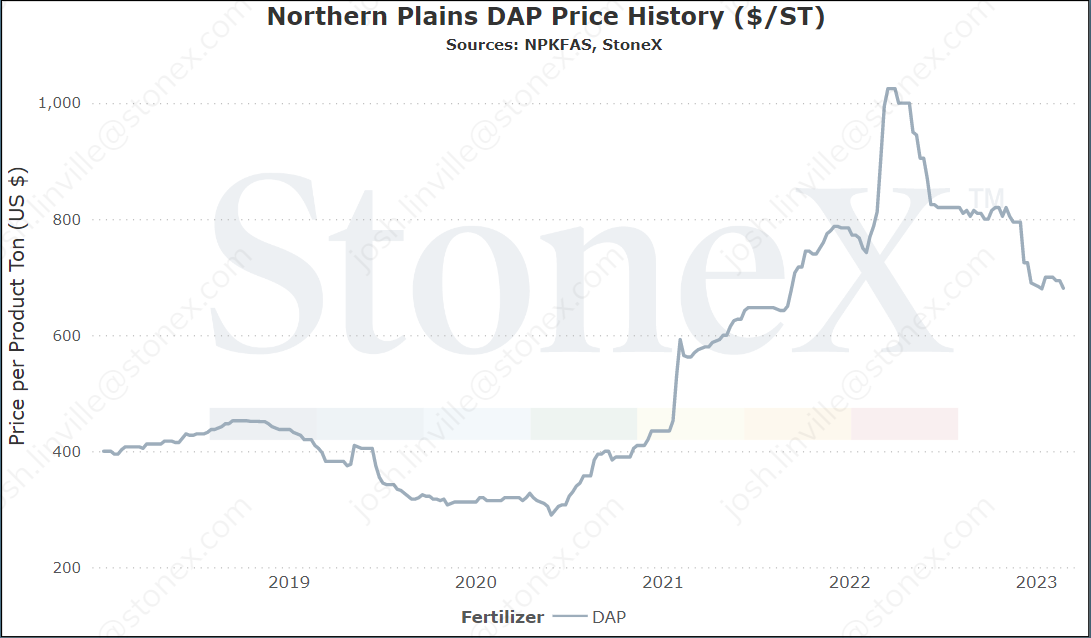
U.S. Northern Plains Average price comparison

  • Vs 30 days ago - -3% or approximately $19 lower
  • Vs 90 days ago - -14% or approximately $114 lower
  • Vs 6 months ago - -16% or approximately $134 lower
  • Vs 1 year ago - -25% or approximately $221 lower

image 65143

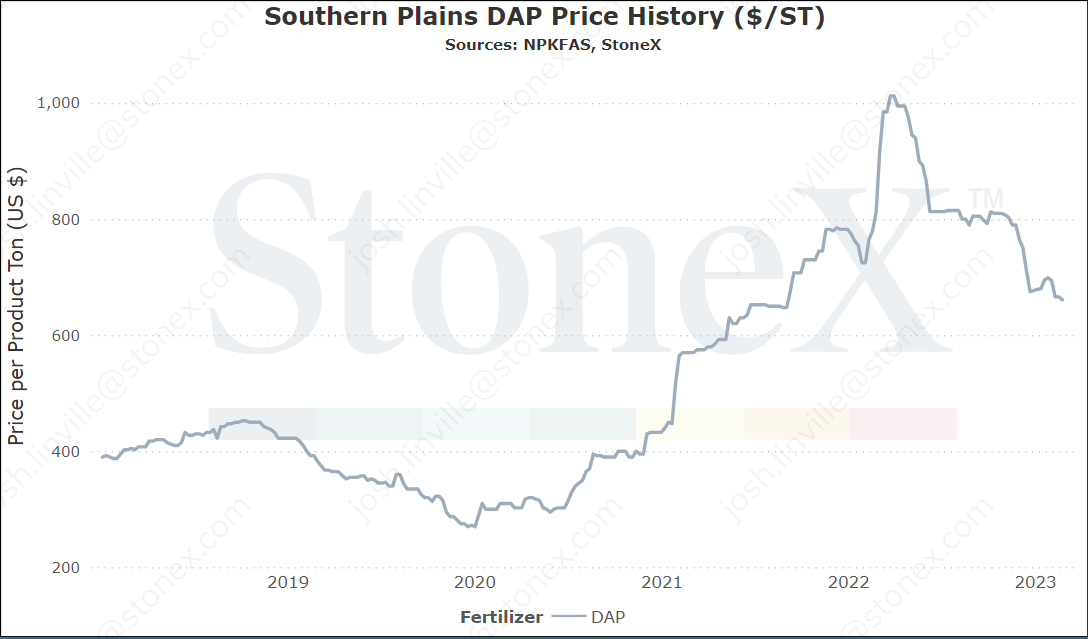
U.S. Southern Plains Average price comparison

  • Vs 30 days ago - -5% or approximately $38 lower
  • Vs 90 days ago - -14% or approximately $104 lower
  • Vs 6 months ago - -18% or approximately $144 lower
  • Vs 1 year ago - -28% or approximately $256 lower

image 65144

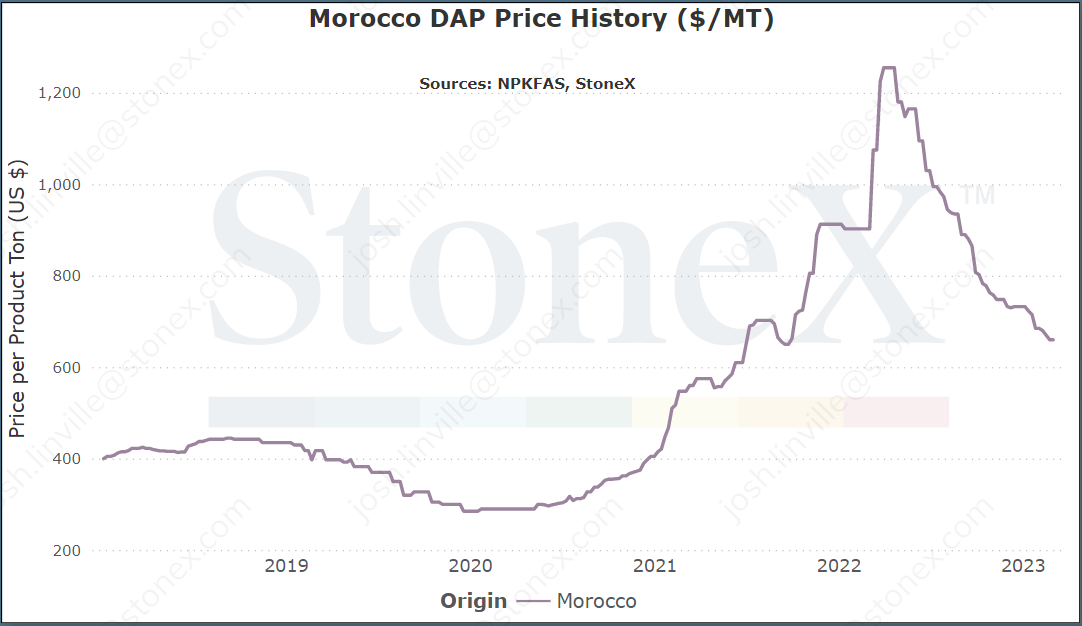
Morocco DAP price comparison

Number 2 exporter of DAP/MAP in 2021

Top 5 export destinations (7M exported in 2021)

  1. Brazil (28%)
  2. India (14%)
  3. Bangladesh (8%)
  4. Argentina (6%)
  5. Nigeria (4%)

Price comparisons:

  • Vs 30 days ago - -4% or approximately $25 lower
  • Vs 90 days ago - -10% or approximately $73 lower
  • Vs 6 months ago - -26% or approximately $230 lower
  • Vs 1 year ago - -27% or approximately $243 lower

image 65145

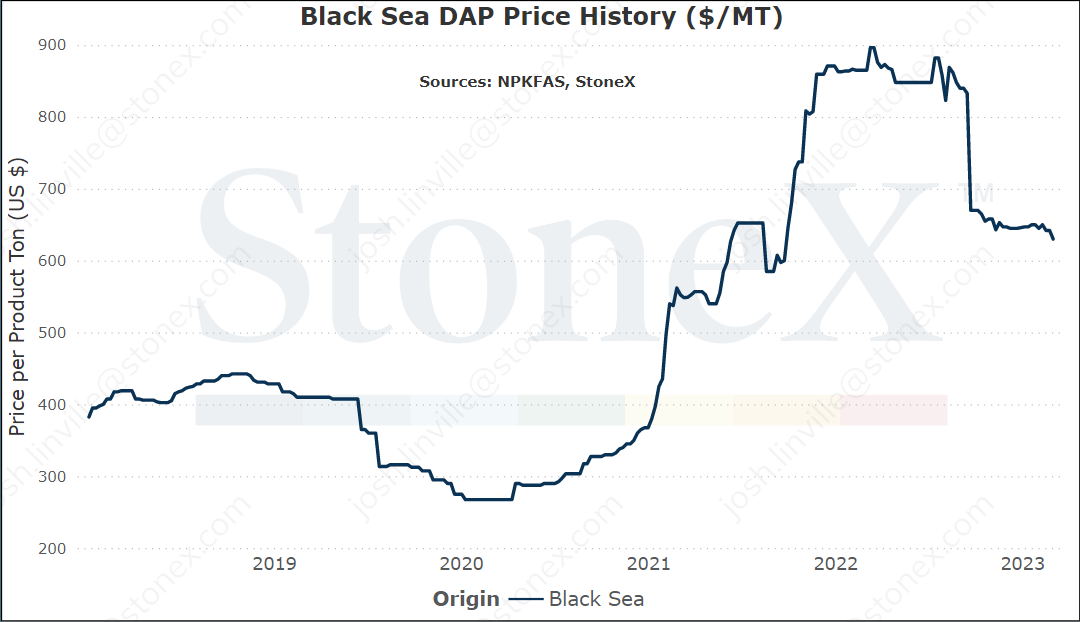
Black Sea DAP price comparison

Number 3 exporter of DAP/MAP in 2021

Top 5 export destinations (4MMT exported in 2021)

  1. India (42%)
  2. United States (21%)
  3. Australia (8%)
  4. Brazil (9%)
  5. Kenya (5%)

Price comparisons:

  • Vs 30 days ago - -3% or approximately $20 lower
  • Vs 90 days ago - -3% or approximately $17 lower
  • Vs 6 months ago - -25% or approximately $210 lower
  • Vs 1 year ago - -27% or approximately $235 lower

image 65146

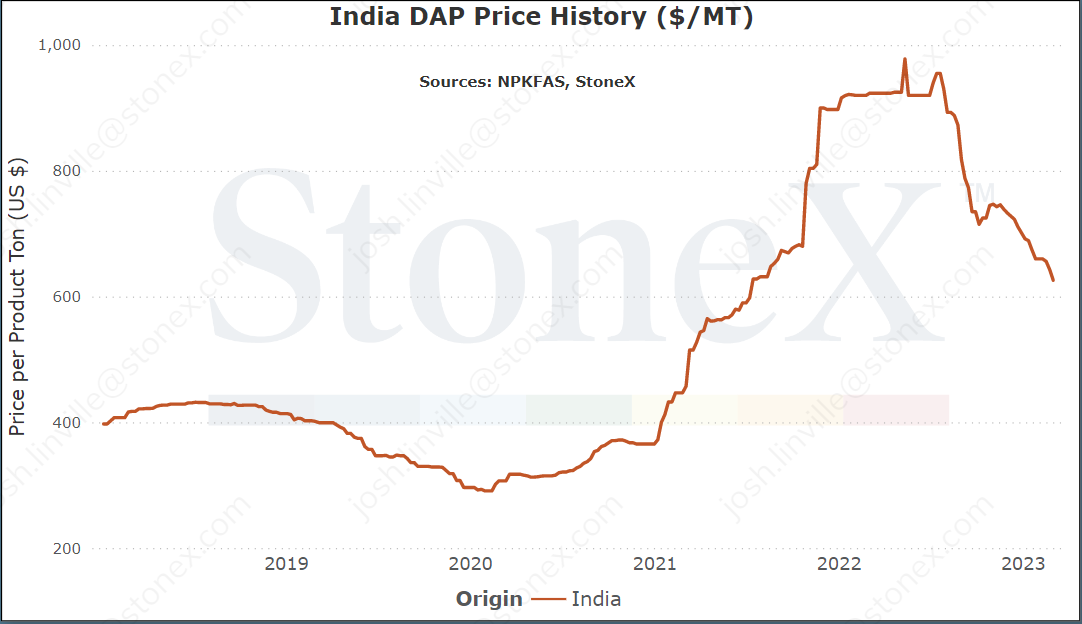
India DAP price comparison

Number 2 importer of DAP/MAP in 2021

Top 5 import origins (4.8MMT imported in 2021)

  1. China (39%)
  2. Saudi Arabia (35%)
  3. Morocco (20%)
  4. Jordan (3%)
  5. Russia (2%)

Price comparisons:

  • Vs 30 days ago - -5% or approximately $34 lower
  • Vs 90 days ago - -15% or approximately $107 lower
  • Vs 6 months ago - -23% or approximately $192 lower
  • Vs 1 year ago - -32% or approximately $298 lower

image 65147

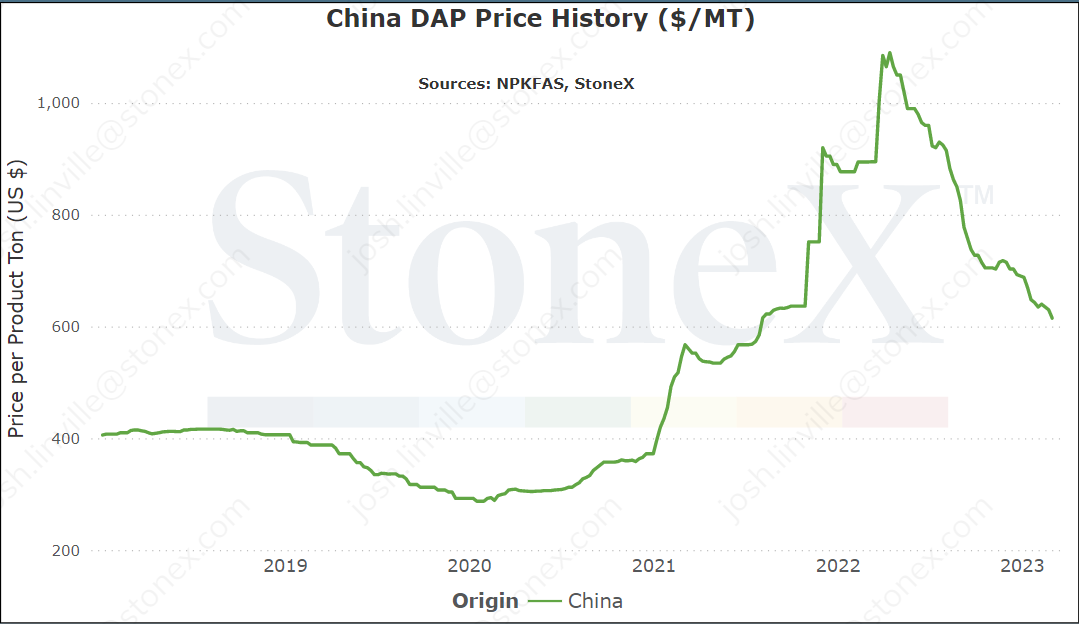
China DAP price comparison

Number 1 exporter of DAP/MAP in 2021

Top 5 export destinations (10MMT exported in 2021)

  1. Brazil (19%)
  2. India (19%)
  3. Pakistan (9%)
  4. Bangladesh (7%)
  5. Thailand (6%)

Price comparisons:

  • Vs 30 days ago - -4% or approximately $28 lower
  • Vs 90 days ago - -14% or approximately $100 lower
  • Vs 6 months ago - -25% or approximately $210 lower
  • Vs 1 year ago - -31% or approximately $280 lower

image 65148

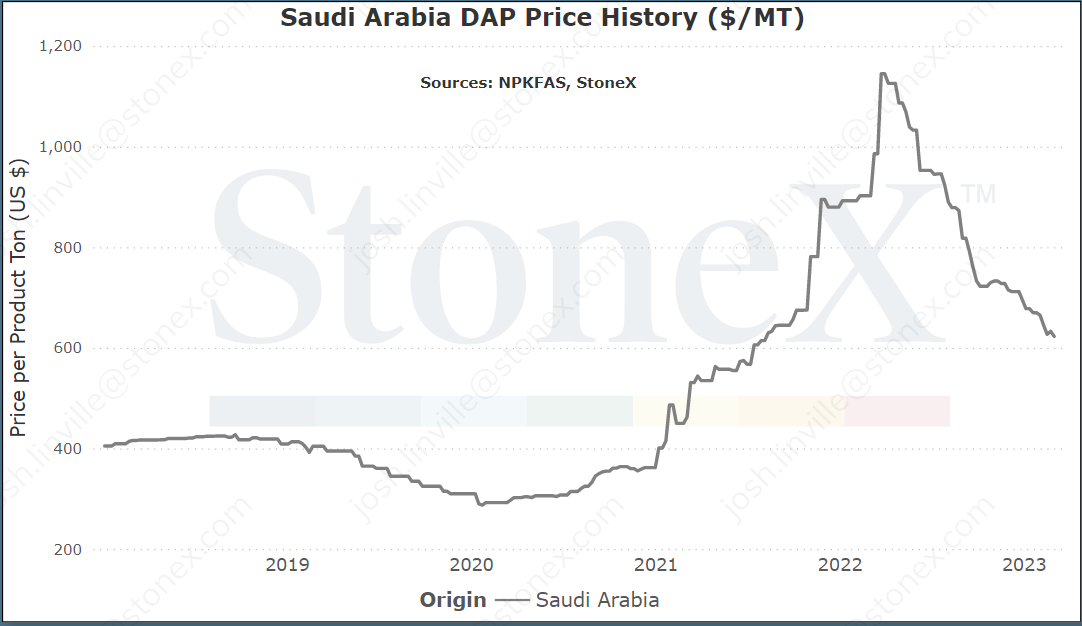
Saudi Arabia DAP price comparison

Number 3 exporter of DAP/MAP in 2021

Top 5 export destinations (4.1MMT exported in 2021)

  1. India (42%)
  2. United States (21%)
  3. Australia (9%)
  4. Brazil (8%)
  5. Kenya (5%)

Price comparisons:

  • Vs 30 days ago - -7% or approximately $47 lower
  • Vs 90 days ago - -13% or approximately $92 lower
  • Vs 6 months ago - -24% or approximately $195 lower
  • Vs 1 year ago - -31% or approximately $280 lower

image 65149

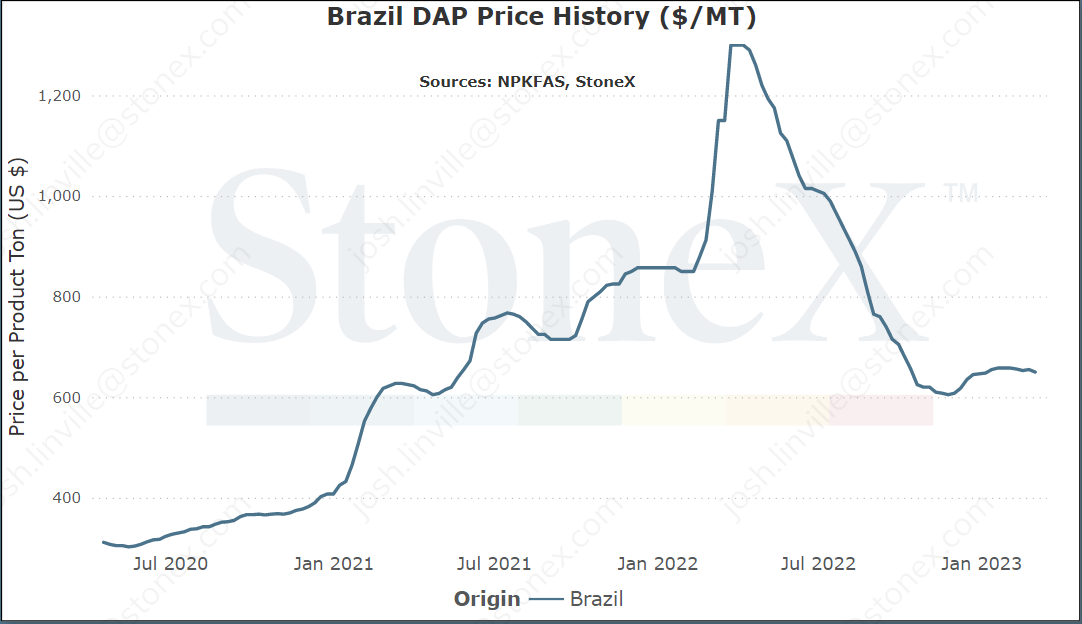
Brazil DAP price comparison

Number 1 importer of DAP/MAP in 2021

Top 5 import origins (6.15MMT imported in 2021)

  1. China (32%)
  2. Morocco (31%)
  3. Russia (24%)
  4. Saudi Arabia (5%)
  5. United States (5%)

Price comparisons

  • Vs 30 days ago - -1% or approximately $8 lower
  • Vs 90 days ago - +7% or approximately $43 higher
  • Vs 6 months ago - -15% or approximately $115 lower
  • Vs 1 year ago - -36% or approximately $360 lower

image 65150

Bull/Bear Factors
Because no market is ever guaranteed to go higher/lower, we try to consider the factors that can sway values so that we are able to act when they occur rather than react.
Bullish Factors
  • Grain/phosphate ratios better than last year – I know.  I know the price of phosphate is too high.  It is expensive vs what we are used to.  However, grain prices are high as well.  Again, I know.  They are not high enough!!  Still, the value is significantly better today than it was last year which could mean a big run of demand in the coming weeks.
  • Russia/China exports could slow – there is a strong case to be made that China (world's number 1 exporter) and Russia (world's number 4 exporter) could see exports slow in 2023.  China continues to rile up the world with their actions.  Russia continues to refuse to depart Ukraine.  I realize that anticipating either/both countries being shut from the world due to political situations is akin to forecasting Black Swan events.  However, that seems a higher likelihood today than it has been in the past.  It is something we need to watch and if we see either/both take further actions that causes action from the rest of the world, we need to expect higher prices.
  • Manufacturers could combat lower prices with lower production rates – today, this doesn't seem like a likely situation.  Manufacturers are still making money with NH3 values down and phosphate values still holding.  However, there is a lot of writing on the wall that the summer months could prove difficult to find sales.  It is extremely hard to limit manufacturing when it is still profitable but if the outlook appears bleak, that may be the decision.  If we see production flows slow/stop, prices could/should reflect that move.
Bearish Factors
  • Values still being historically high and demand smelling blood in the water could mean lower demand this spring – are we in a much better place today than we were a year ago?  Absolutely.  Does that mean phosphate prices are cheap?  Talk to most farmers and you will get a resounding "NO".  If we do not have a solid spring that results in wiping out inventories in the system, that means storage is already full going into summer.  That is a big factor that weighs on price ideas.
  • Futures market pointing to lower prices – for those unaware, NOLA DAP is a futures paper marketplace.  It isn't without its issues but it is a solid indicator of price movements.  Today, forward month price ideas are significantly lower than where we are today on the physical market.  I'm not sure we will see the spring number falls apart with just in time demand and a retail sector unwilling/unable to put product in place "in hopes" that demand steps forward.  However, once spring is done, those future predictions are likely to come true.
  • Corn prices are falling - last month, this was a situation that we needed to watch for.  This month, it is a reality.  Dec '23 corn values have finally broken below its recent $5.90 - $6 range.  Today, it sits just below $5.70.  I'm not saying this is the end of phosphate values as we know them, but it certainly doesn't help the demand situation.  Farmers balance sheets take a hit with every penny lower which means less money available to spend on inputs.  
Where are the current phosphate/grain ratio values today?
We believe that only looking at the flat price of either grains or fertilizer can be misleading:
  • Only selling grain can hurt you if fertilizer prices rise substantially
  • Only buying fertilizer can hurt you if grain prices fall
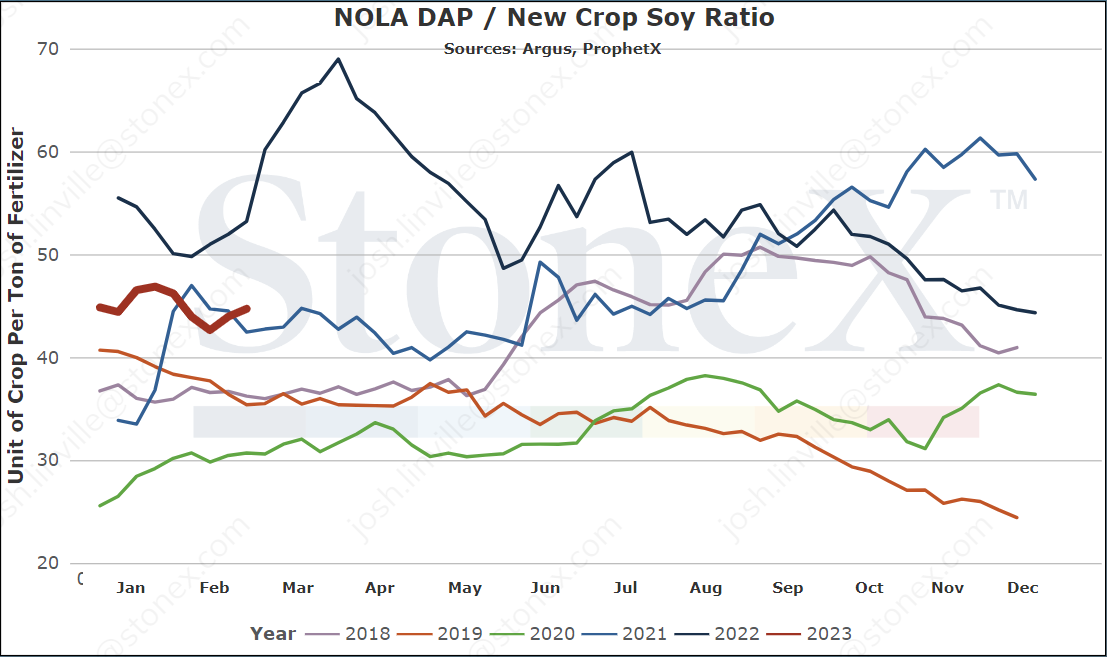
We look at the ratio "value" to get a better indication of where we are or how many bushels of X does it take to pay for 1 ton of fertilizer.
Would you rather:
  • Spend 120 bushels to pay for 1 ton of DAP
  • Spend 80 bushels to pay for 1 ton of DAP
When we compare the current ratio value against recent years, we start to see if we are high or low.
YOUR VALUES WILL LOOK DIFFERENT
This graph looks at the NOLA DAP price vs the flat grain price. There are no logistics on either product. Your location will look different due to fertilizer logistical costs, grain basis, etc.
image 65088
image 65089
image 65090
image 65091
image 65092image 65093
image 65094
image 65095
image 65096
Josh Linville’s focal points
  • Chinese export levels - how can we consider a market and not focus on the single largest producing/exporting country in the world?  Unfortunately, the largest country is China which means information flow can be tough to come by.  2022 export levels were disappointing when compared to their 3-year average.  There are hopeful signs that exports could return to normal.  However, there are signs that they could limit exports once again.  They will go a long way in determining the marketplace.
  • Grain levels - another hit that isn't fertilizer specific are the grain markets.  Specifically, corn values.  December 2023 corn values had been holding very well in the $5.90 - $6 range.  That made it easier to justify higher phosphate values.  Today, December 2023 is trading sub $5.70...if, and that is a big if, corn values continue to fall, it will be hard to justify phosphate values holding because demand is going to be scarce.
  • Russia/Ukraine - Russia is the 4th largest exporter in the world and they seem content to continue angering the world by invading and attacking Ukraine.  If they continue to escalate, we could see a new wave of economic sanctions that target their fertilizer exports.  See Iran for an example.  If that happened, we could actually see their exports slow and leave the world less supplied than normal.  Today, they are shipping to different destinations which means the global S&D is unchanged.  If the world shuts them down, THAT changes the world S&D.

All data was sourced from StoneX unless otherwise noted.

This material should be construed as market commentary, merely observing economic, political and/or market conditions, and not intended to refer to any particular trading strategy, promotional element or quality of service provided by the FCM Division of StoneX Financial Inc. (“SFI”), StoneX Financial (Canada) Inc. (“SFFC”) or StoneX Markets LLC (“SXM”). SFI, SFFC and SXM are not responsible for any redistribution of this material by third parties, or any trading decisions taken by persons not intended to view this material. Information contained herein was obtained from sources believed to be reliable, but is not guaranteed as to its accuracy. Contact designated personnel from SFI, SFFC or SXM for specific trading advice to meet your trading preferences. These materials represent the opinions and viewpoints of the author, and do not necessarily reflect the viewpoints and trading strategies employed by SFI, SFFC or SXM. The FCM Division of StoneX Financial Inc., a subsidiary of StoneX Group Inc., is a member of the National Futures Association (“NFA”) and registered with the U.S. Commodity Futures Trading Commission (“CFTC”) as a futures commission merchant and commodity trading advisor. StoneX Financial (Canada) Inc. is currently registered as a Futures Commission Merchant or equivalent in all provinces of Canada and is a member of the Investment Industry Regulatory Organization of Canada.


  • Fertilizers

This material should be construed as the solicitation of an account, order, and/or services and represents the opinions and viewpoints of the individual authors or presenters. It does not constitute an individualized recommendation or take into account the particular trading objectives, financial situations, or needs of individual customers.


The views are current only through the date stated and are subject to change at any time based upon market or other conditions, and StoneX Group Inc. (“SGI”) disclaims any responsibility to update such views. Actual results, performance, or achievements may differ materially from those expressed or implied. Information is based on data gathered from what we believe are reliable sources. Past performance does not guarantee future results.


The StoneX Group Inc. group of companies provides financial services worldwide through its subsidiaries, including physical commodities, securities, exchange-traded and over-the-counter derivatives, risk management, global payments and foreign exchange products in accordance with applicable law in the jurisdictions where services are provided.


References to certain OTC products or swaps are made on behalf of StoneX Markets, LLC (SXM), a member of the National Futures Association (NFA) and provisionally registered with the U.S. Commodity Futures Trading Commission (CFTC) as a swap dealer. SXM’s products are designed only for individuals or firms who qualify under CFTC rules as an ‘Eligible Contract Participant’ and who have been accepted as customers of SXM.


StoneX Financial Inc. (SFI) is a member of FINRA/NFA/SIPC and registered with the MSRB. SFI is registered with the U.S. Securities and Exchange Commission (SEC) as a Broker-Dealer and with the CFTC as a Futures Commission Merchant and Commodity Trading Advisor. StoneX Financial (Canada) Inc. (SFCI) is registered in Canada and is a member of CIRO and CIPF. References to certain securities trading are made on behalf of the BD Division of SFI and are intended only for an audience of institutional clients as defined by FINRA Rule 4512(c). References to certain exchange-traded futures and options are made on behalf of the FCM Division of SFI. Wealth Management is offered through SA Stone Wealth Management Inc., member FINRA/SIPC, and SA Stone Investment Advisors Inc., an SEC-registered investment advisor, both wholly owned subsidiaries of SGI.

R.J. O’Brien & Associates, LLC (RJO) is registered with the CFTC as a Futures Commission Merchant and is a member of NFA.


StoneX Financial Ltd (SFL) is registered in England and Wales, company no. 5616586. SFL is authorized and regulated by the Financial Conduct Authority (FCA) (registration number FRN:446717) to provide services to professional and eligible customers including: arrangement, execution and, where required, clearing derivative transactions in exchange traded futures and options. SFL is also authorized to engage in the arrangement and execution of transactions in certain OTC products, certain securities trading, precious metals trading and payment services to eligible customers. SFL is authorized and regulated by the FCA under the Payment Services Regulations 2017 for the provision of payment services. SFL is a category 1 ring-dealing member of the London Metal Exchange. In addition SFL also engages in other physically delivered commodities business and other general business activities which are unregulated and not required to be authorized by the FCA.


This communication is issued in the European Economic Area by StoneX Financial Europe GmbH (SFEG). StoneX is the trade name used by STONEX GROUP INC. and all its associated entities and subsidiaries. StoneX Financial Europe GmbH (“SFEG”) is a securities trading firm registered in Germany under Company No. HRB 80844.


StoneX Financial Pte Ltd (Co. Reg. No 201130598R) (“SFP”) is regulated by the Monetary Authority of Singapore and is a Capital Markets Service Licence holder (for dealing in capital market products), an Exempt Financial Adviser (for advising on investment products and issuing or promulgating analyses/ reports on investment products) and a Major Payment Institution (for domestic and cross-border money transfer services).


SFP may distribute analysis/report produced by its respective foreign affiliates within the StoneX Group of companies pursuant to an arrangement under Regulation 32C of the Financial Advisers Regulations Recipients should contact SFP at (65) 6309 1000 for any matters arising from, or in connection with, this webinar.


StoneX APAC Pte. Ltd. (“SAP”) (Co. Reg. No 200616676W) is regulated as a Dealer (PS20190001002) under the Precious Stones and Precious Metals (Prevention of Money Laundering and Terrorism Financing) Act 2019 for purposes of anti-money laundering and countering the financing of terrorism.


StoneX Financial (HK) Limited (CE No.: BCQ152) (“SHK”) is regulated by the Hong Kong Securities and Futures Commission for Dealing in Securities and Dealing in Futures Contracts.


StoneX Financial Pty Ltd (ACN 141 774 727) holds an Australian Financial Service License (AFSL: 345646) for Dealing in Securities, Exchange-Traded Derivatives Contracts, OTC Derivatives Contracts and Foreign Exchange Contracts, and is regulated by the Australian Securities and Investments Commission.


StoneX Securities Co., Ltd. (“SSJ”) (Co. Reg. No 010401047199) is regulated by the Japanese Financial Services Agency as a Type-I Financial Instruments Business Operator (Kanto Local Finance Bureau (FIBO)No.291’), is a member of the Financial Futures Association of Japan for dealing and broking FX and FX Option transactions, and is a member of the Japan Securities Dealers Association for dealing and broking stock indices and option transactions.


Trading swaps and over-the-counter derivatives, exchange-traded derivatives and options and securities involves substantial risk and is not suitable for all investors. Past performance of any futures or option is not indicative of future success. Indicators are not a trading system and are not published as a specific trade recommendation. The information herein is not a recommendation to trade nor investment research or an offer to buy or sell any derivative or security. It does not take into account your particular investment objectives, financial situation or needs and does not create a binding obligation on any of the StoneX group of companies to enter into any transaction with you. You are advised to perform an independent investigation of any transaction to determine whether any transaction is suitable for you. No part of this material may be copied, photocopied or duplicated in any form by any means or redistributed without the prior written consent of StoneX Group Inc.


The report/analysis herein is not directed to, or intended for distribution to or use by, any person or entity who is a citizen or resident of or located in any locality, state, country or other jurisdiction where such distribution, publication, availability or use would be contrary to law or regulation.


© 2026 StoneX Group Inc. All Rights Reserved.

Satellite view of Earth at night showing illuminated cities across Asia and the Middle East

Discover more insights

Our subscribers have access to comprehensive market analysis from StoneX spanning commodities, equities, currencies and more.

StoneX: We open markets

Our market expertise, advanced platforms, global reach, culture of full transparency and commitment to our clients’ success all set us apart in the financial marketplace.

Reach

With access to 40+ derivatives exchanges, 180+ foreign exchange markets, nearly every global securities marketplace and numerous bi-lateral liquidity venues, StoneX’s digital network and deep relationships can take clients anywhere they want to go.

Transparency

As a publicly traded company meeting the highest standards of regulatory compliance in the markets we serve; our financials and record of accomplishment are matters of public record. StoneX’s commitment to “doing the right thing over the easy thing” sets us apart in the industry and helps us build respect, client trust and new partnerships.

Expertise

From our proprietary Market Intelligence platform, to “boots on the ground” expertise from award-winning traders and professionals, we connect our clients directly to actionable insights they can use to make more informed decisions and achieve their goals in the global markets.