Quarterly Commodities Outlook is available for free now.  Download your report  →

StoneX logo

Farmer Fertilizer Focus - Urea

By: Josh Linville, Vice President- Fertilizer

 
November '22 UREA
 
Josh Linville
Vice President - Fertilizer
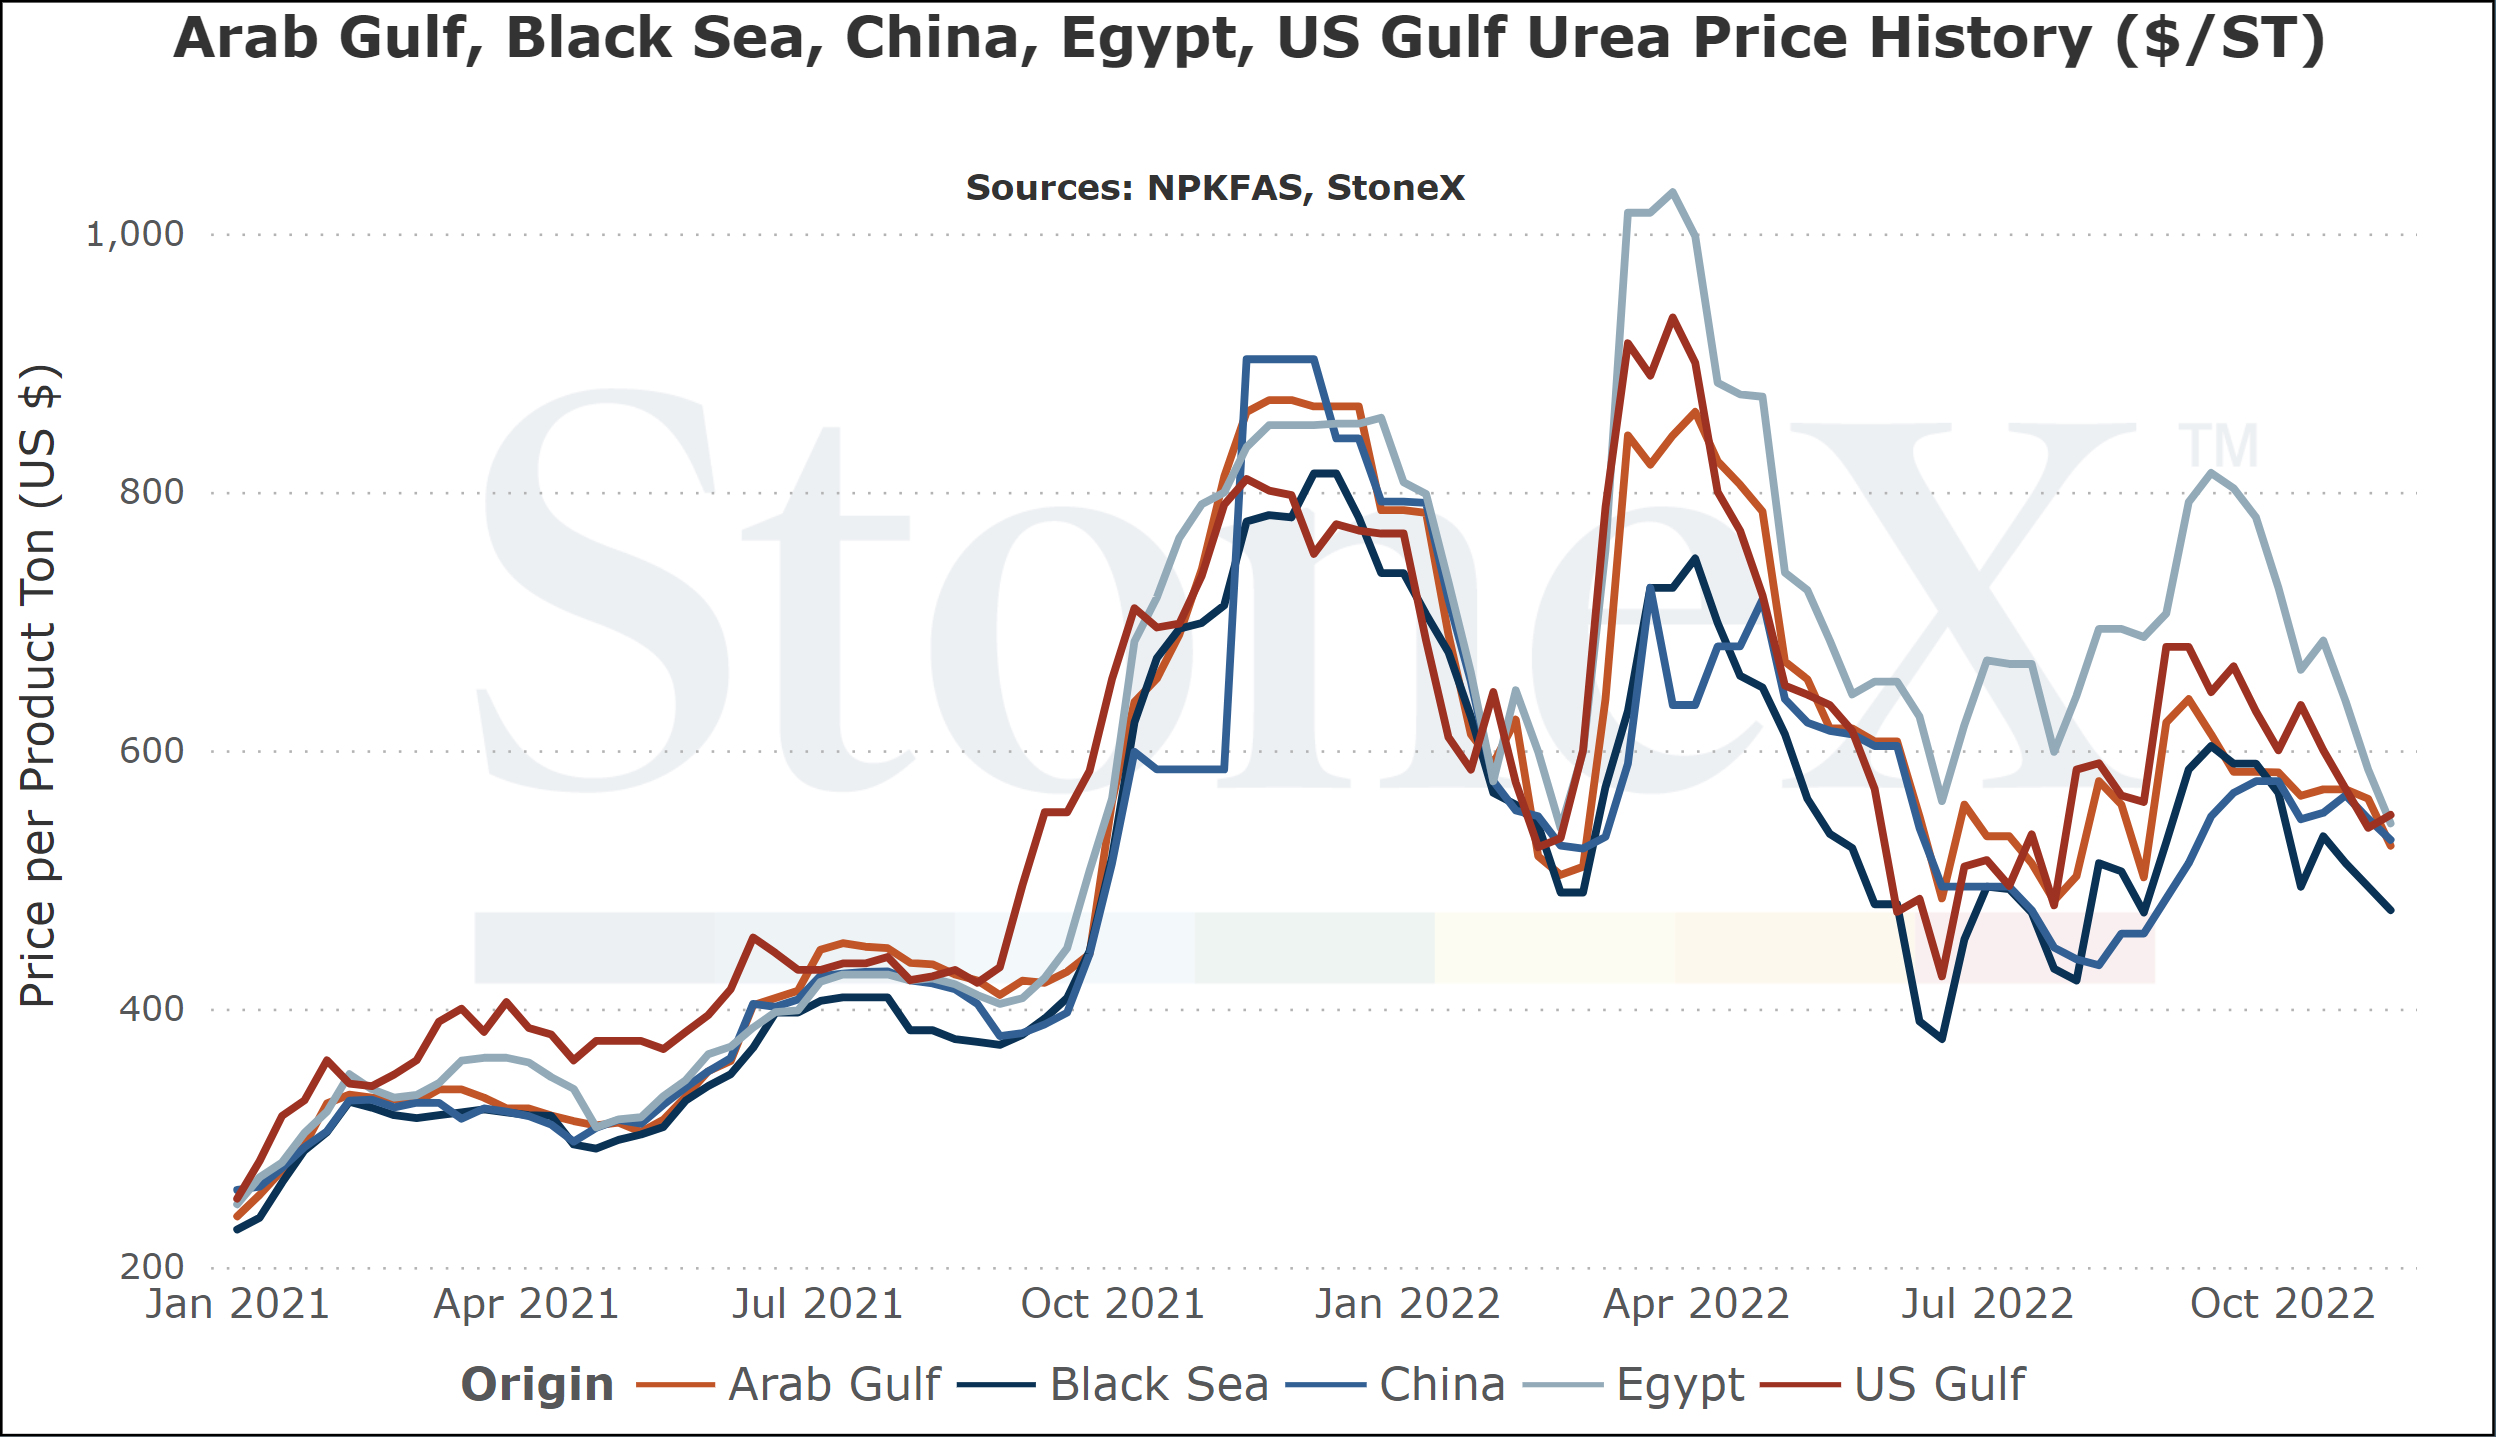
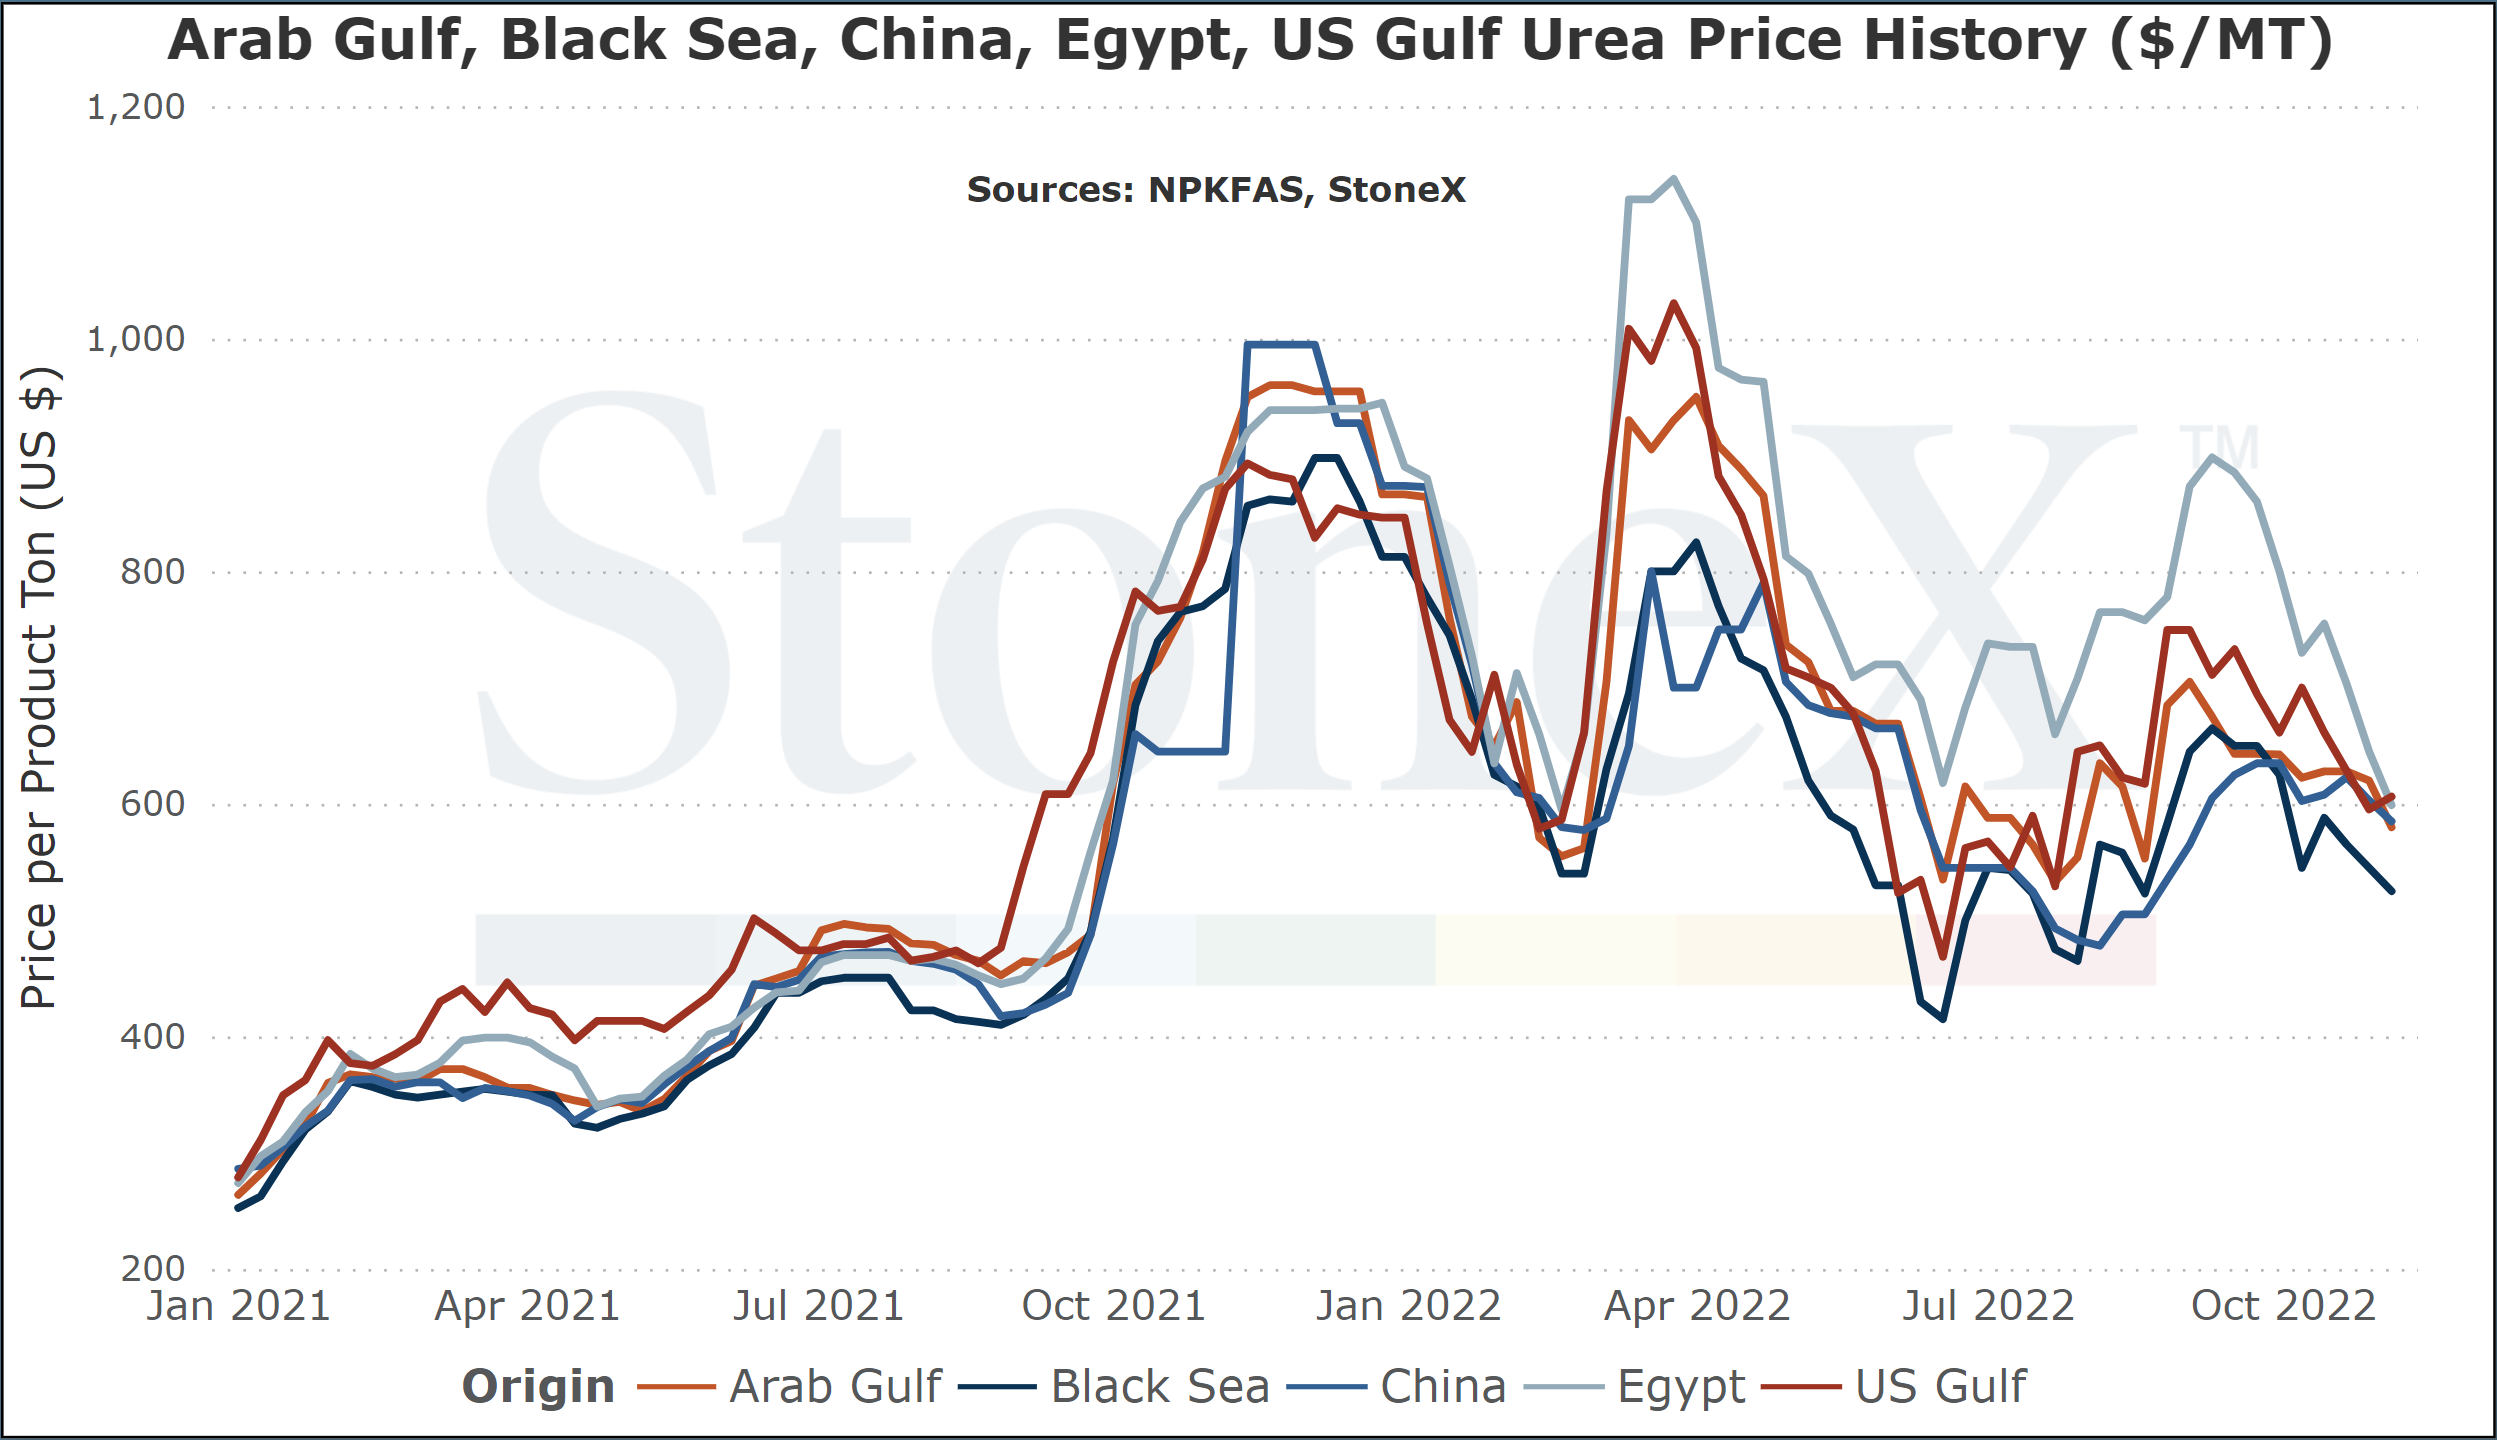
major global urea export location price graphs
The intention of the below graphs are not to use to say "my price should be X based on this graph".  These prices are indicated from an FOB price point average.  The intent is to show major global price movement trends.  I have opted to include US Gulf/NOLA in these graphs due sometimes on/sometimes off again export capability.  Also to show N.A. values in relation to the rest of the world.
The first graph shows these prices reflected in metric ton.  The second graph in short ton.  Both are listed using USD as the currency.
image 54414
image 54415
What everyone wants to know first, what do we think will happen going forward
Well, called it wrong last month!!
Last month, I wrote that I thought values whole hold/push higher.  European production was still offline with natural gas values still far too high to support even the thought of a restart.  Global demand continued to look promising.  Urea was a solid discount to UAN.
2nd times a charm?!
 While we are seeing European production restart and have been surprised at the recent price drop, I continue to believe that global urea values are going to be supported going forward.

UAN and NH3 values remain big premiums when compared against current urea values.  That should mean a solid amount of demand switching over which will bolster price ideas.  There is a solid amount of global demand coming after India wraps up their current tender.  While Europe is restarting, we still have lost production time and operating rates are still not going to be 100%.  We also continue to see grain values holding high values.

All of these combine to more paths toward higher prices than lower.  Anything is possible, of course, but there are enough indicators pointing higher that it has convinced me. 

Should you buy your spring '23 urea needs today
My POV is unchanged:  I would start leaning more heavily into it
I would NOT be ok if you read that statement, went out, bought all of your yearly urea needs and then did nothing on grains.  That still scares the crap out of me.  If you are going to lock up your urea needs, consider selling a piece of grain to offset the purchase as a hedge.
However, with all the global demand coming, worth taking a real hard look at your needs for next year.  Getting harder and harder to see a path where prices tumble.
What has happened in the last 30 days?
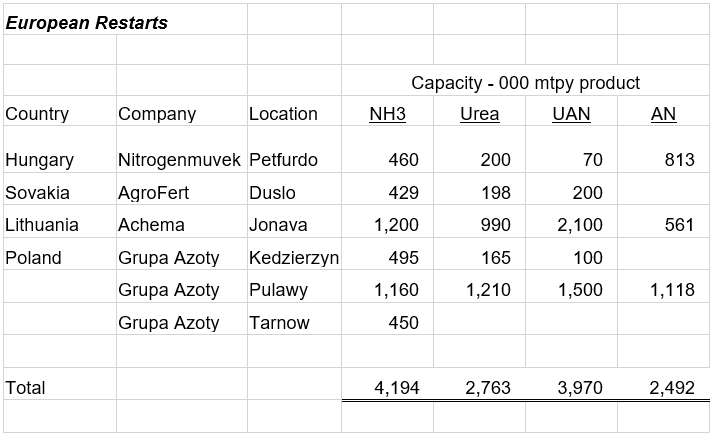
Europe has started to restart!
I know I have spent several months talking about what would happen if Europe restarted production.  As much as I would love to take credit for seeing this coming, I didn't.  I thought it was a very low probability scenario but the ramifications were big enough that we needed to watch.
Well, regardless, here we are.
A quick recap for those that are new:
Typically, European natural gas values have been priced in the single digits.  Supplies from Russia, their main supplier, have been more than ample and governments have been making hard pushes toward green energy.  Solid supply and lowering demand meant prices were steady to lower.  This meant that European nitrogen fertilizer production was steady and a market that most rarely looked at.
Then the conflicts started.  Russia pushed to open their Nordstream 2 pipelines which European countries fought.  Eventually, the fight became severe enough that Russia started reducing shipments.  This would further fueled by Putin's decision to invade Ukraine.  In the end, Russia halted all natural gas shipments to Europe and values went from single digits to just over $100.
The nitrogen result was the majority of production in the region shut down.  Operating rates fell to the 15 - 30% range as nitrogen facilities bled money.  It simply didn't make financial sense so the plants shut down.  From a longer term POV, it appeared they would be down for a long time as nat gas values were expected to stay high.  However, as the fertilizer markets have taught us time and time again, never say never.
A combination of countries stockpiling natural gas inventories, industrial demand waning, imports coming in strong and a warm fall/start to winter have all combined for natural gas values to fall into the upper $30's.  This has resulted in several plants restarting.
Some plants, such as those in Poland, have been vocal about their restart plans.  Others have been a little more shy, rightfully so from their POV.  If they announced they were restarting, it meant global markets knew more supply was coming online which would eliminate European demand for the rest of the world.  The result would likely be negative to prices so better to stay silent.
Today, we continue to hear rumors that other plants are planning restarts just to ensure the plants work again.  Nitrogen plants are difficult enough to restart when offline for a short time and outside temperatures are high.  When the downtime gets long and temps fall, it gets much harder.  Some of these plants are old enough that there is a certain fear that if they are offline thru winter, they may never restart.  Better to restart them today when the owners are going to lose a little money than risk that the plant is lost forever.
Ultimately, the global S&D improved with this situation but the story is not completely told.  Europe will remain our focal point going forward as it can sway the market.
image 54420
image 51277
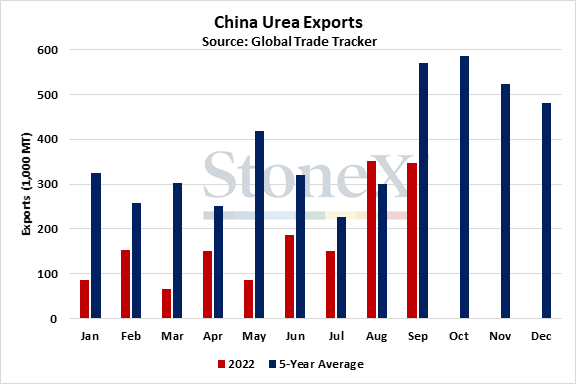
Chinese exports are improving
I'm not going to write this and act like everything is back to normal for Chinese urea exports.  Just pointing out that the situation has improved.
Looking at August exports, the total just barely edged out the 5-year average which doesn't seem like much of a storyline.  However, when you look at the August jump vs the remainder of 2022, it is a sizeable shift from one of the more important global exporters.
What happens thru Q4 '2 will be very important.  That is China's typical heavy export period.  Unfortunately, we believe that exports will be much lower than the 5-year average and data from September reflect that.  The government is letting a little more product flow out of country but is still being restrictive.
Ultimately, we believe that further export bans will be put in place on January 1, 2023.  This way the government can ensure adequate supply for Chinese farmers as well as a lower domestic price.  Today is providing a little hope that normal trade patterns are returning.  I just wouldn't get too excited that it is the case...
image-20221104161235-1
NOLA Urea is cheap vs alternatives
Same story as last month but updating the values since it has gotten WIDER
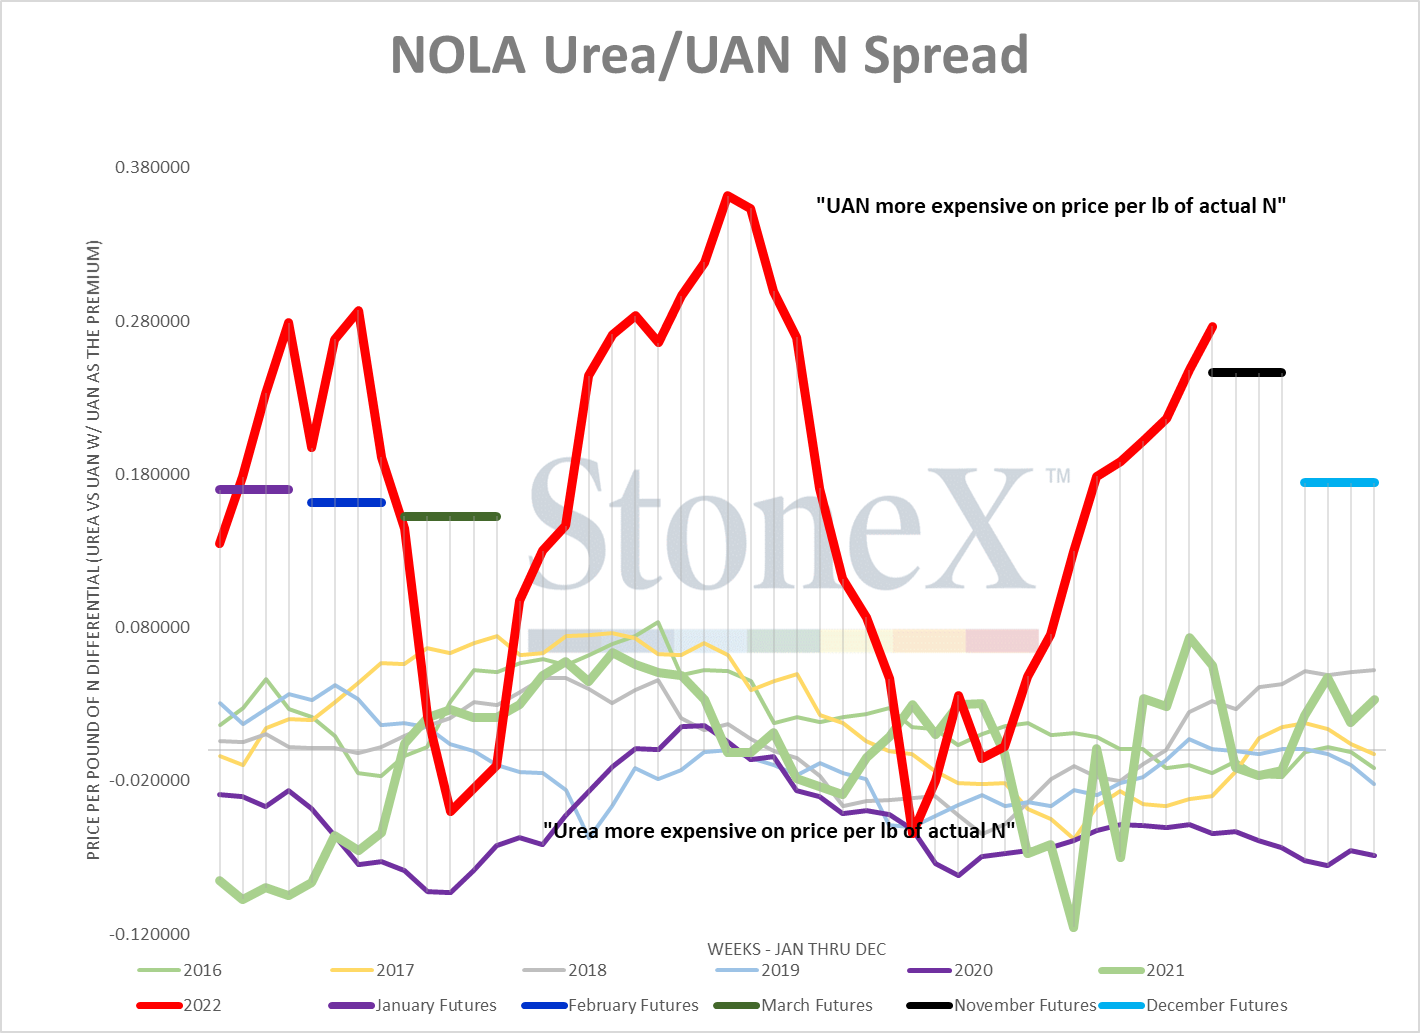
Cheap isn't exactly the term that a lot of buyers want to see, but when compared to UAN and NH3, it is just that.
Current NOLA urea - $550 or approximately $0.60/lb of actual N
Current NOLA UAN - $550 or approximately $0.86/lb of actual N
Current Midwest NH3 - $1,300 or approximately $0.79/lb of actual N
Looking at the current NOLA urea vs UAN differential puts UAN at a 26 cent premium.  As the historical chart shows below, that is on the upper end of recent years.  Maybe not as bad as some of the spikes in the last year, but certainly higher than normal.
image 54427
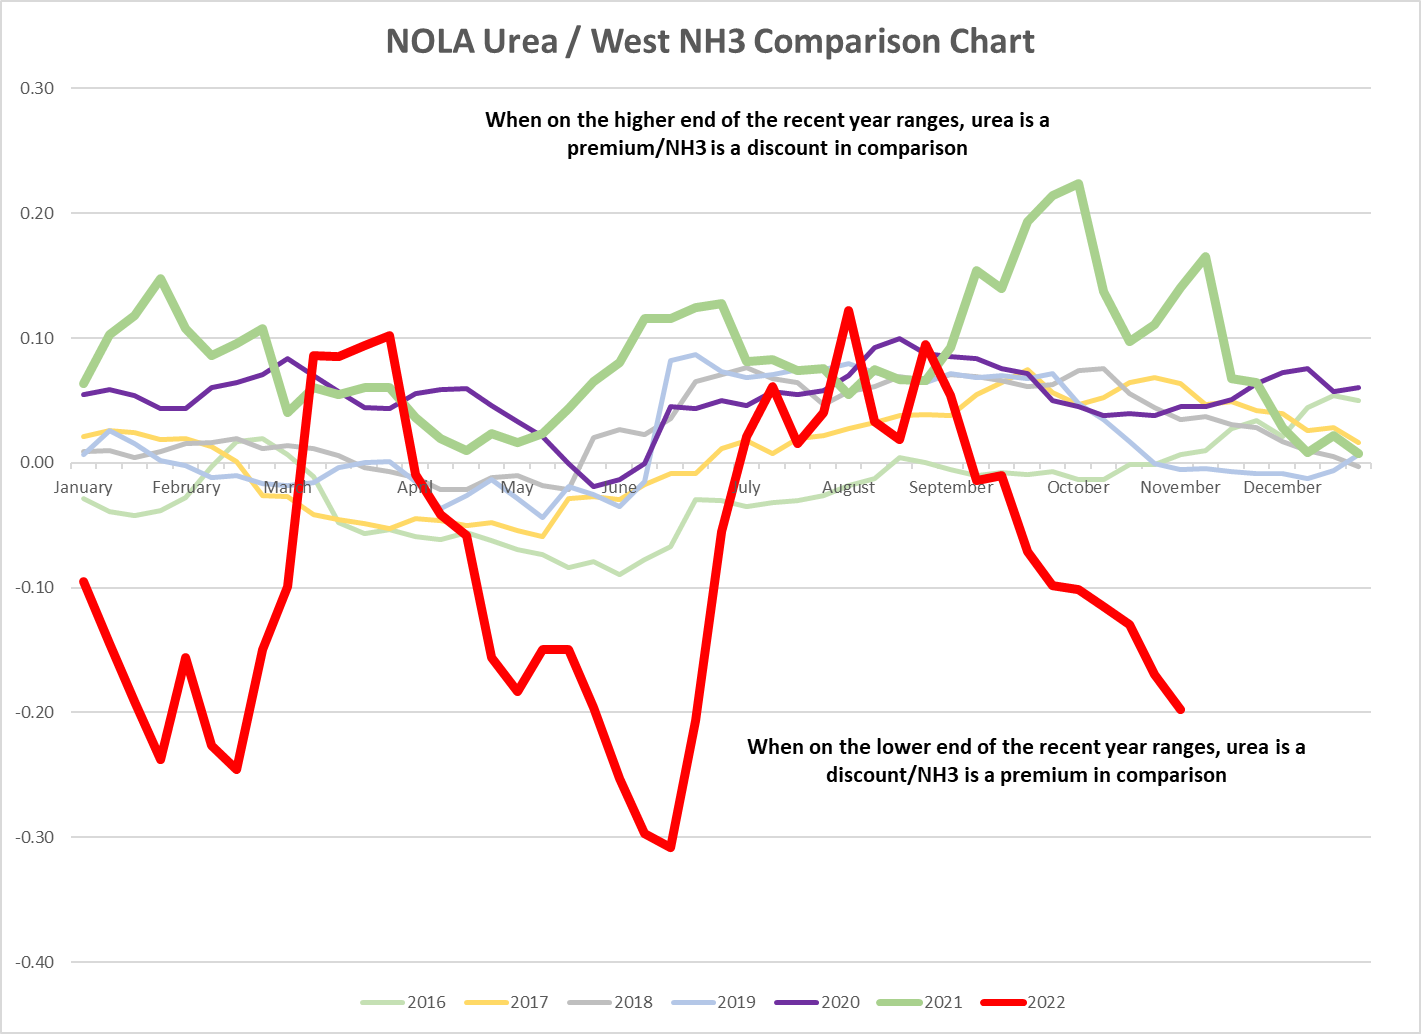
Even more surprising is the spread between NOLA urea and Midwest NH3.  Today, we put that value at around 19 cents with NH3 the premium.  While these 2 points are much different, a pattern emerges when you look over the last few years.  There have been periods when the spread was wider to the downside, but not by much and not very often.
image 54428
These are things we will need to continue to monitor going forward as they have a tremendous impact on demand.
India secures 1.5mmt, then shocks the world with an immediate tender for another 1mmt
In order to keep the system fair and eliminate corruption, the Indian government follows a unique approach to purchasing their fertilizers.  Rather than just buying product as they need it, they issue purchase tenders.
In this tender, offer parties have a set amount of time to compile their tonnage and price to submit.  Once the deadline passes, the offers are opened and the results published to the world.  This is why these tenders are so highly anticipated.  It is an open process that gives an unfettered POV of the current world marketplace.
Once the offer information is shared, negotiations begin.  The lowest price for each coast is determined to be the "L1".  From there, every other offer is approached and asked if they would like to reduce their offer price to the L1 to participate.  The offer either agrees and signs a contract or declines which causes India to move to the next layer.  Eventually, either India buys what it wants or it runs out of offers.
During October, India completed their most recent purchase tender.  They secured 1.5mmt which was mostly in line with world estimates.  However, not long after contracts were signed, another tender for 1.0mmt was announced.  Some believe that the quick turnaround was due to a need for more product.  Others, myself included, believed they were stepping in early with world prices dropping and no other world competition meaning they could secure cheap values.
This announcement caused world urea values to rebound.  Egypt was the easiest to view with physical sales climbing from $545 on Tuesday to $630 by Thursday.  Solid rally for 48 hours.
Now, we need to wait and see how the offers come in.  Will offers hold the higher price ideas that have been established shortly after the announcement?  Will they cut their price to make sure they clear inventories?
Going to be an interesting storyline.
North American logistics suffer
As you are likely aware, since it is all over the news, North American logistics are struggling.
This has been most visible in the river systems.  Specifically, the lower Mississippi River.  Water flows have dropped to almost record lows which has hurt barge traffic.  For much of the N.A. urea marketplace, barge traffic is absolutely necessary.
Fortunately, dredging operations have continued to keep traffic flowing and river boat captains and crews are busting their butts to make sure they move as quickly as possible.  Unfortunately, best efforts are still coming up short of normal movements.
This has been made worse by the fear that railroad workers will strike later this month.  If North America were to lose both rail traffic and barge traffic, we will soon learn the importance of both...
For urea, you are likely not going to see your local price move lower with global/NOLA values.  With logistics struggling, the cost to move goods has gone up significantly.  Any dip in price ideas has been met with a higher jump in logistical costs.
Hopefully a strike will be averted and current rains help improve waterways.  
I really do not want to add this to the Black Swan list...

Where are current values in relation to the past
NOLA/New Orleans, Louisiana 
  • Vs 30 days ago - -13% or approximately $85 lower 
  • Vs 90 days ago - -7% or approximately $40 lower
  • Vs 6 months ago - -14% or approximately $93 lower
  • Vs 1 year ago - -30% or approximately $240 lower

U.S. Midwest Average

  • Vs 30 days ago - -8% or approximately $58 lower
  • Vs 90 days ago - -1% or approximately $5 lower
  • Vs 6 months ago - -12% or approximately $86 lower
  • Vs 1 year ago - -23% or approximately $188 lower

U.S. Southern Plains Average

  • Vs 30 days ago - -9% or approximately $58 lower
  • Vs 90 days ago - -2% or approximately $15 lower
  • Vs 6 months ago - -13% or approximately $88 lower
  • Vs 1 year ago - -19% or approximately $145 lower

U.S. Northern Plains Average

  • Vs 30 days ago - -1% or approximately $10 lower
  • Vs 90 days ago - +5% or approximately $33 higher
  • Vs 6 months ago - -6% or approximately $40 lower
  • Vs 1 year ago - -16% or approximately $130 lower

Middle East

  • Vs 30 days ago - -6% or approximately $35 lower
  • Vs 90 days ago - -9% or approximately $55 lower
  • Vs 6 months ago - -20% or approximately $142 lower
  • Vs 1 year ago - -35% or approximately $315 lower

Egypt

  • Vs 30 days ago - -18% or approximately $131 lower
  • Vs 90 days ago - -22% or approximately $166 lower
  • Vs 6 months ago - -25% or approximately $199 lower
  • Vs 1 year ago - -32% or approximately $282 lower

Black Sea

  • Vs 30 days ago - -4% or approximately $20 lower
  • Vs 90 days ago - -7% or approximately $40 lower
  • Vs 6 months ago - -15% or approximately $95 lower
  • Vs 1 year ago - -33% or approximately $260 lower

China

  • Vs 30 days ago - -3% or approximately $18 lower
  • Vs 90 days ago - +22% or approximately $107 higher
  • Vs 6 months ago - -15% or approximately $100 lower
  • Vs 1 year ago - -9% or approximately $60 lower

Brazil

  • Vs 30 days ago - -8% or approximately $50 lower
  • Vs 90 days ago - -10% or approximately $65 lower
  • Vs 6 months ago - -20% or approximately $150 lower
  • Vs 1 year ago - -27% or approximately $225 lower
Bull/Bear Factors
Because no market is ever guaranteed to go higher/lower, we try to consider the factors that can sway values so that we are able to act when they occur rather than react.
Bullish Factors
  • While Europe is restarting, we have already lost time and operating rates will not be 100% – European nitrogen production restarting has been the surprise of the month.  While this helps to improve the outlook, some damage is already done from lost production.  We also do not anticipate operating rates returning to 100%.  This has been an improvement but Europe is still suffering.
  • We expect China to ban exports again – during normal times, China accounts for 10% of global urea exports.  Fortunately for buyers, they have returned to exporting at smaller levels.  Unfortunately for buyers, we do not expect this to last long as rumor in the market is that another ban will be put in place January 1, 2023.
  • Strong 2023 outlook for demand - our corn acre estimate has grown from 90M to 91M to 93M for the U.S.  Global demand continues to grow on a yearly basis.  Urea is very well priced vs other N forms.  All of this leads to solid demand in the near future and the market is well aware.
Bearish Factors
  • European production is resuming – while it is not resuming to 100% capability nor does it make up for lost production time, this is an add supply/reduce demand situation.  Few believed it possible to see production return and had written off European production from their global S&D's.  Now with it returning, assuming it stays online, supplies rise and demand falls.  Econ 101 says prices are under pressure.
  • China returning - like Europe, this isn't a full return to form.  However, with many believing that China would continue to ban all urea exports, any return is welcomed by those looking for lower prices.  If they continue to export, this adds more supply to the global S&D which can weigh on world price ideas.
  • India moved their purchase tender up significantly.  Does this create a demand black hole later in the calendar? - this tender was a surprise in terms of timing, not in terms of size.  Many believed that India would return but thought it would be sometime in December.  Now that they are purchasing today, does this mean that the remainder of 2022 is quiet from the demand side?  If fertilizer demand is quiet long enough, prices tend to struggle to hold.
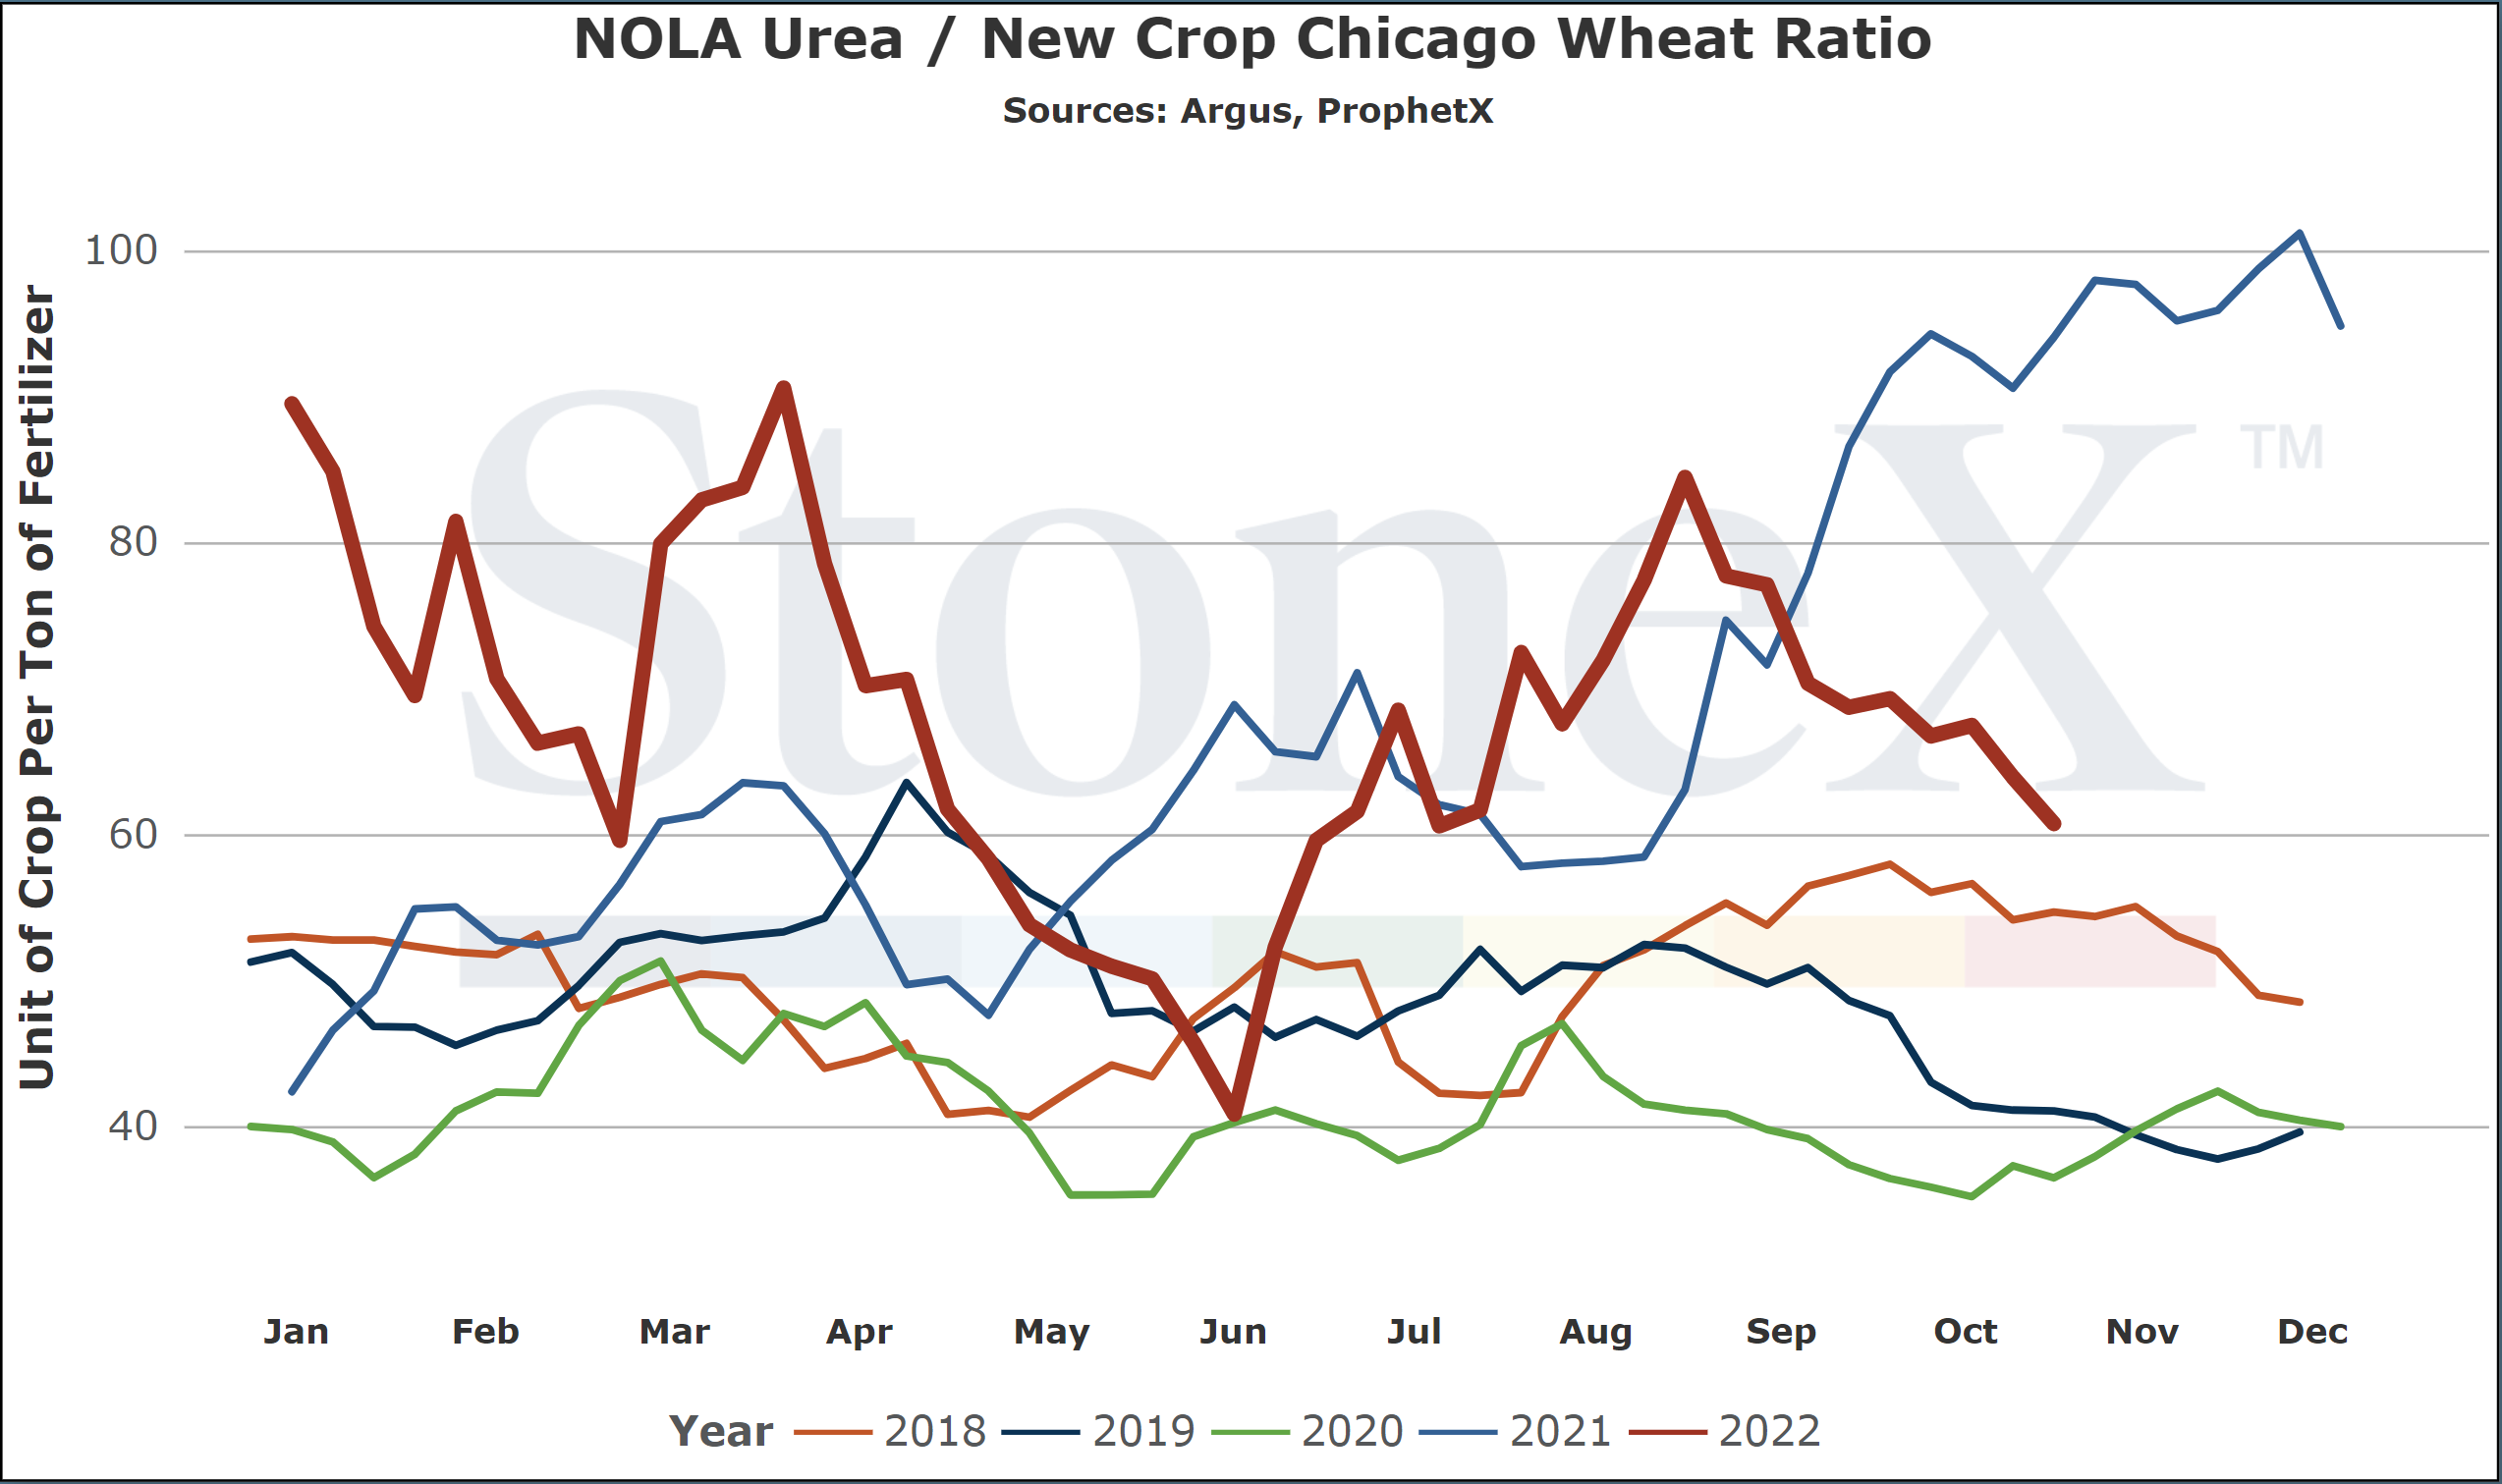
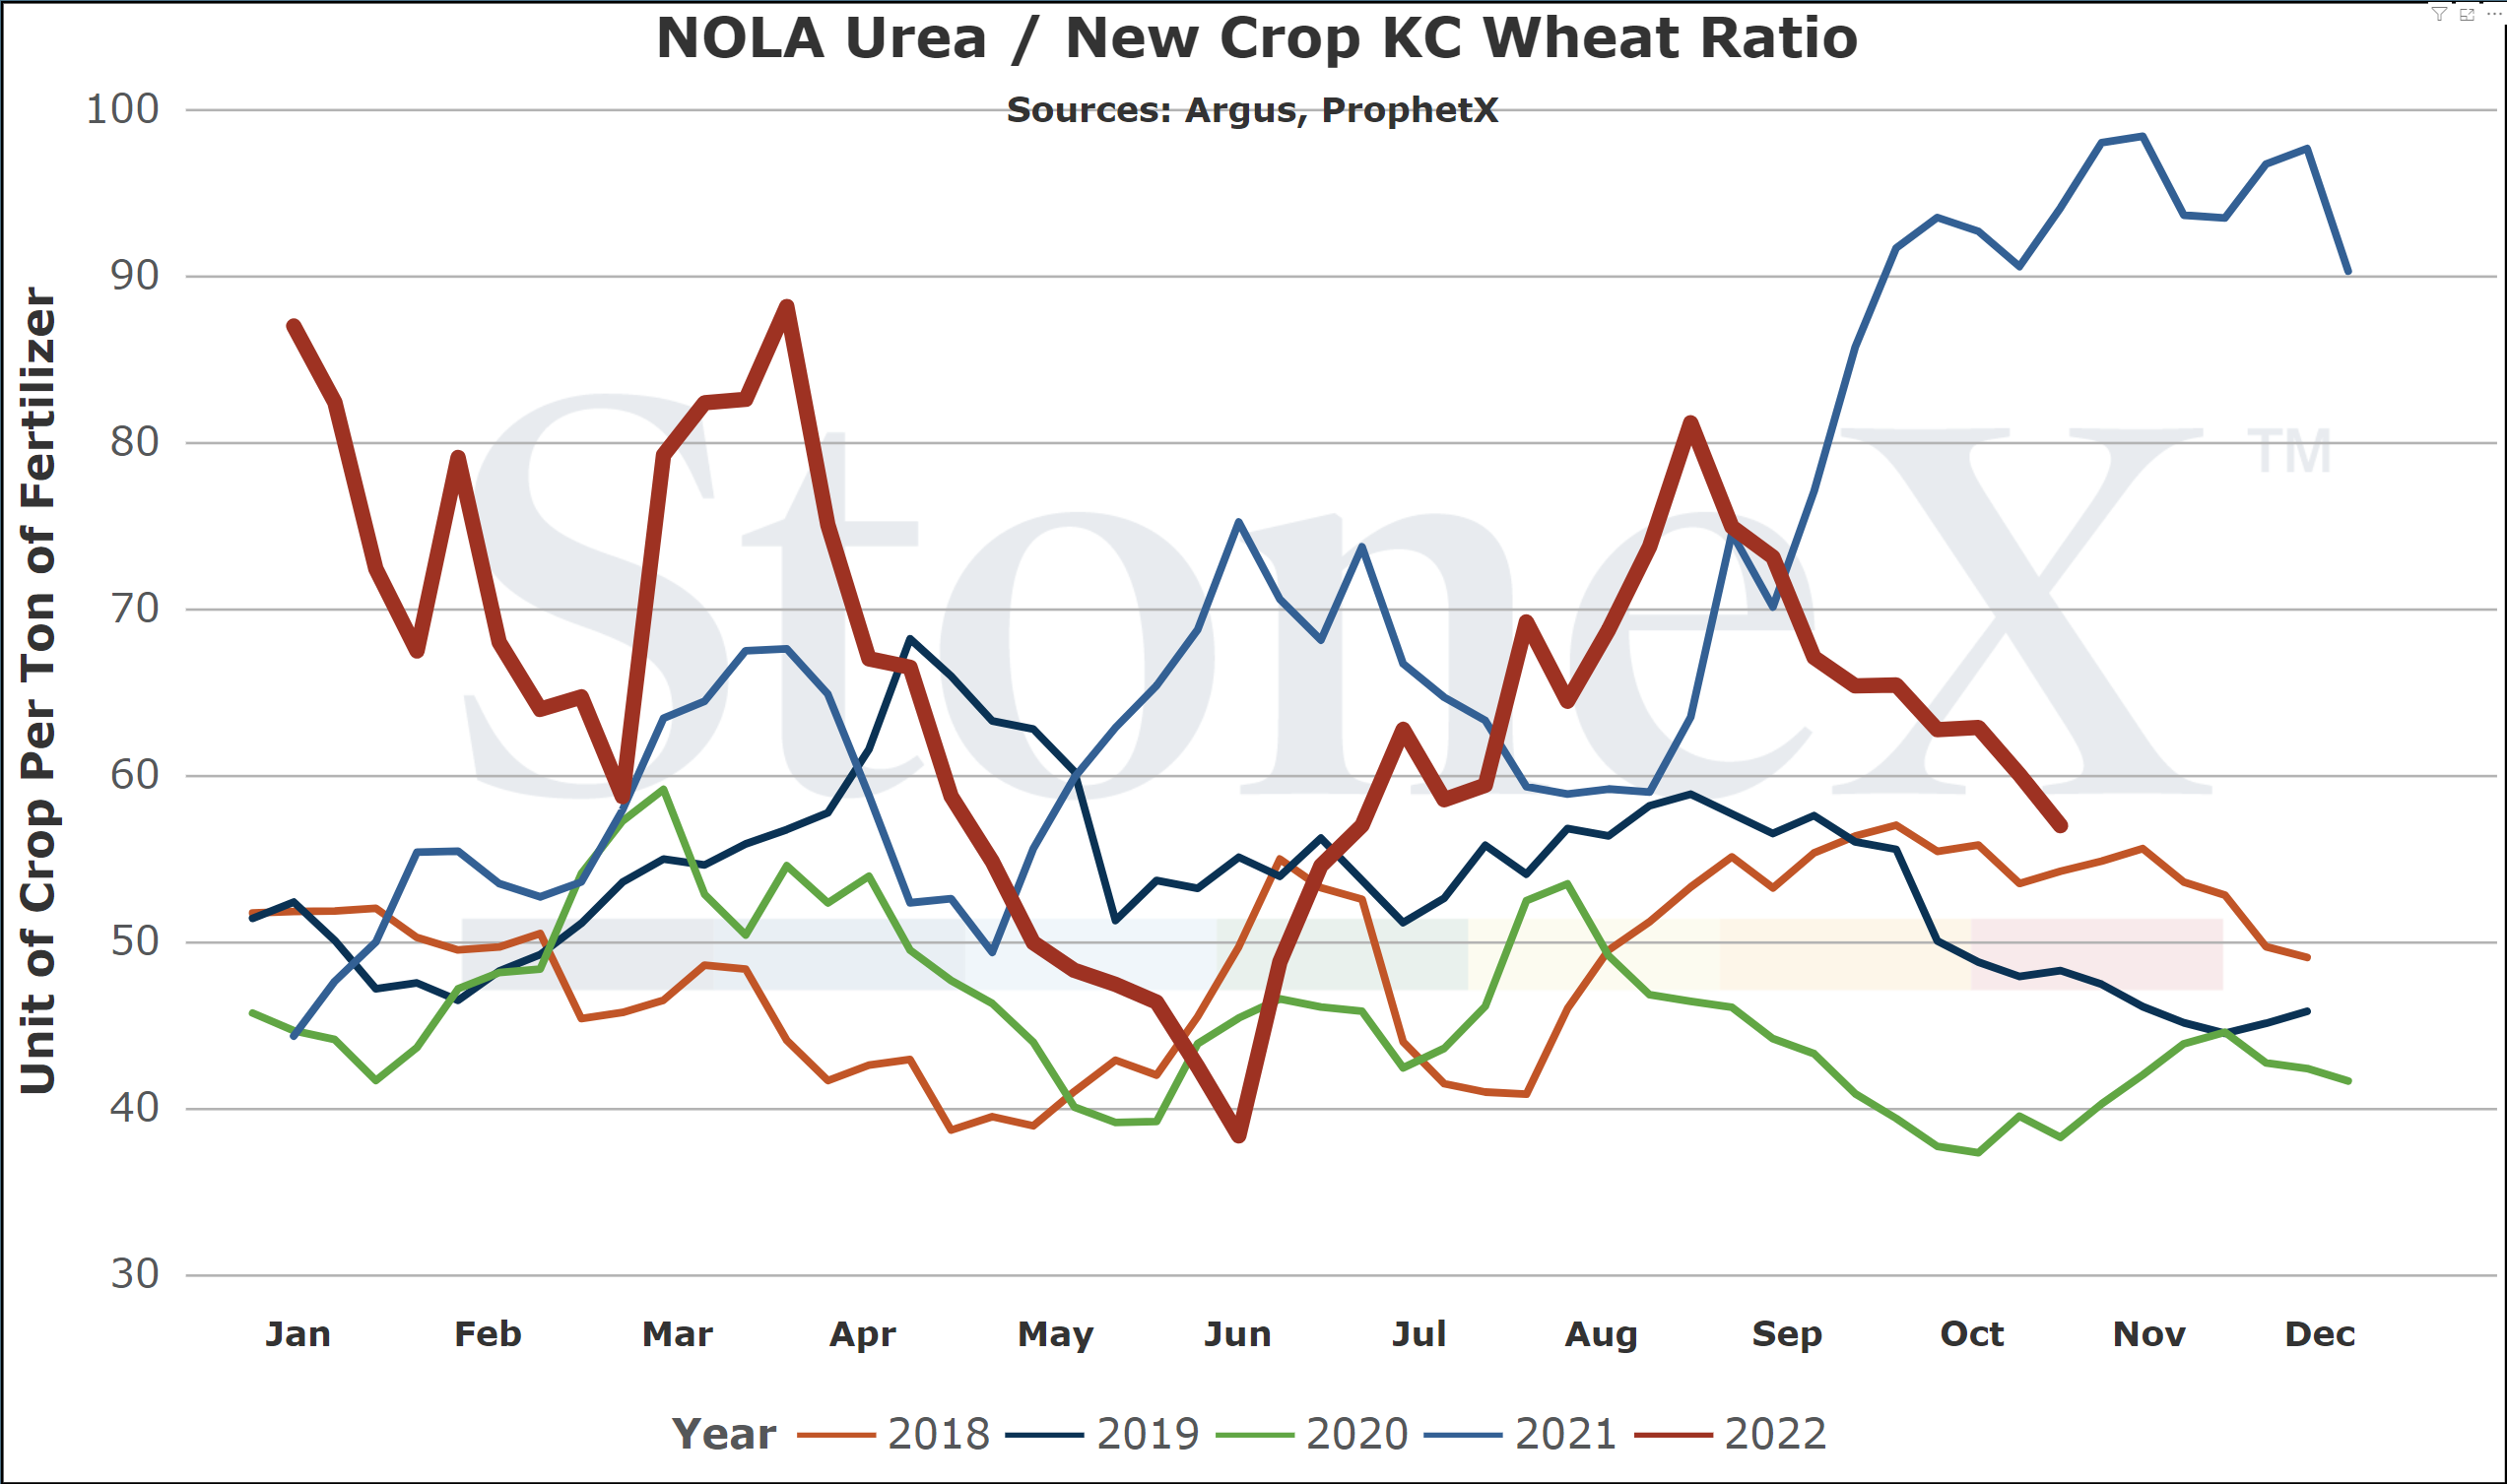
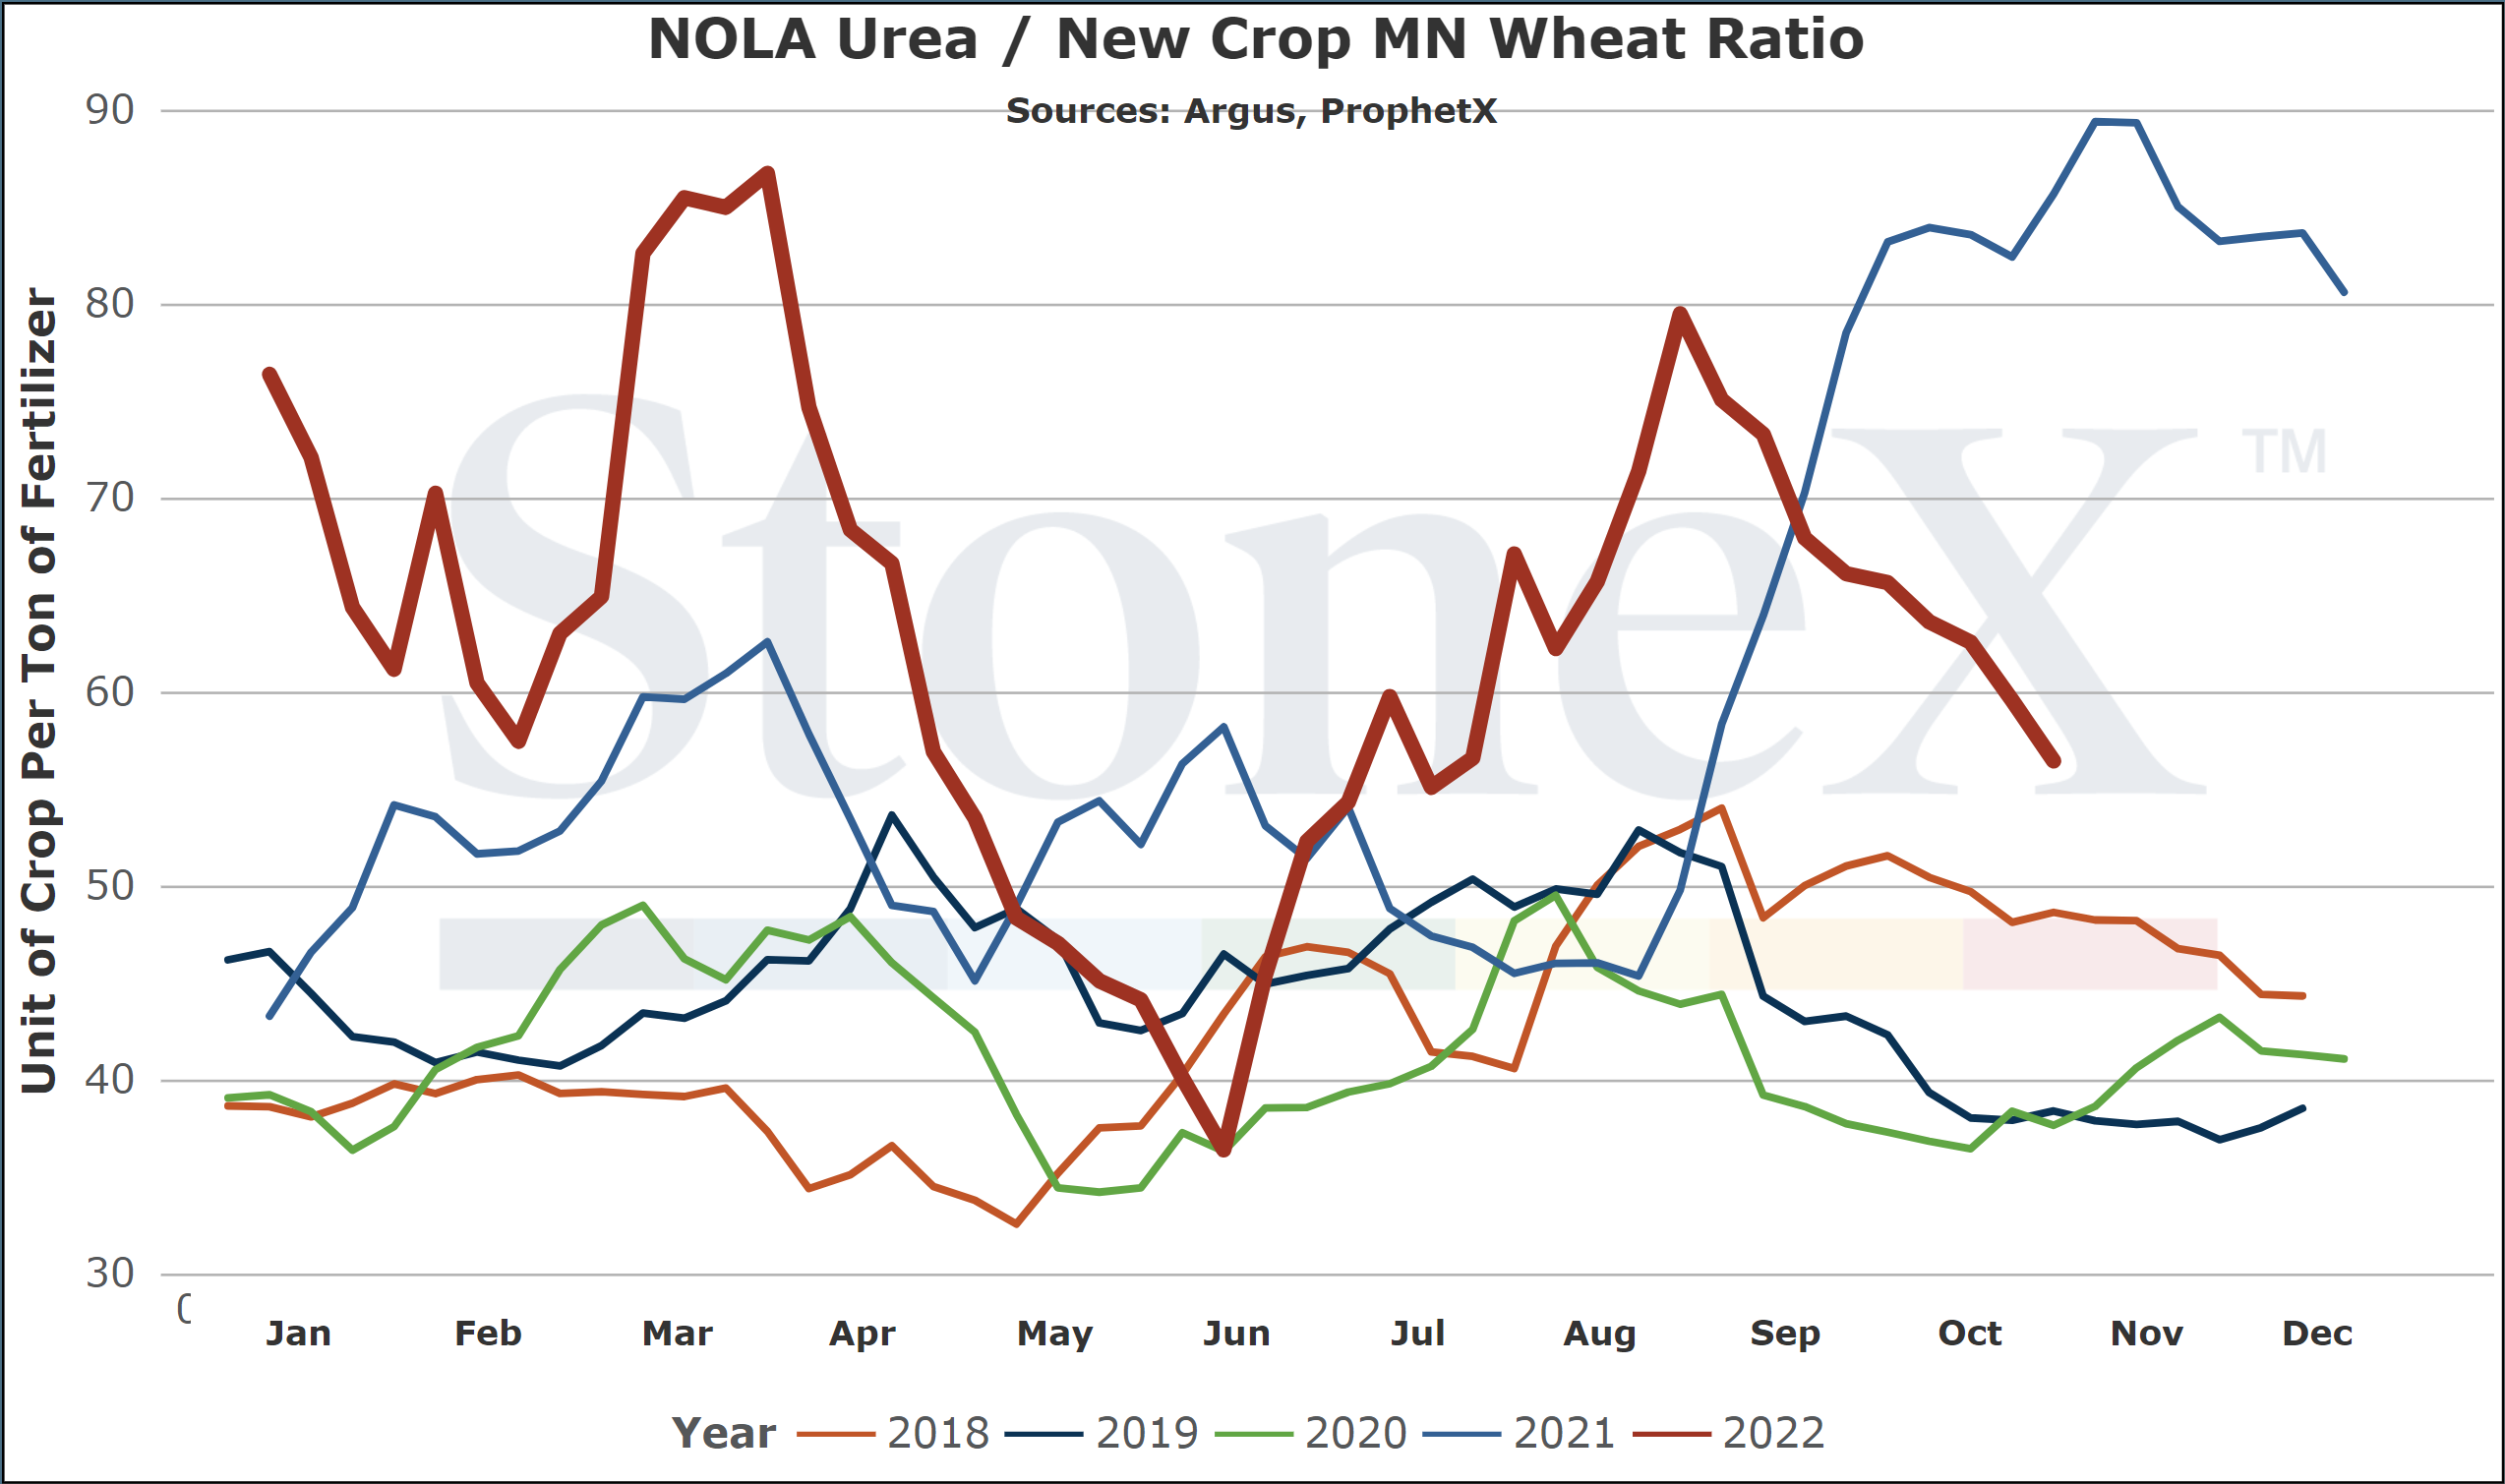
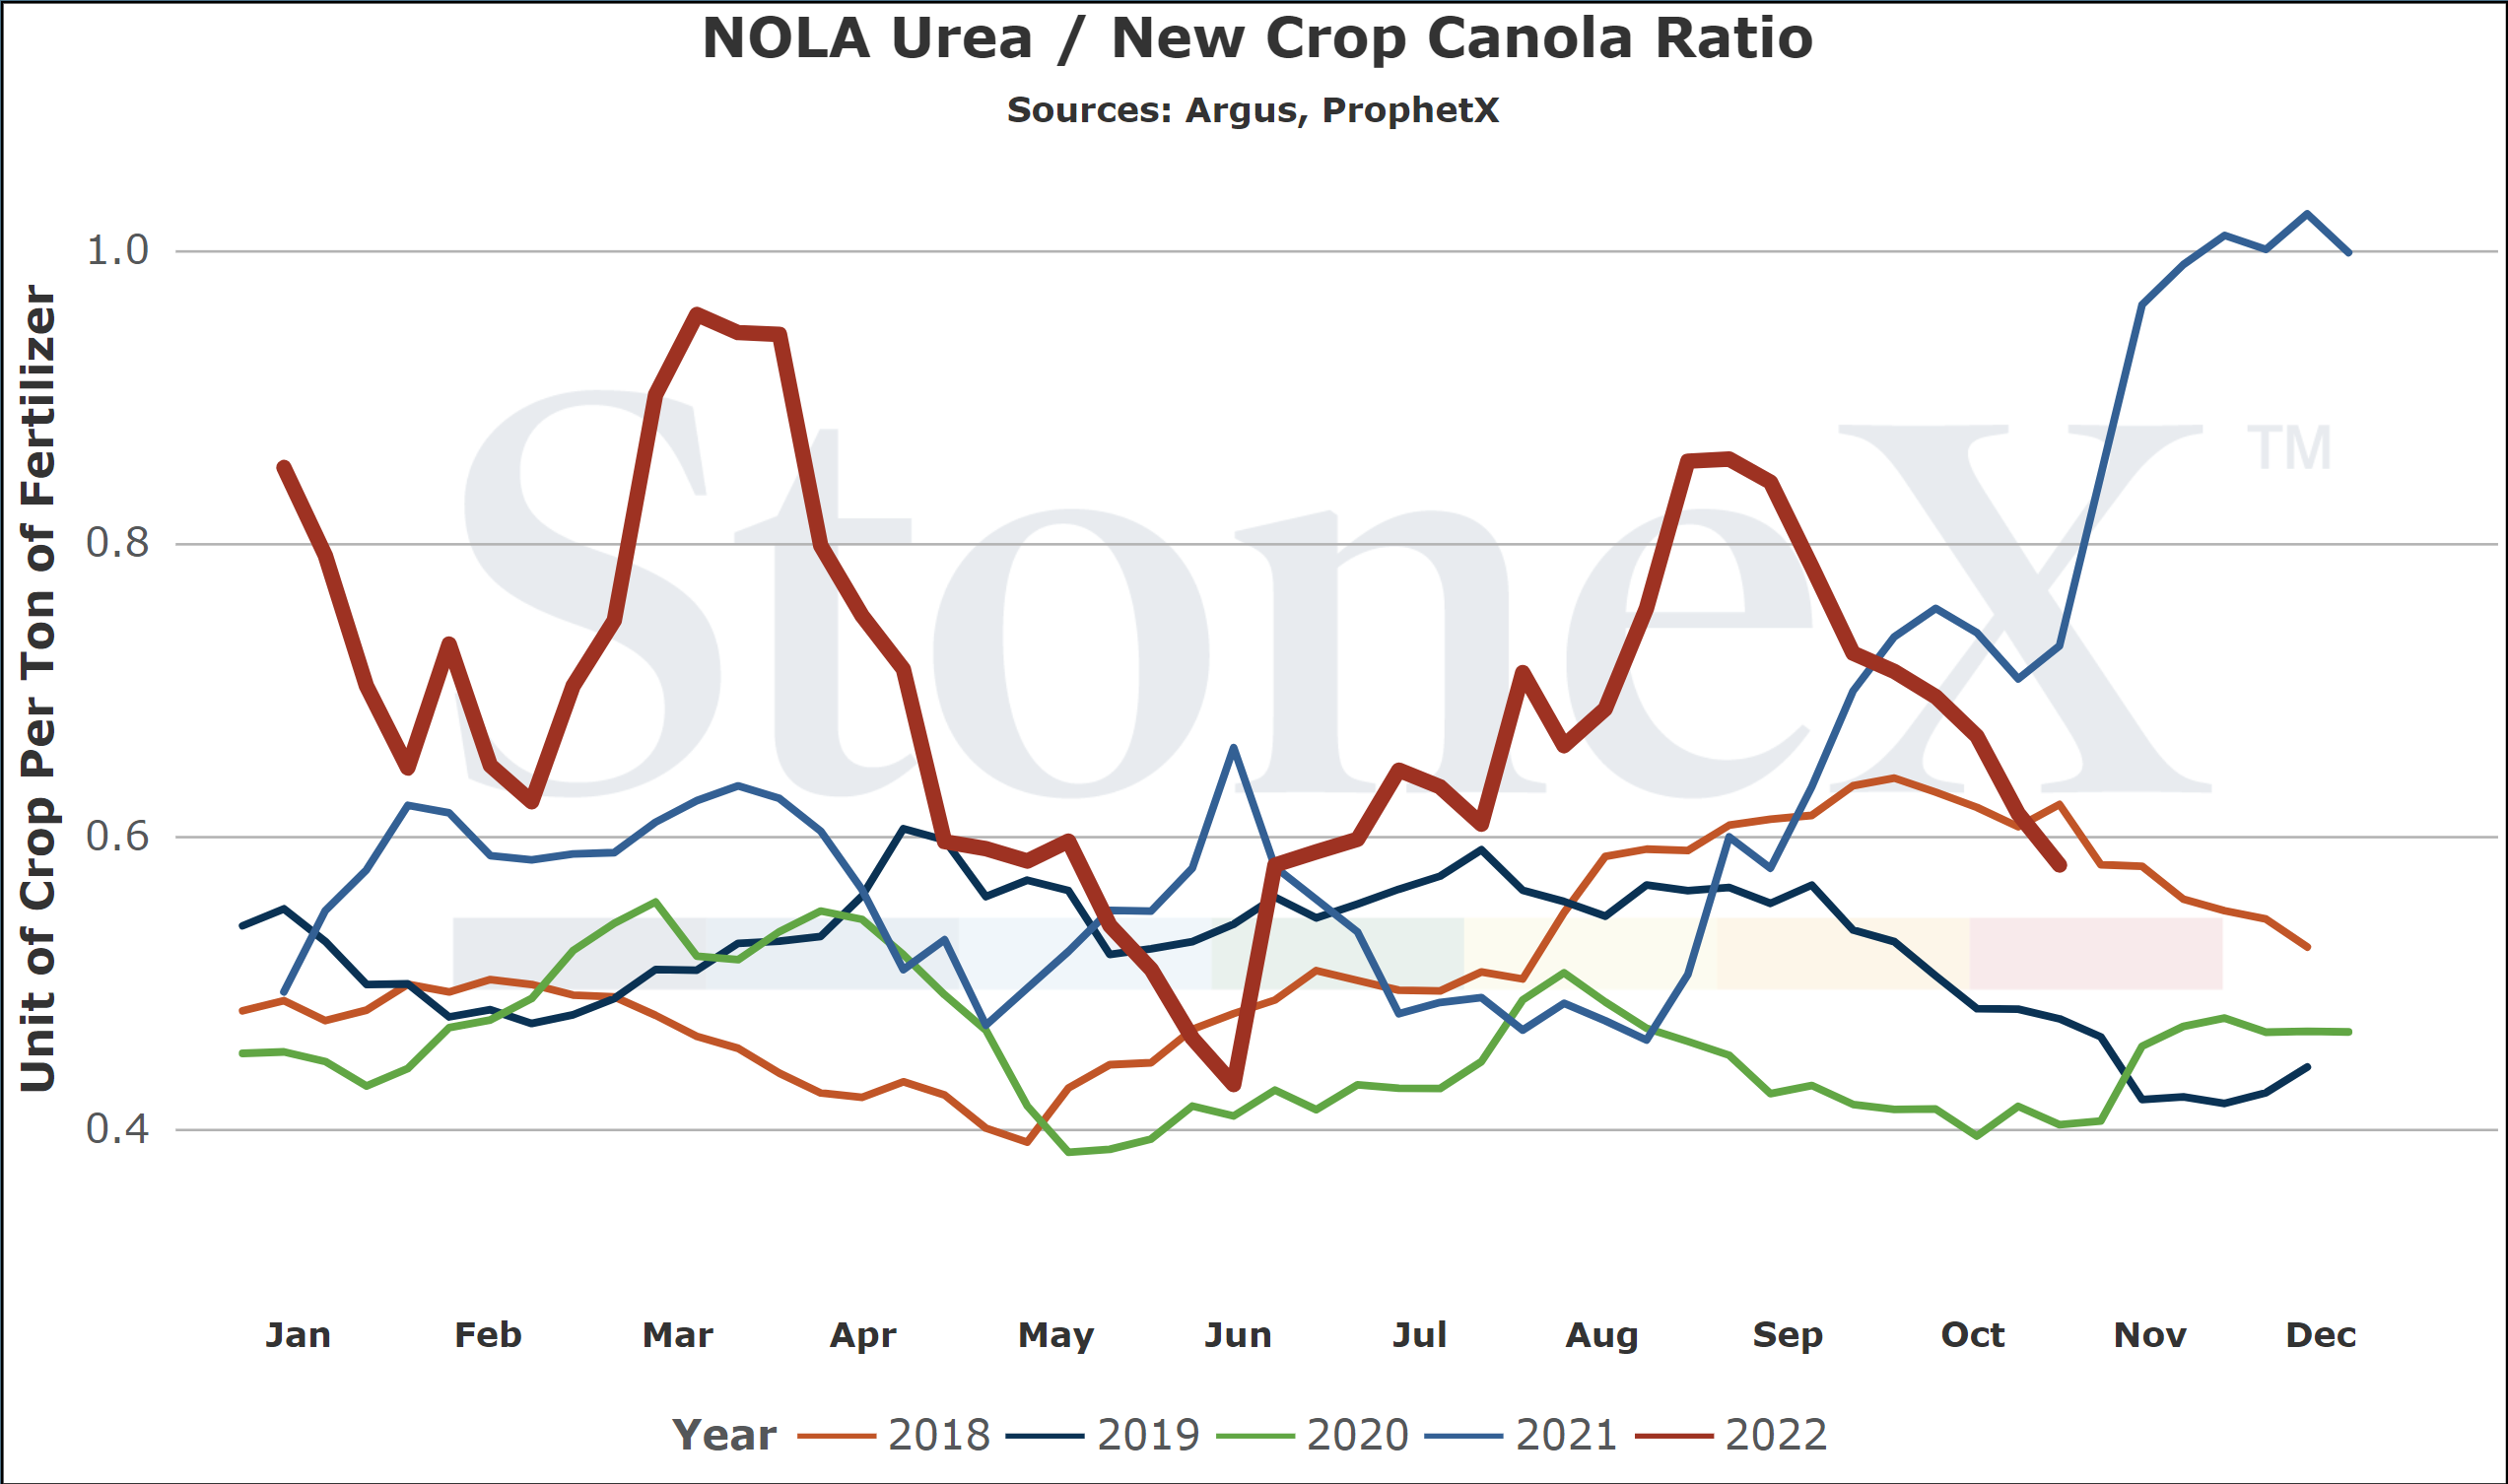
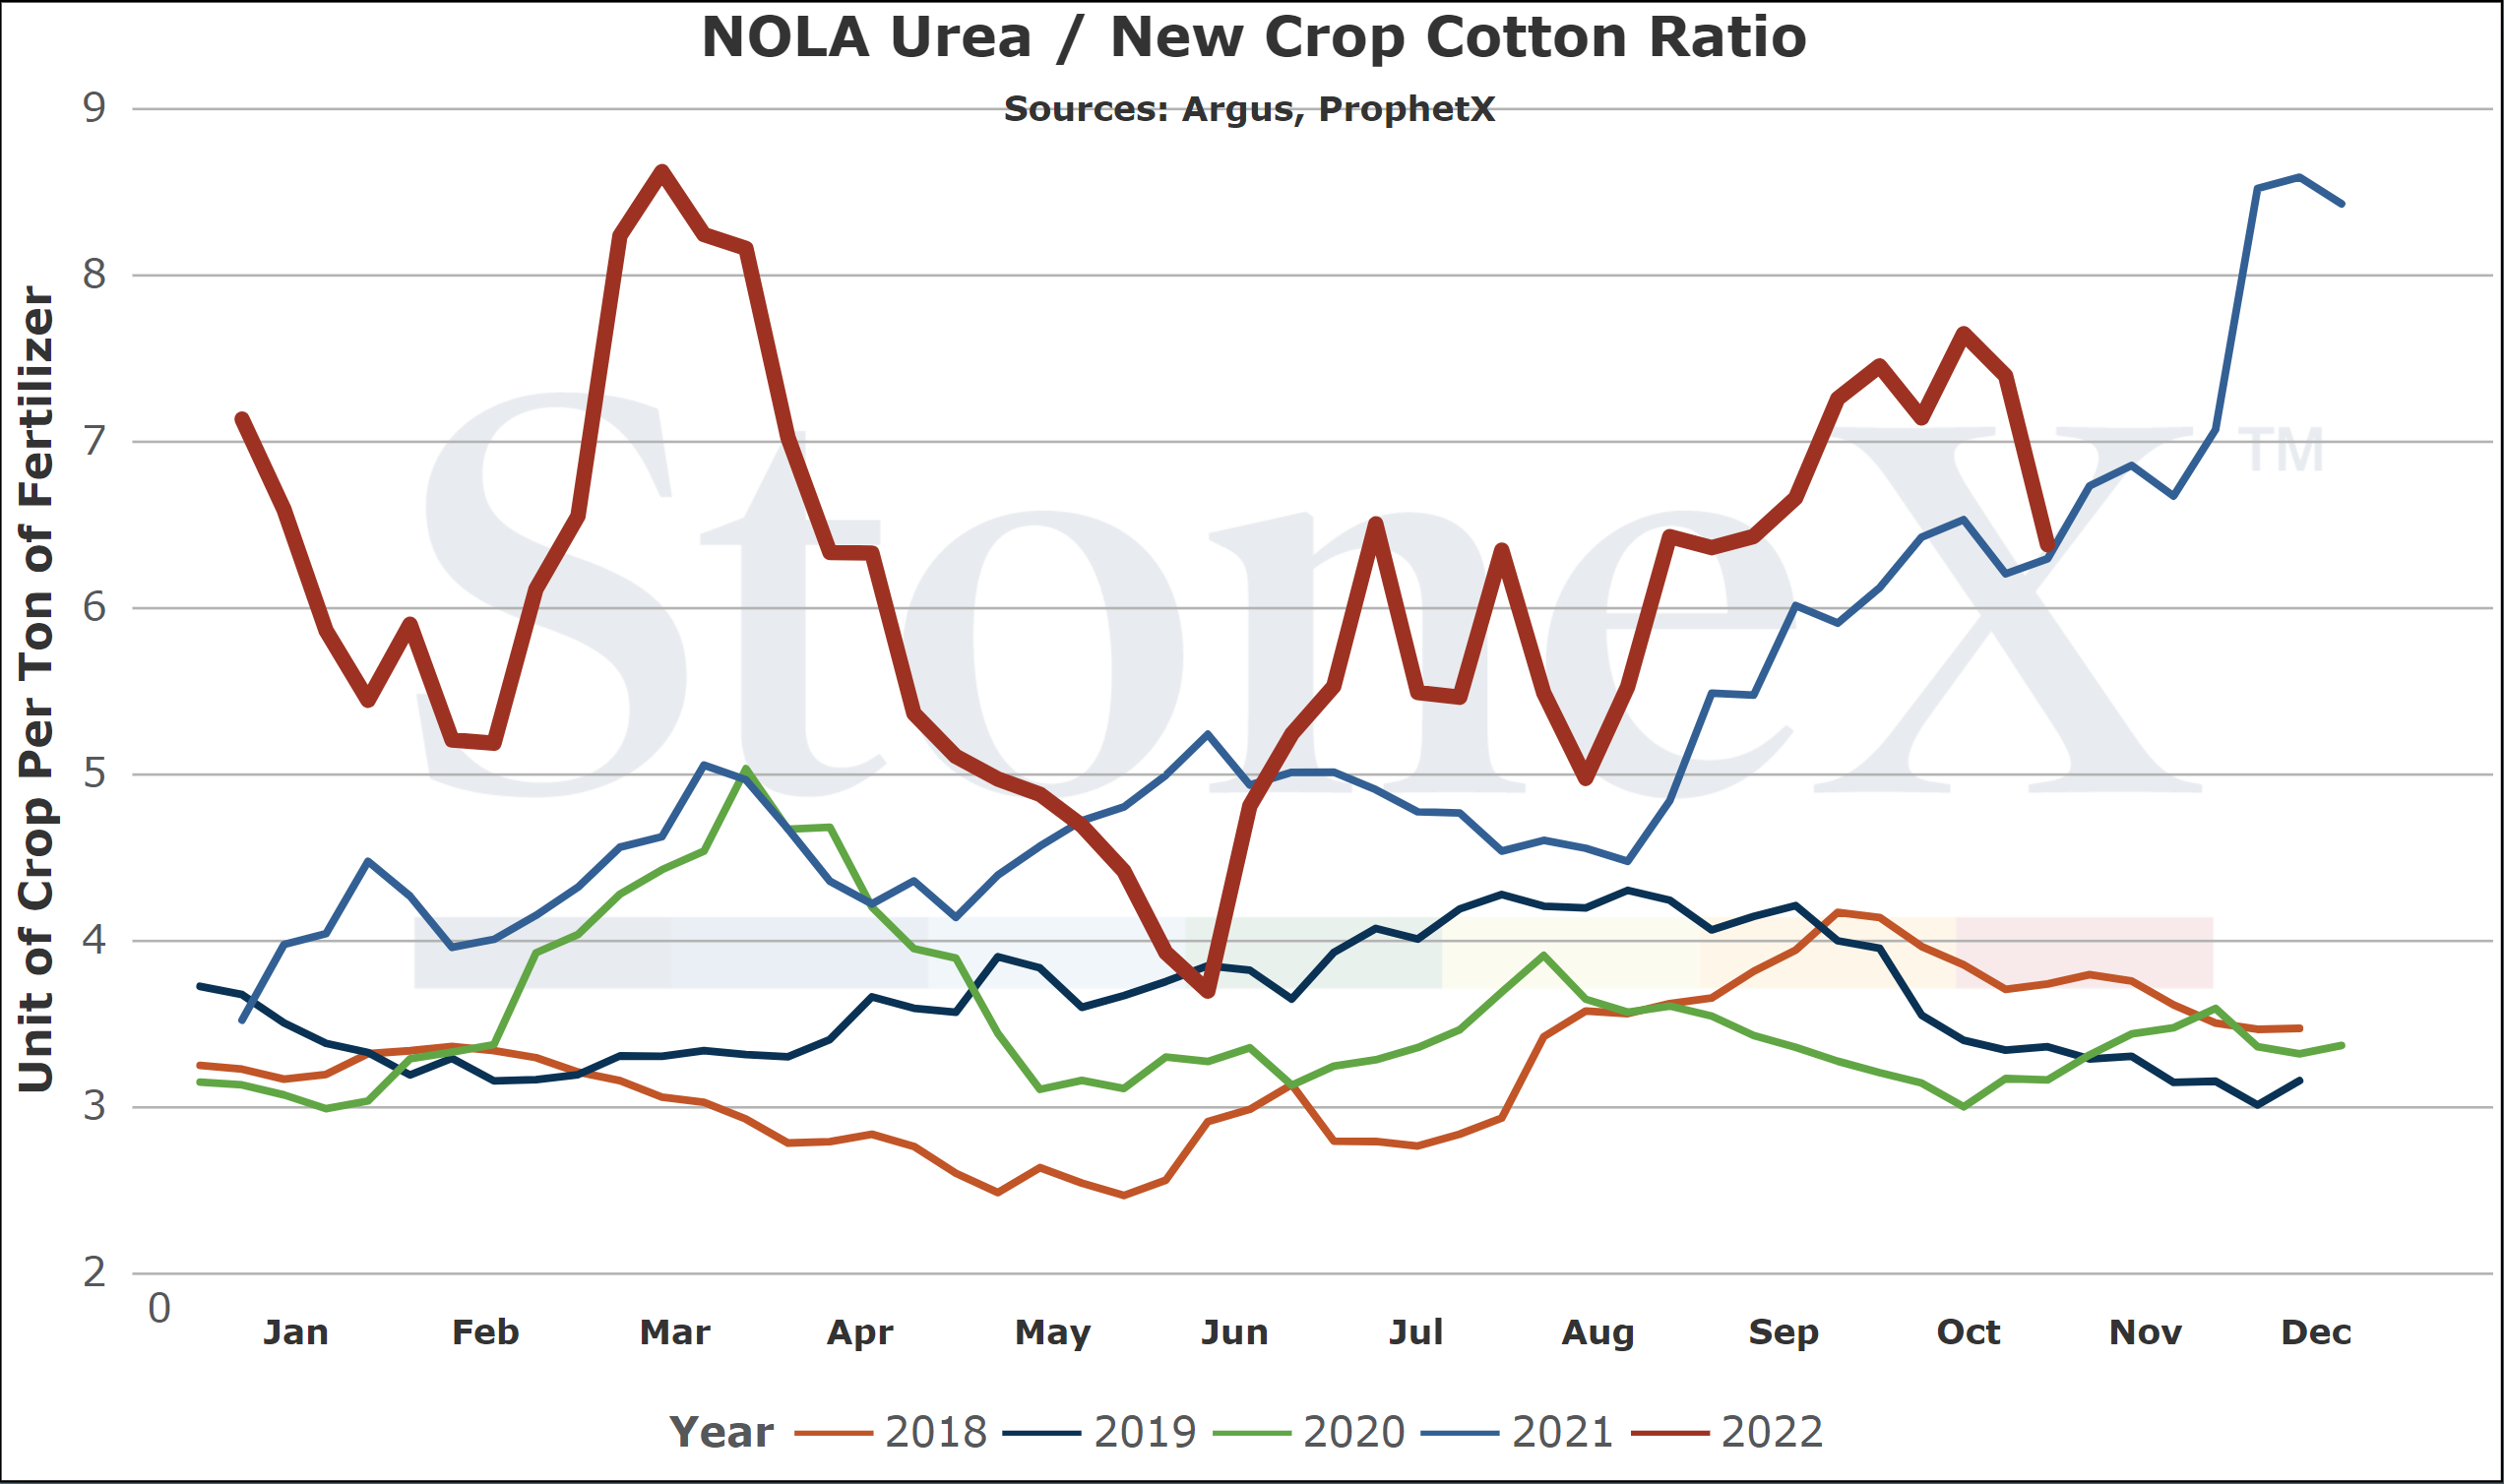
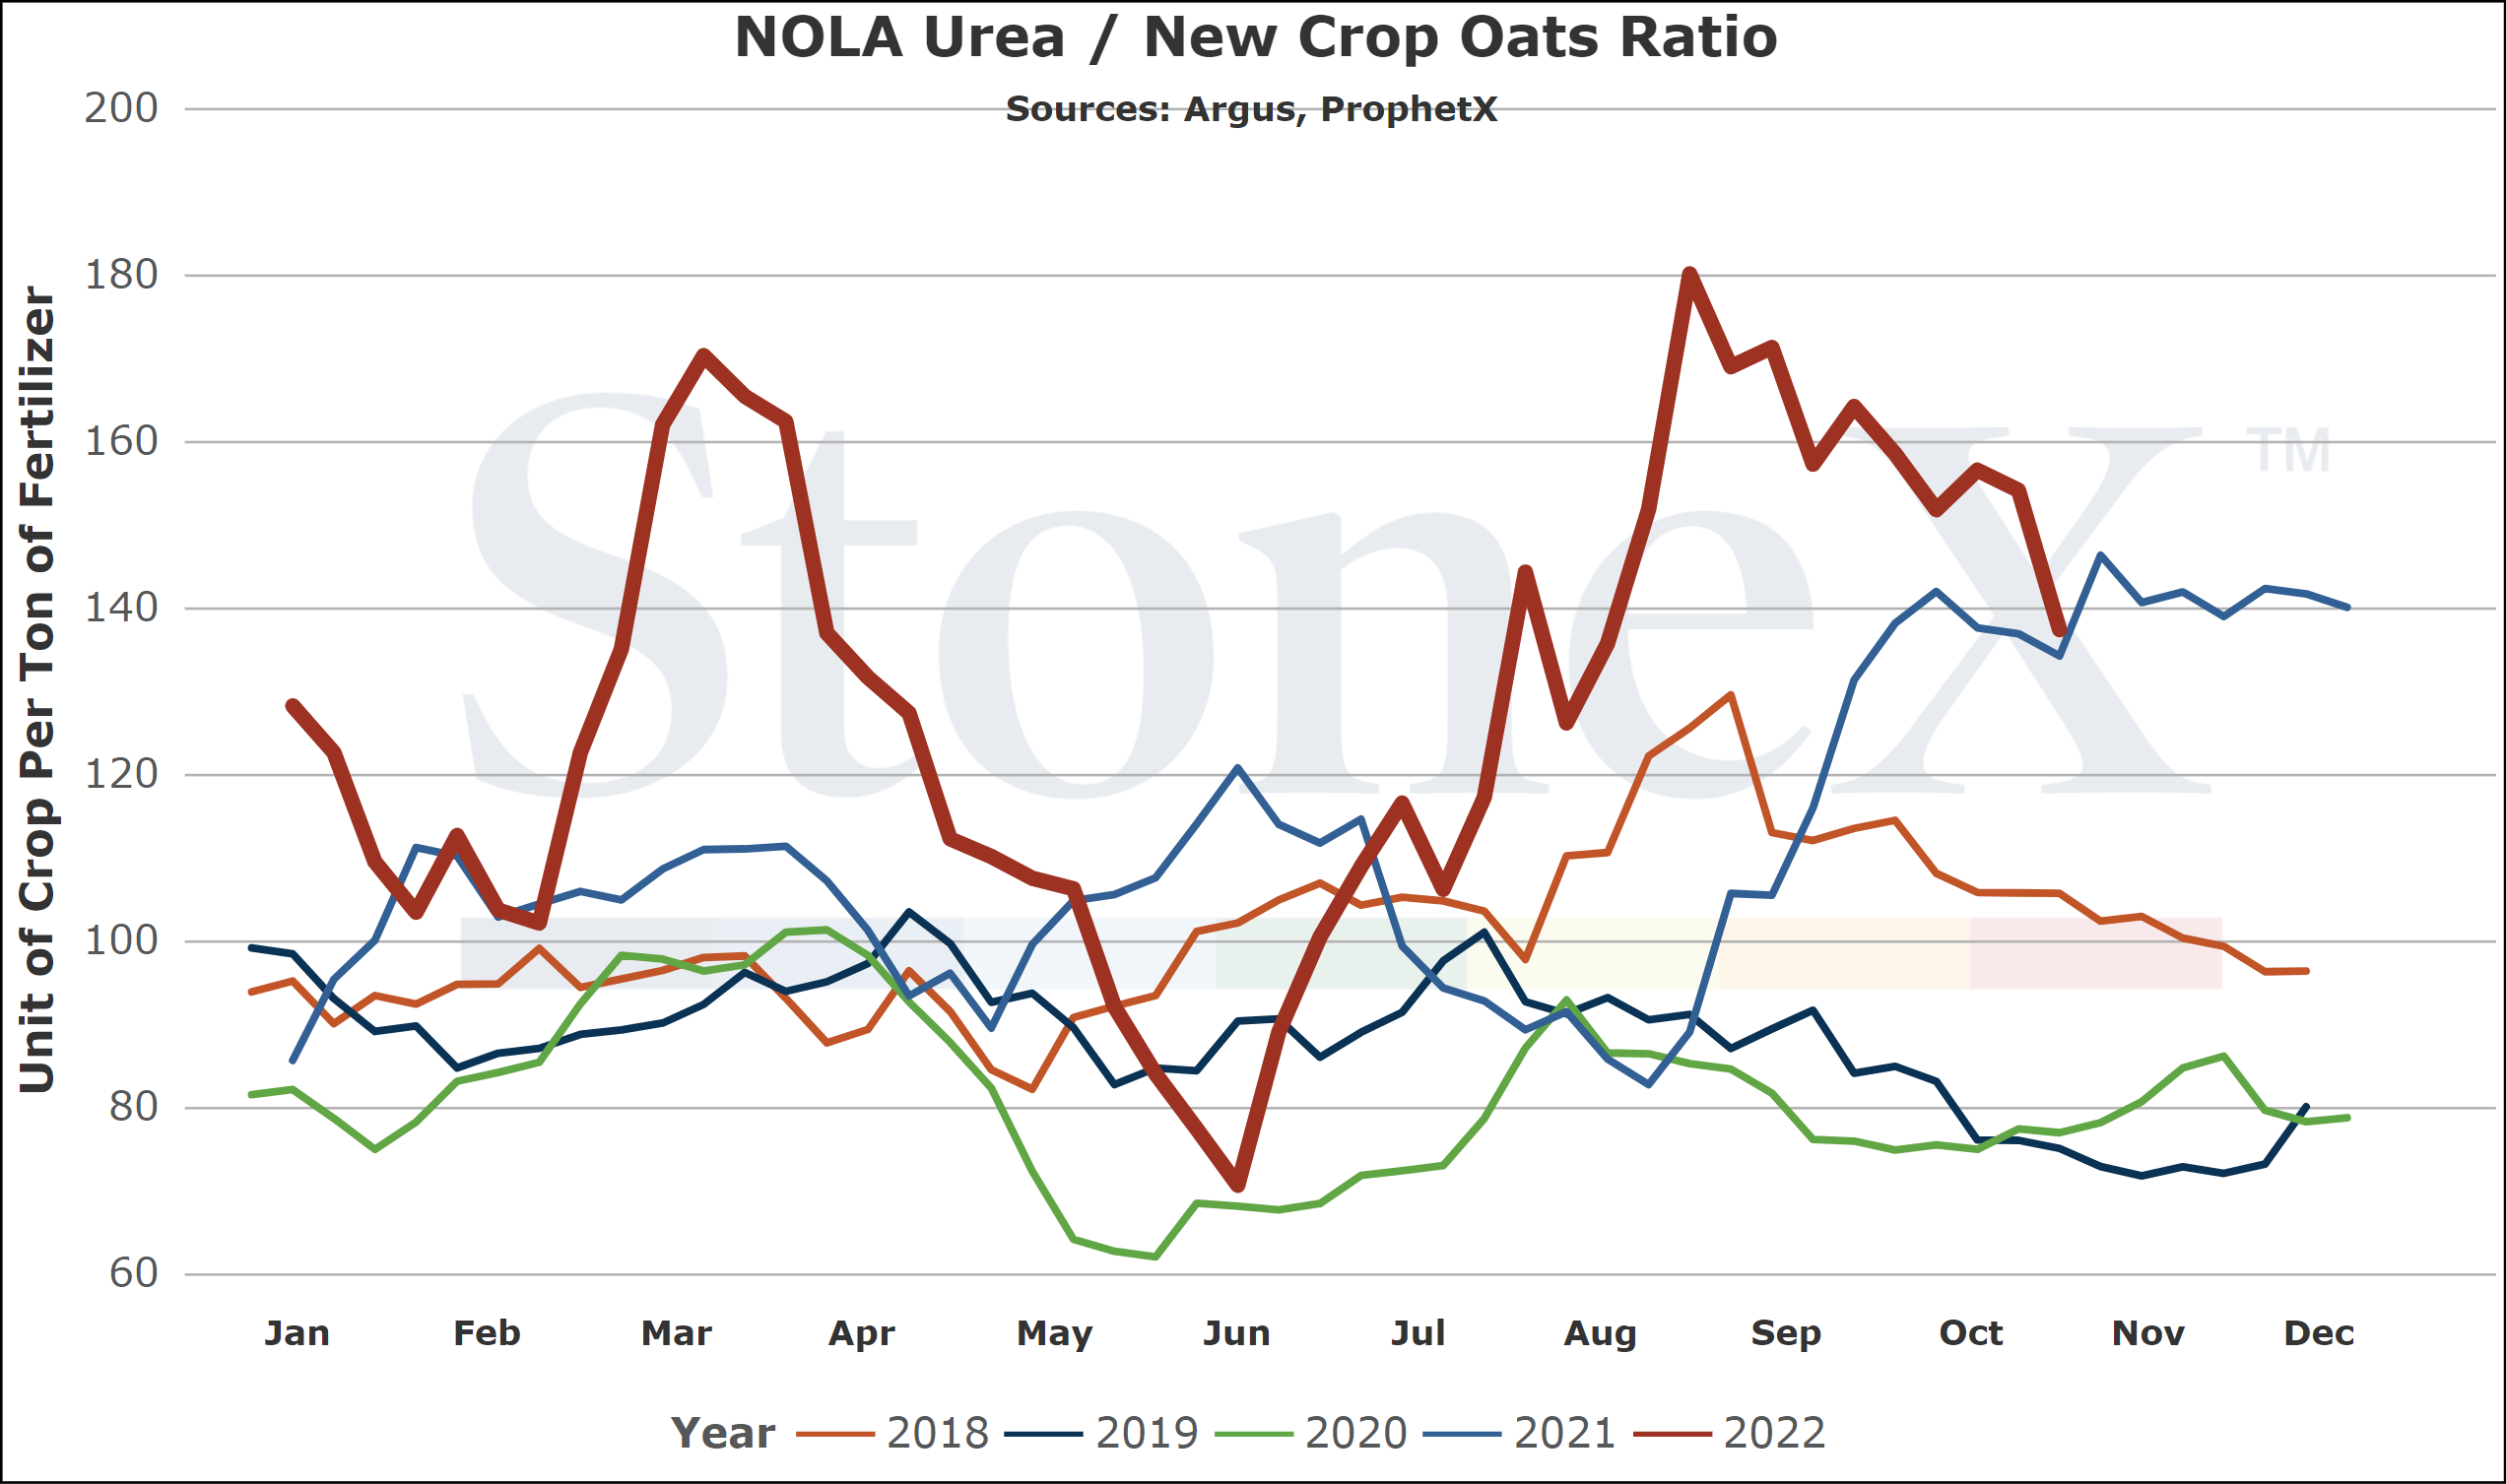
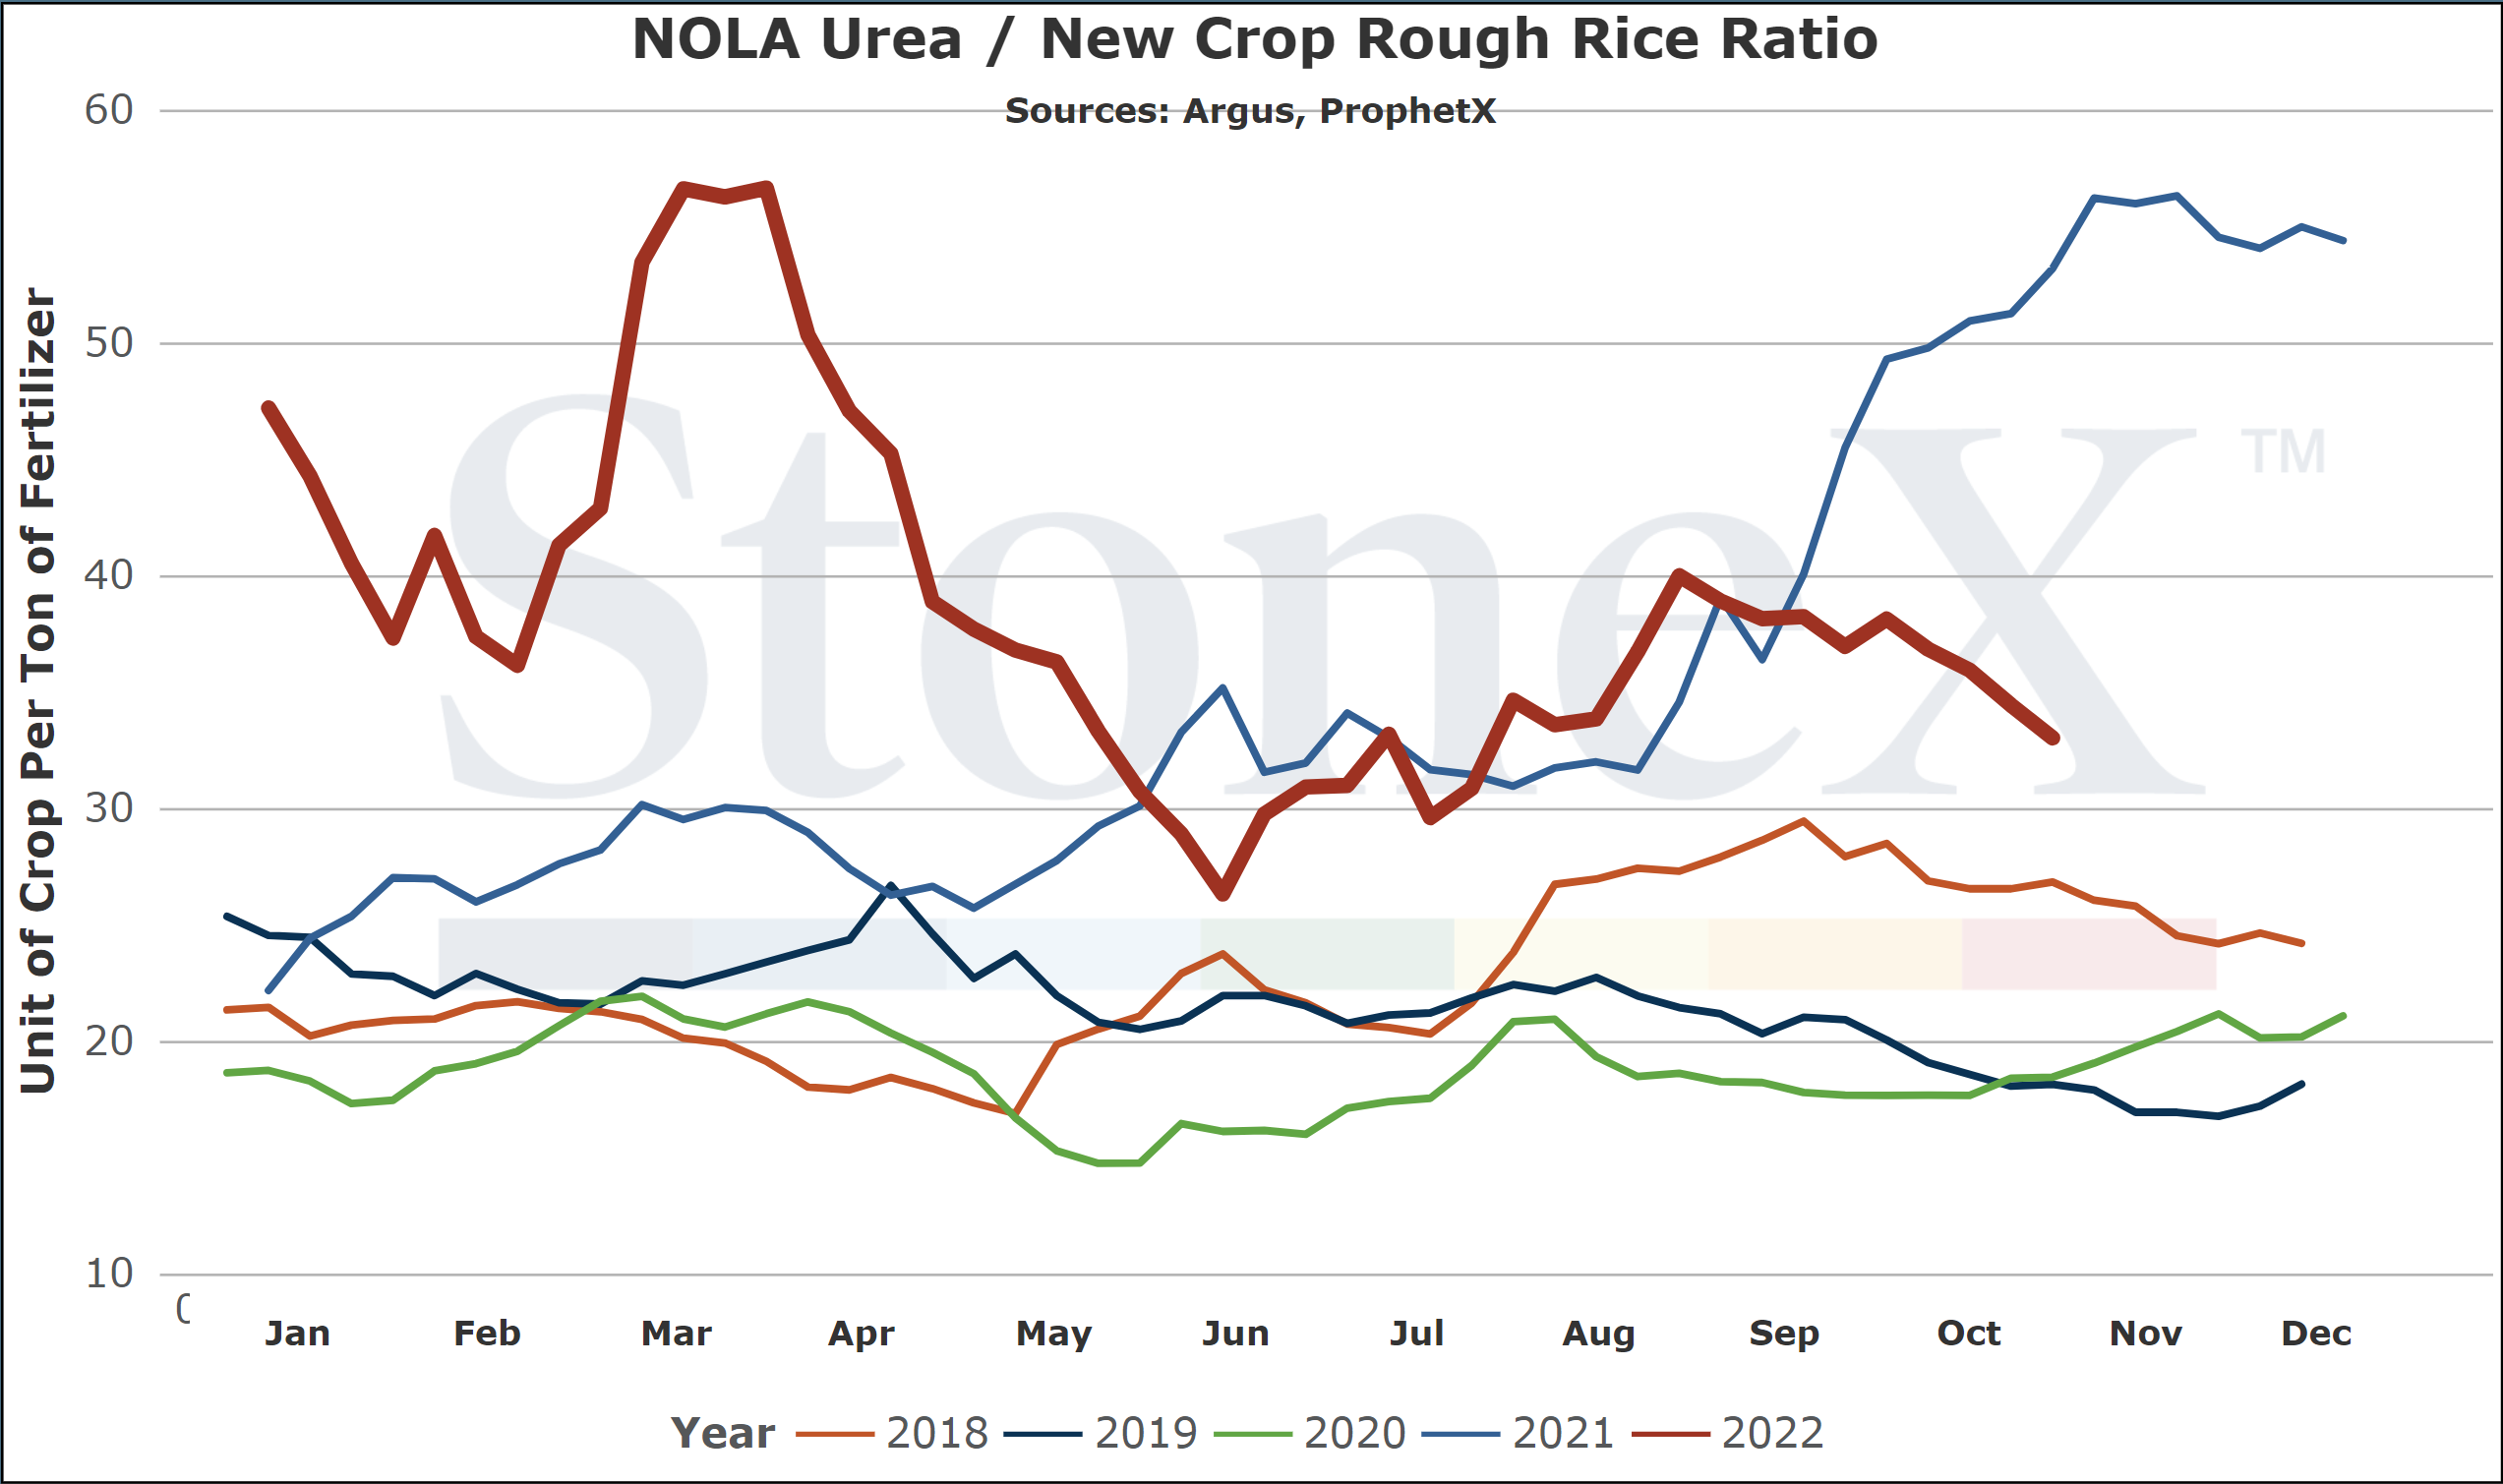
Where are the current urea/grain ratio values today
We believe that only looking at the flat price of either grains or fertilizer can be misleading:
  • Only selling grain can hurt you if fertilizer prices rise substantially
  • Only buying fertilizer can hurt you if grain prices fall
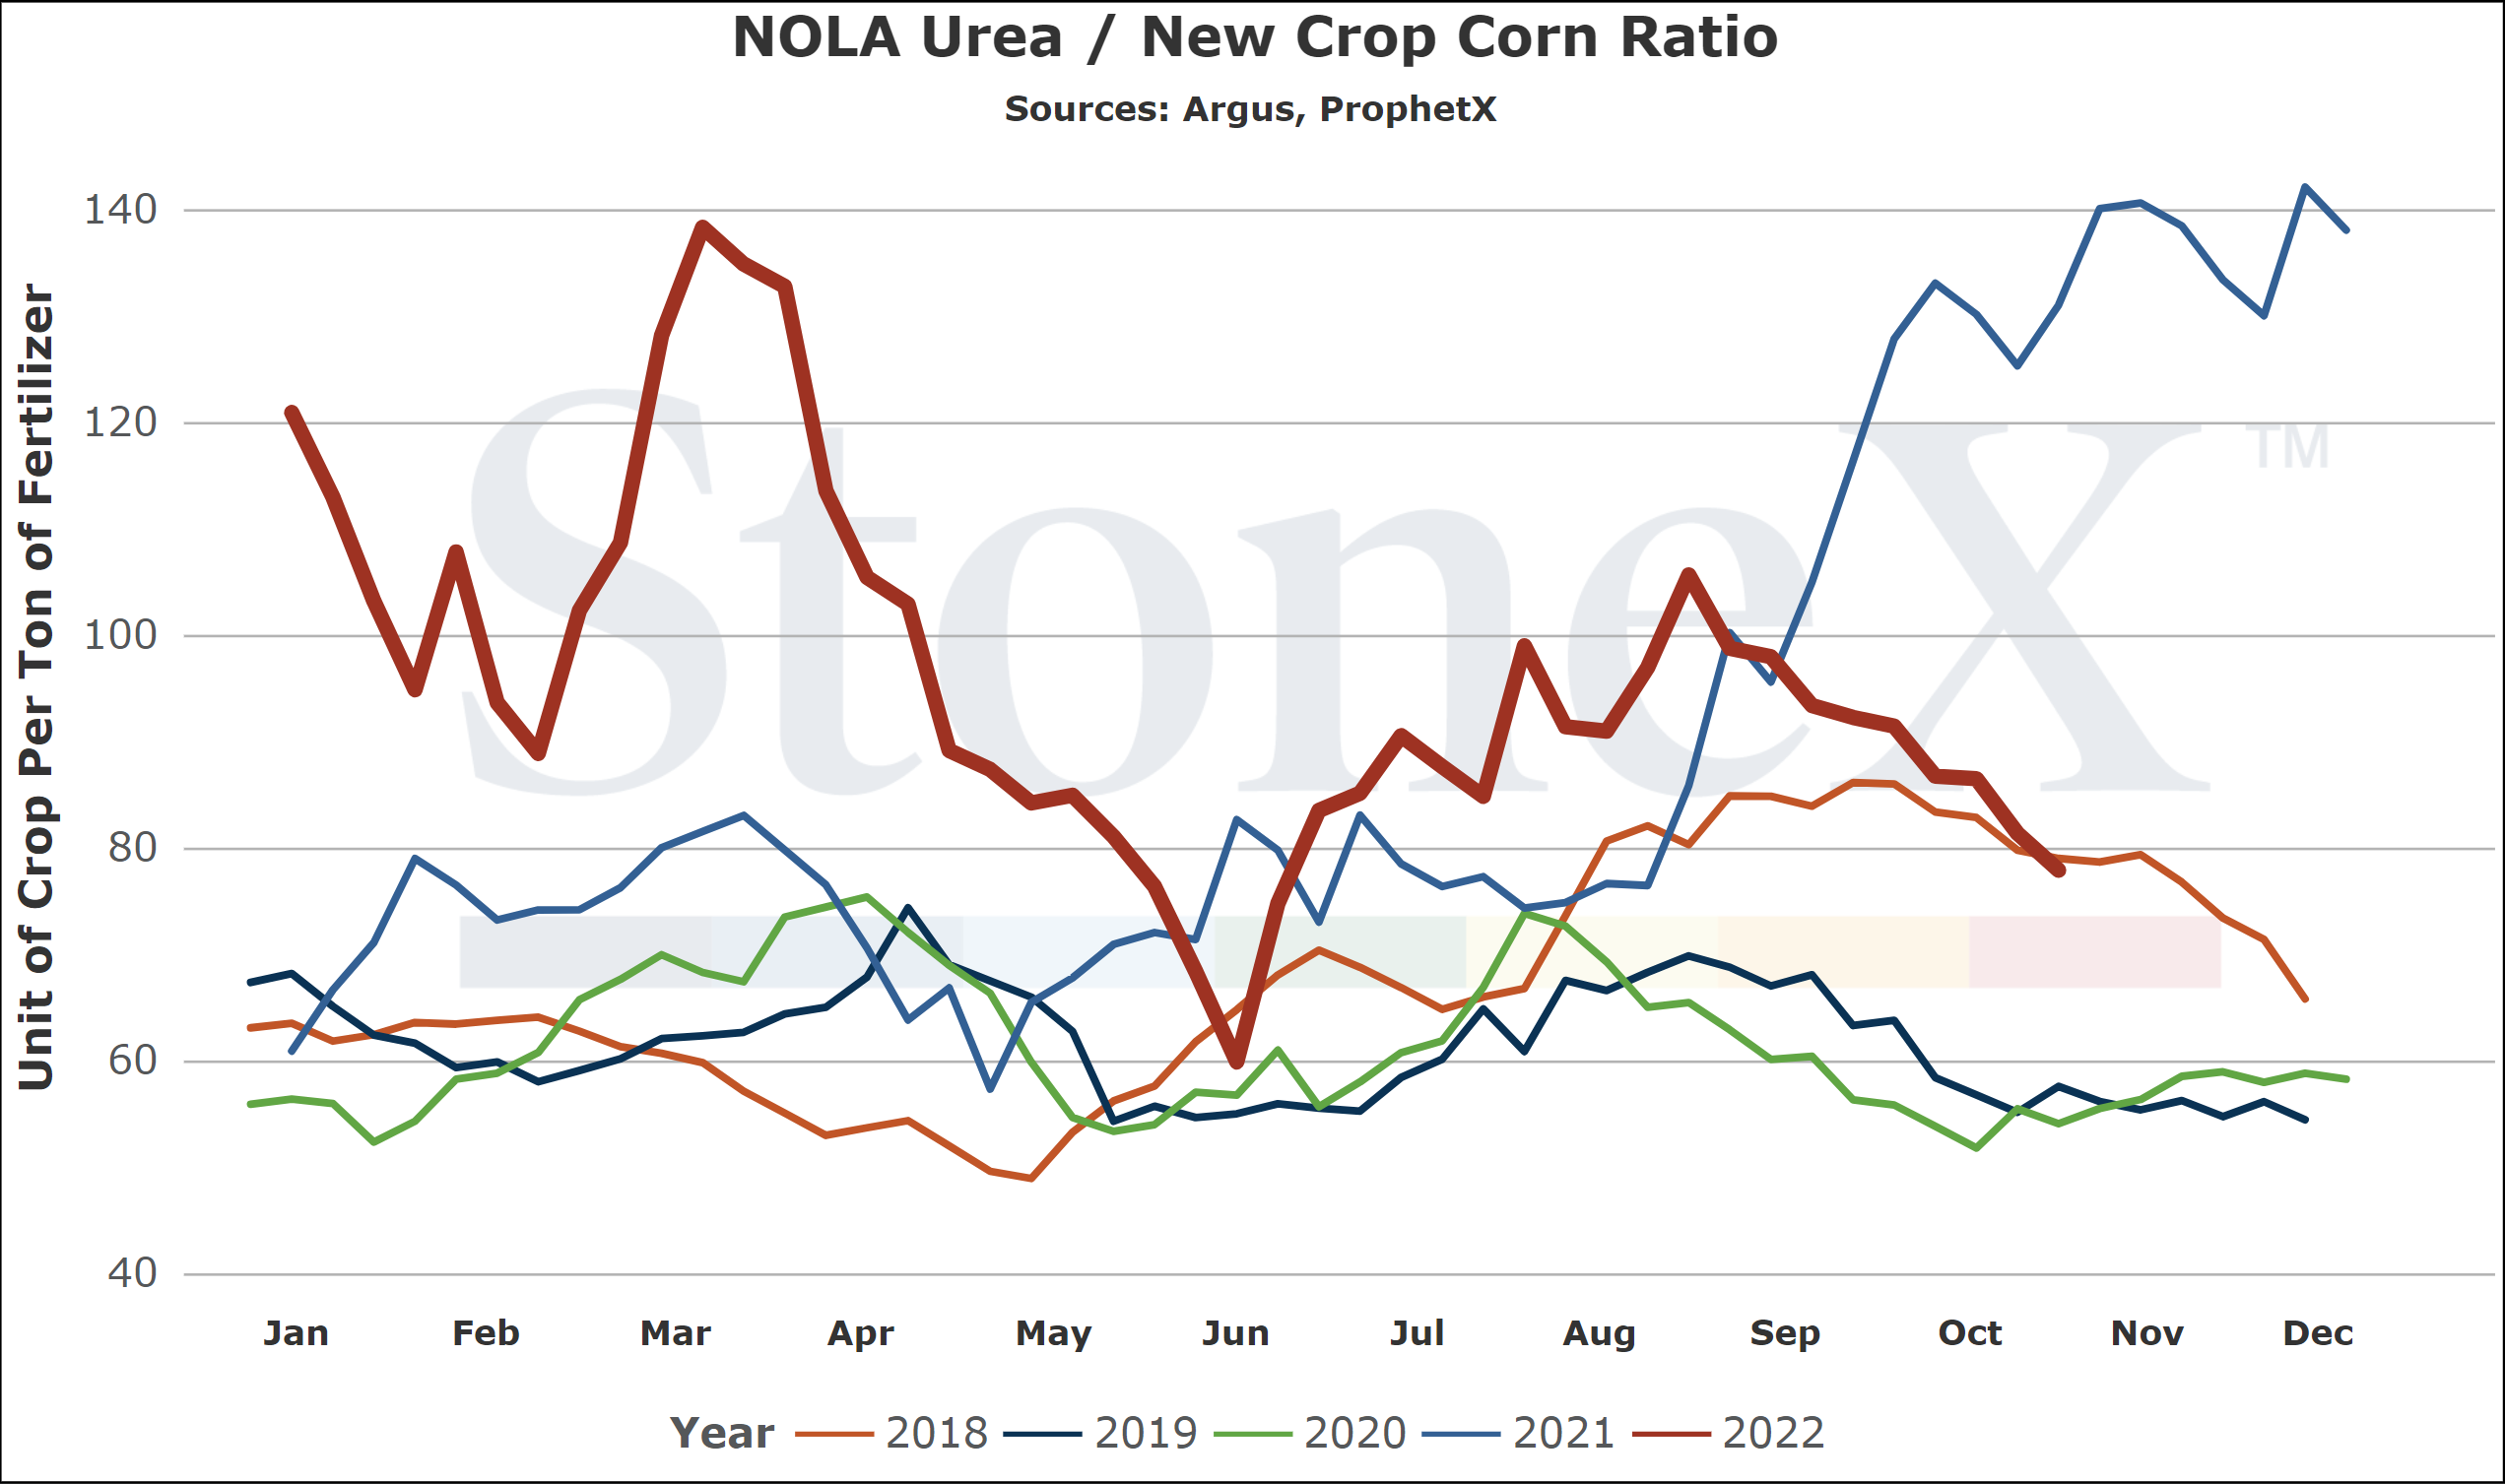
We look at the ratio "value" to get a better indication of where we are or how many bushels of X does it take to pay for 1 ton of fertilizer.
Would you rather:
  • Spend 135 bushels to pay for 1 ton of urea
  • Spend 55 bushels to pay for 1 ton of urea
When we compare the current ratio value against recent years, we start to see if we are high or low.
YOUR VALUES WILL LOOK DIFFERENT
This graph looks at the NOLA urea price vs the flat grain price. There are no logistics on either product. Your location will look different due to fertilizer logistical costs, grain basis, etc.
image 54436
image 54437
image 54438
image 54439
image 54440
image 54441
image 54442
image 54443
Josh Linville’s focal points

I'm changing this going forward simply because I was struggling with what I should put here.  Typically, I fill it with general statements that a lot of times you all do not need.

When I look at markets, I try to find the one/couple points that are most important to me that tell the story.  That is what I will start doing on this section:

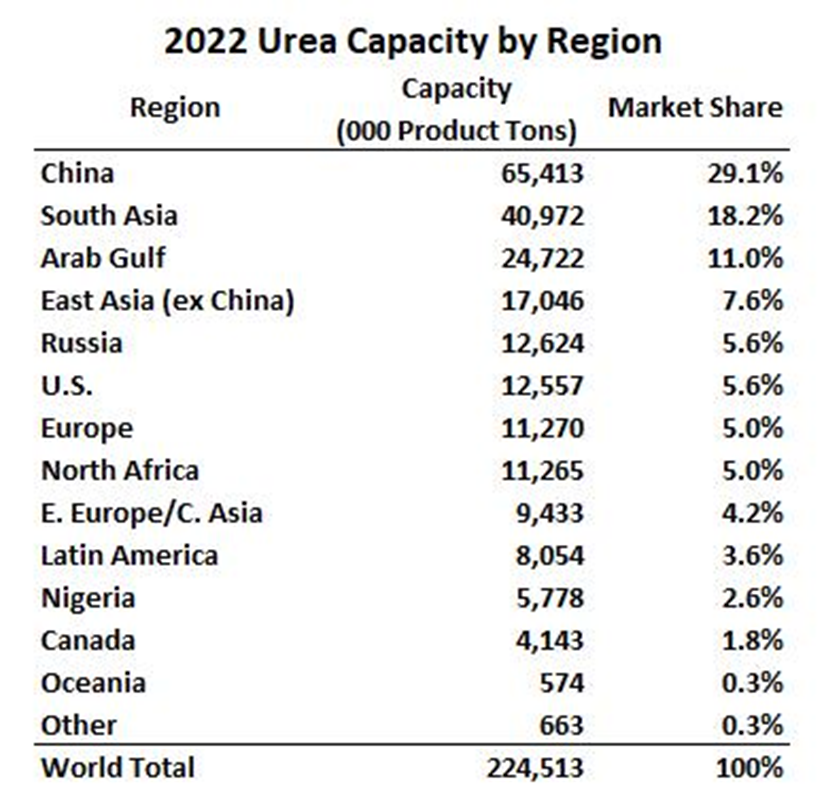
  • European production levels - this is my number one focal point for global urea markets.  Not only does losing Europe mean losing a region that accounts for 5% of global production, it also means that we gain that demand as farmers look to replace the tons.  That math works on the flip side as well.  Not to say that Europe is all or nothing on production, but it has the ability to swing the market very quickly and very violently in my mind.
  • Chinese/Russian export rates - both countries, during normal times, are major exporters to the world.  China has been 10% of global trade last few years.  Russia around 14%.  Russia continues to find homes for its product so its part of the supply chain remains.  China, on the other hand, has been largely restricted.  August was a big export month for them but it seems those flows are being stopped (or so we assume).  As long as both powers continue to restrict flows, the global market will feel it.
  • N price spreads pushing demand to urea - I look at this more from a NOLA perspective but it seems this lives around the world.  Current urea values are very well priced when compared against both UAN and NH3.  If this continues, likely we will see more demand start pushing toward urea.  If a person can save money, why not?  Enough demand shifts, prices will shift as well.

All data was sourced from StoneX unless otherwise noted.

This material should be construed as market commentary, merely observing economic, political and/or market conditions, and not intended to refer to any particular trading strategy, promotional element or quality of service provided by the FCM Division of StoneX Financial Inc. (“SFI”), StoneX Financial (Canada) Inc. (“SFFC”) or StoneX Markets LLC (“SXM”). SFI, SFFC and SXM are not responsible for any redistribution of this material by third parties, or any trading decisions taken by persons not intended to view this material. Information contained herein was obtained from sources believed to be reliable, but is not guaranteed as to its accuracy. Contact designated personnel from SFI, SFFC or SXM for specific trading advice to meet your trading preferences. These materials represent the opinions and viewpoints of the author, and do not necessarily reflect the viewpoints and trading strategies employed by SFI, SFFC or SXM. The FCM Division of StoneX Financial Inc., a subsidiary of StoneX Group Inc., is a member of the National Futures Association (“NFA”) and registered with the U.S. Commodity Futures Trading Commission (“CFTC”) as a futures commission merchant and commodity trading advisor. StoneX Financial (Canada) Inc. is currently registered as a Futures Commission Merchant or equivalent in all provinces of Canada and is a member of the Investment Industry Regulatory Organization of Canada.


  • Fertilizers

This material should be construed as the solicitation of an account, order, and/or services and represents the opinions and viewpoints of the individual authors or presenters. It does not constitute an individualized recommendation or take into account the particular trading objectives, financial situations, or needs of individual customers.


The views are current only through the date stated and are subject to change at any time based upon market or other conditions, and StoneX Group Inc. (“SGI”) disclaims any responsibility to update such views. Actual results, performance, or achievements may differ materially from those expressed or implied. Information is based on data gathered from what we believe are reliable sources. Past performance does not guarantee future results.


The StoneX Group Inc. group of companies provides financial services worldwide through its subsidiaries, including physical commodities, securities, exchange-traded and over-the-counter derivatives, risk management, global payments and foreign exchange products in accordance with applicable law in the jurisdictions where services are provided.


References to certain OTC products or swaps are made on behalf of StoneX Markets, LLC (SXM), a member of the National Futures Association (NFA) and provisionally registered with the U.S. Commodity Futures Trading Commission (CFTC) as a swap dealer. SXM’s products are designed only for individuals or firms who qualify under CFTC rules as an ‘Eligible Contract Participant’ and who have been accepted as customers of SXM.


StoneX Financial Inc. (SFI) is a member of FINRA/NFA/SIPC and registered with the MSRB. SFI is registered with the U.S. Securities and Exchange Commission (SEC) as a Broker-Dealer and with the CFTC as a Futures Commission Merchant and Commodity Trading Advisor. StoneX Financial (Canada) Inc. (SFCI) is registered in Canada and is a member of CIRO and CIPF. References to certain securities trading are made on behalf of the BD Division of SFI and are intended only for an audience of institutional clients as defined by FINRA Rule 4512(c). References to certain exchange-traded futures and options are made on behalf of the FCM Division of SFI. Wealth Management is offered through SA Stone Wealth Management Inc., member FINRA/SIPC, and SA Stone Investment Advisors Inc., an SEC-registered investment advisor, both wholly owned subsidiaries of SGI.

R.J. O’Brien & Associates, LLC (RJO) is registered with the CFTC as a Futures Commission Merchant and is a member of NFA.


StoneX Financial Ltd (SFL) is registered in England and Wales, company no. 5616586. SFL is authorized and regulated by the Financial Conduct Authority (FCA) (registration number FRN:446717) to provide services to professional and eligible customers including: arrangement, execution and, where required, clearing derivative transactions in exchange traded futures and options. SFL is also authorized to engage in the arrangement and execution of transactions in certain OTC products, certain securities trading, precious metals trading and payment services to eligible customers. SFL is authorized and regulated by the FCA under the Payment Services Regulations 2017 for the provision of payment services. SFL is a category 1 ring-dealing member of the London Metal Exchange. In addition SFL also engages in other physically delivered commodities business and other general business activities which are unregulated and not required to be authorized by the FCA.


This communication is issued in the European Economic Area by StoneX Financial Europe GmbH (SFEG). StoneX is the trade name used by STONEX GROUP INC. and all its associated entities and subsidiaries. StoneX Financial Europe GmbH (“SFEG”) is a securities trading firm registered in Germany under Company No. HRB 80844.


StoneX Financial Pte Ltd (Co. Reg. No 201130598R) (“SFP”) is regulated by the Monetary Authority of Singapore and is a Capital Markets Service Licence holder (for dealing in capital market products), an Exempt Financial Adviser (for advising on investment products and issuing or promulgating analyses/ reports on investment products) and a Major Payment Institution (for domestic and cross-border money transfer services).


SFP may distribute analysis/report produced by its respective foreign affiliates within the StoneX Group of companies pursuant to an arrangement under Regulation 32C of the Financial Advisers Regulations Recipients should contact SFP at (65) 6309 1000 for any matters arising from, or in connection with, this webinar.


StoneX APAC Pte. Ltd. (“SAP”) (Co. Reg. No 200616676W) is regulated as a Dealer (PS20190001002) under the Precious Stones and Precious Metals (Prevention of Money Laundering and Terrorism Financing) Act 2019 for purposes of anti-money laundering and countering the financing of terrorism.


StoneX Financial (HK) Limited (CE No.: BCQ152) (“SHK”) is regulated by the Hong Kong Securities and Futures Commission for Dealing in Securities and Dealing in Futures Contracts.


StoneX Financial Pty Ltd (ACN 141 774 727) holds an Australian Financial Service License (AFSL: 345646) for Dealing in Securities, Exchange-Traded Derivatives Contracts, OTC Derivatives Contracts and Foreign Exchange Contracts, and is regulated by the Australian Securities and Investments Commission.


StoneX Securities Co., Ltd. (“SSJ”) (Co. Reg. No 010401047199) is regulated by the Japanese Financial Services Agency as a Type-I Financial Instruments Business Operator (Kanto Local Finance Bureau (FIBO)No.291’), is a member of the Financial Futures Association of Japan for dealing and broking FX and FX Option transactions, and is a member of the Japan Securities Dealers Association for dealing and broking stock indices and option transactions.


Trading swaps and over-the-counter derivatives, exchange-traded derivatives and options and securities involves substantial risk and is not suitable for all investors. Past performance of any futures or option is not indicative of future success. Indicators are not a trading system and are not published as a specific trade recommendation. The information herein is not a recommendation to trade nor investment research or an offer to buy or sell any derivative or security. It does not take into account your particular investment objectives, financial situation or needs and does not create a binding obligation on any of the StoneX group of companies to enter into any transaction with you. You are advised to perform an independent investigation of any transaction to determine whether any transaction is suitable for you. No part of this material may be copied, photocopied or duplicated in any form by any means or redistributed without the prior written consent of StoneX Group Inc.


The report/analysis herein is not directed to, or intended for distribution to or use by, any person or entity who is a citizen or resident of or located in any locality, state, country or other jurisdiction where such distribution, publication, availability or use would be contrary to law or regulation.


© 2026 StoneX Group Inc. All Rights Reserved.

Satellite view of Earth at night showing illuminated cities across Asia and the Middle East

Discover more insights

Our subscribers have access to comprehensive market analysis from StoneX spanning commodities, equities, currencies and more.

StoneX: We open markets

Our market expertise, advanced platforms, global reach, culture of full transparency and commitment to our clients’ success all set us apart in the financial marketplace.

Reach

With access to 40+ derivatives exchanges, 180+ foreign exchange markets, nearly every global securities marketplace and numerous bi-lateral liquidity venues, StoneX’s digital network and deep relationships can take clients anywhere they want to go.

Transparency

As a publicly traded company meeting the highest standards of regulatory compliance in the markets we serve; our financials and record of accomplishment are matters of public record. StoneX’s commitment to “doing the right thing over the easy thing” sets us apart in the industry and helps us build respect, client trust and new partnerships.

Expertise

From our proprietary Market Intelligence platform, to “boots on the ground” expertise from award-winning traders and professionals, we connect our clients directly to actionable insights they can use to make more informed decisions and achieve their goals in the global markets.