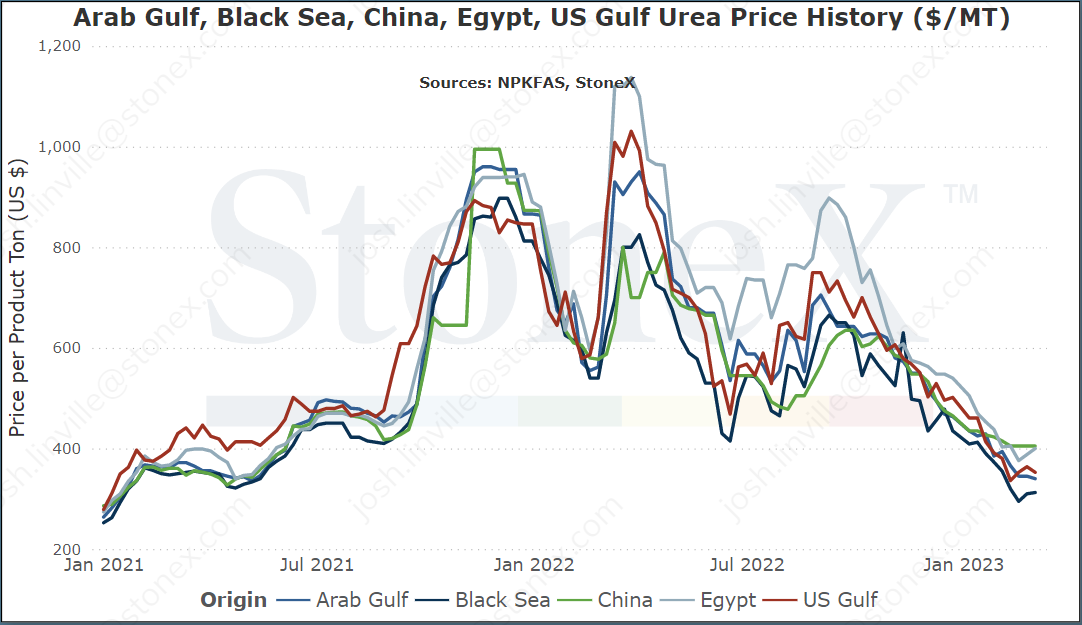
major global urea export location price graphs
The intention of the below graphs are not to use to say "my price should be X based on this graph". These prices are indicated from an FOB price point average. The intent is to show major global price movement trends. I have opted to include US Gulf/NOLA in these graphs due sometimes on/sometimes off again export capability. Also to show N.A. values in relation to the rest of the world.
The first graph shows these prices reflected in metric ton. The second graph in short ton. Both are listed using USD as the currency.
What everyone wants to know first, what do we think will happen going forward
Urea is already the hardest product to try and figure out what is going to happen. With so many things going on, it seems like a coin flip.
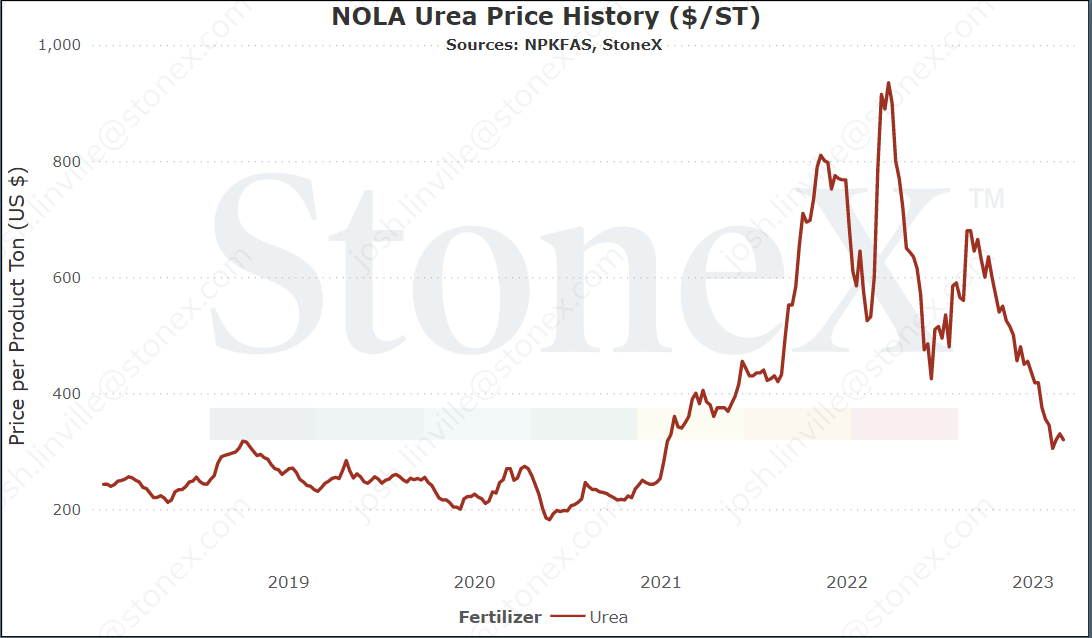
- NOLA values have dropped to $300 and have shown some resilience in popping back up slightly and holding - steady to bullish
- Grain, specifically corn, has seen values starting to trend lower which is making the ratio value worse - bearish
- India finally stepped in with their eagerly anticipated purchase tender but the news was disappointing for market bulls - bearish
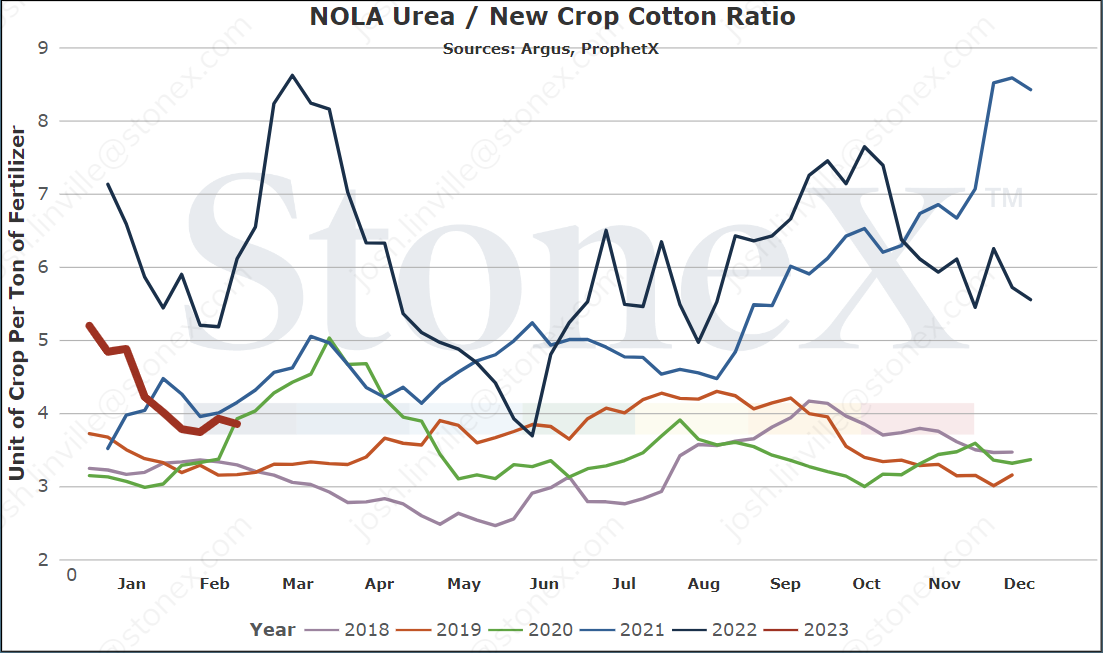
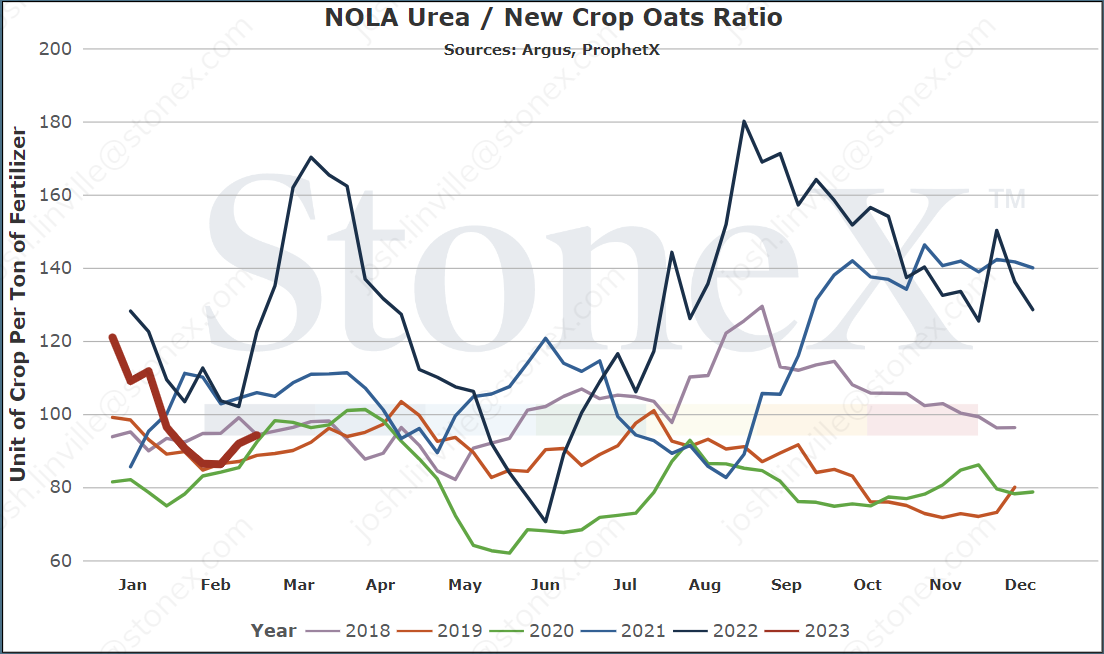
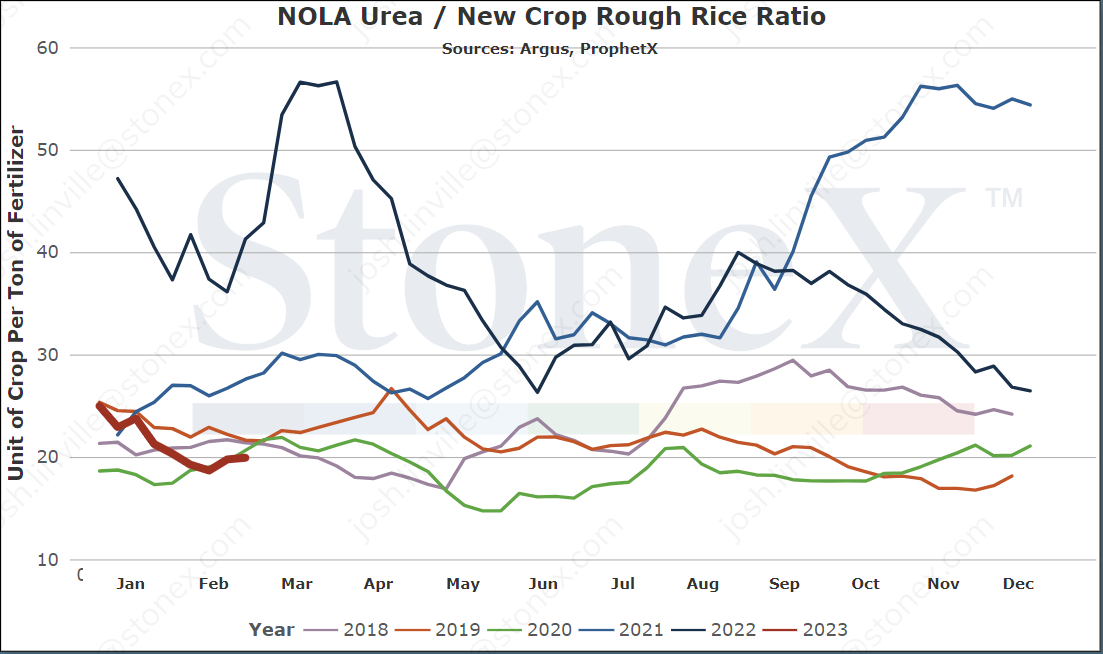
- Even with corn values down and urea number up slightly, the current ratios look solid - bullish
- Urea remains extremely well priced vs alternative N sources and could steal demand - bullish
- An announcement has been made that a European NH3 plant is being shut down permanently, bringing some worst fears to life - bullish
- European natural gas values continue to fall, raising the chance of production restarts - bearish
I could go on but you get the point. That said:
Seems urea is going to struggle to move much higher globally as India has disappointed and world demand has not come forward as expected. That said, it seems downside is limited as well. Until something new breaks us from this cycle, I would not be surprised to see us fairly rangebound in the coming weeks. Spring demand could put pressure on logistics and make regional/local prices spike.
Should you buy your spring '23 urea needs today
Absolutely. If the risk of holding off on purchasing in hopes of slightly lower prices is not being able to have product where you need it when you need it, I would pull the trigger today. Downside does not feel worth the inventory/logistical risk.
Let me back up. I'm not calling for a shortage. If I can help it, I will never talk about a shortage again. We have cried wolf too many times.
In a free market, there is no such thing as a shortage. It is just that the price has not gone up enough to kill demand and rebalance the S&D. But if the entire market waits until the last minute and the surge of demand comes forward, that bidding war will erupt and it could still take longer than normal to get tons in place.
I'm all about saving every penny possible (unless it comes to green paint then buy that John Deere baby!!!) but NOT AT THE EXPENSE OF NOT HAVING MY PRODUCT IN PLACE. Spring is already hard enough. No need to complicate it further.
general global urea information
What has happened in the last 30 days?
India FINALLY steps forward to buy...but it is disappointing for market bulls
Since the conclusion of their last purchase tender back in November, the market has been watching for India to step forward to buy more tons. In the last couple weeks, market rumors grew to fever pitch and finally concluded with their official announcement.
Those that were hoping this would be the thing that set urea on a bull course were disappointed.
Many in the market were expecting/hoping that India would secure 1.5MMT or more to help wipe out inventories around the world. They were disappointed when India announced they only needed 1.0MMT. They can secure more...but will they?
That wasn't the bad news. These tenders usually have a shipment window up to 45 days. There were talks that they might extend it to 60 days. If this happened, it would be extremely difficult to paint this tender in a positive price light.
Imagine the surprise when India announced a shipment window thru JUNE 1. All, this is unheard of to have a window this wide. Frankly, they could triple the tons they are looking for and it would STILL be hard to paint a bullish picture.
We have to remember that this is fertilizer. If everything looks like it is going to be bearish, that usually means we have a bullish situation ahead!! We will know more by early next week but barring a bull miracle, this is not going to be the price supportive event some had hoped for.
Europe remains in focus
There are a couple storylines in Europe that we are tracking. If you skip over them here, don't worry. They are covered in the UAN and NH3 sections. Almost like they are related!!!!
The first storyline was the announcement by BASF that they were permanently closing one of their NH3 production plants. In the scheme of the world market, this isn't a big deal. Sure it is a big plant but it is tiny on the global stage. Also, it was only NH3 so it shouldn't affect urea. However, it is the emotional toll that matters.
When European production started going offline, one of the big fears was that these old production plants may never come online. The European government is not exactly supportive of nitrogen production, the plants are very old and the longer they sit, the harder to decide to turn them on. We had not seen anything announcing a closure...until BASF. This triggers the fear that more announcements are on the way. We need to let the actual announcements (if there are any) occur before we react but if we see others made, that could turn the market.
On the flip side, European natural gas values continue to fall. August, the Dutch TTF sat at $103. Today, nearby months are trading in the $14 price level. The market has been hopeful that we would see plant restart announcements due to the low cost. The last time natural gas was priced that low, more production was online. The difference is that overall nitrogen values are down so production needs to get cheaper to be profitable. We are not there yet. We might be soon...but not yet.
Europe will continue to be an important watch.
The lack of any real world demand has hurt world urea values
When we entered December, we were not going to be surprised by a lack of demand. India marked the last of major buying in 2022. The only thing we were watching was whether Q1 demand would step forward early to take advantage of lower prices. It did not, buying remained quiet and as fertilizer does, prices fell.
When we got thru Christmas and New Years, we were sure we would see world demand step forward. North America needed to buy. Europe needed to buy. India needed to buy. Problem was...not one bought. Since no one bought and production continued to produce physical inventories, prices fell further. Not to fear, demand would come as a wave in February.
Have I mentioned how much I hate urea?!!!
We got to February and again...crickets. Nothing. The only saving grace was India extremely late in the month but as you have read above, it was not the answer we had been looking for. Because demand had stayed away, producers were shipping vessels of product without having a price tied to it. They needed to get product out the door or run the risk of shutting down their plant for lack of storage.
It goes without saying that buyers have LOVED this situation and are using it to their advantage.
If we were to see a sudden surge of demand come forward, it could turn this whole thing around but as of today, I have not seen anything indicating that is the situation.
U.S. has some import work to do
Against some beliefs, the U.S. is a net importer of urea. We do not produce enough to meet our demand. We have to get product from the rest of the world.
The last time we updated our demand models, we estimated that we needed 5.1M tons imported between July '22 and June '23. Based on government data, we know that around 1.6M tons were imported in the first half of the year (July thru December). We also estimate that around 900K was imported total January/February.
If we assume June only brings in 300K (that is on the high side of recent years), we still need to import a whopping 2.3M tons between March/April/May.
Pretty big number, right? That doesn't take into account corn acres going up or down from here. It doesn't take into account urea demand surge due to its cheap price vs UAN and NH3. That 5.1M ton number moves. Why does that matter? Our biggest importing region is the Middle East. It takes approximately 30 days to sail from there to here. That assumes the product is ready to be loaded onto the vessel. That assumes a ship is already docked. Then, once it is at NOLA, it has to be moved to a barge, moved up river, moved by rail, moved by truck, etc. By the time you decided on April 1st that you need more urea, those tons do not arrive until June.
All is not lost. I'll stop fanning the flames. 2.3M tons is a big number over 3 months. But it isn't...we have done it many times before and knowing the fertilizer industry, it will make it happen again.
This is trying to show the delicate dance that our price does with the rest of the world. Our values cannot get too cheap vs the world value or run the risk of not bringing enough product. Our values cannot get too expensive or run the risk of over importing tonnages. We have to stay in that sweet spot.
There is a lot of work to make spring happen...
Supply chains are going to be groggy
Fertilizer typically works in one fashion. Summer see's the yearly low price set and then a somewhat steady price increase goes until spring season. That allows the market to have faith that their first purchases are solid. It gives confidence to put product in place when farmers are reluctant to buy since they will not lose money. It's...easy.
This last year has not been easy. It has been more bearish than bullish. Any faith/confidence that was there is completely wiped out. What does this mean for the supply chain? It is reluctant.
Farmers have been sitting on their hands in hopes of lower prices which means end demand remains unseen. Retailers are scared to death because farmers are not stepping forward and they cannot take the risk. They cannot buy physical product, put it into place and then watch the price fall $100. They will be out of business in no time so they do nothing. The traders/suppliers sit on their hands for similar reasons. Ultimately, less product movement gets done.
This remains my biggest spring fear. It isn't that there isn't enough product. It is that it isn't in the right places at the right time. If we see significant portions of the market wait until the last minute, I do not think logistics can keep up. It will eventually show up but it may takes days or worse. Some springs, we do not have hours to wait.
I'm not trying to press you to buy everything right now but I am IMPLORING you talk to you suppliers. The more planning we can do, the better chance of a successful spring.
I do not want the coming newsletters to have "oh no" sections...
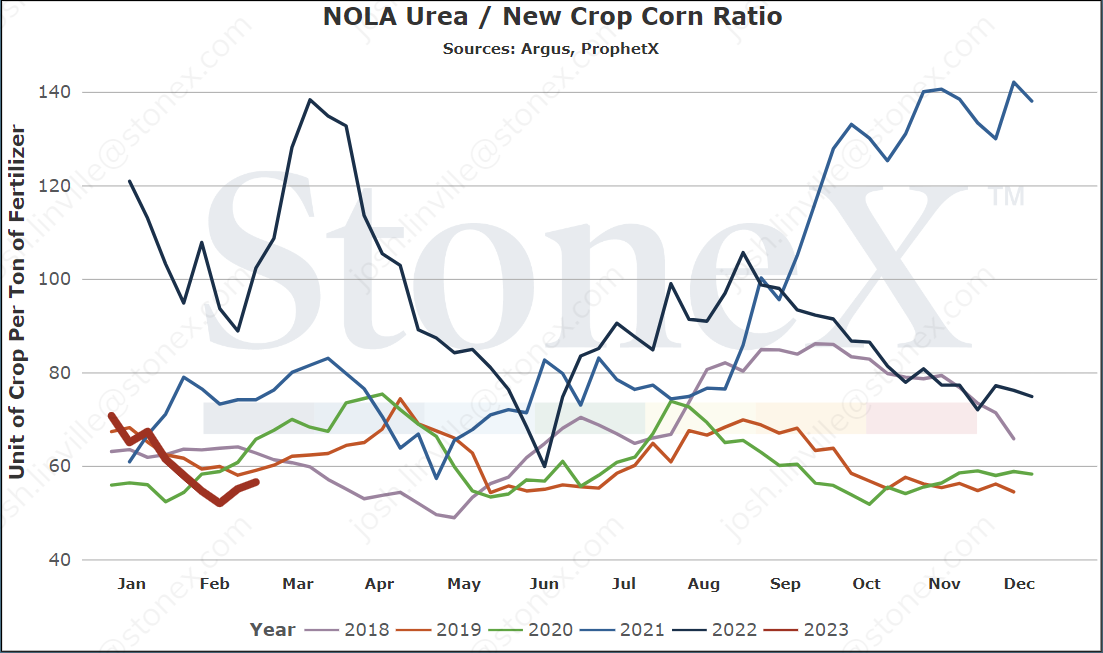
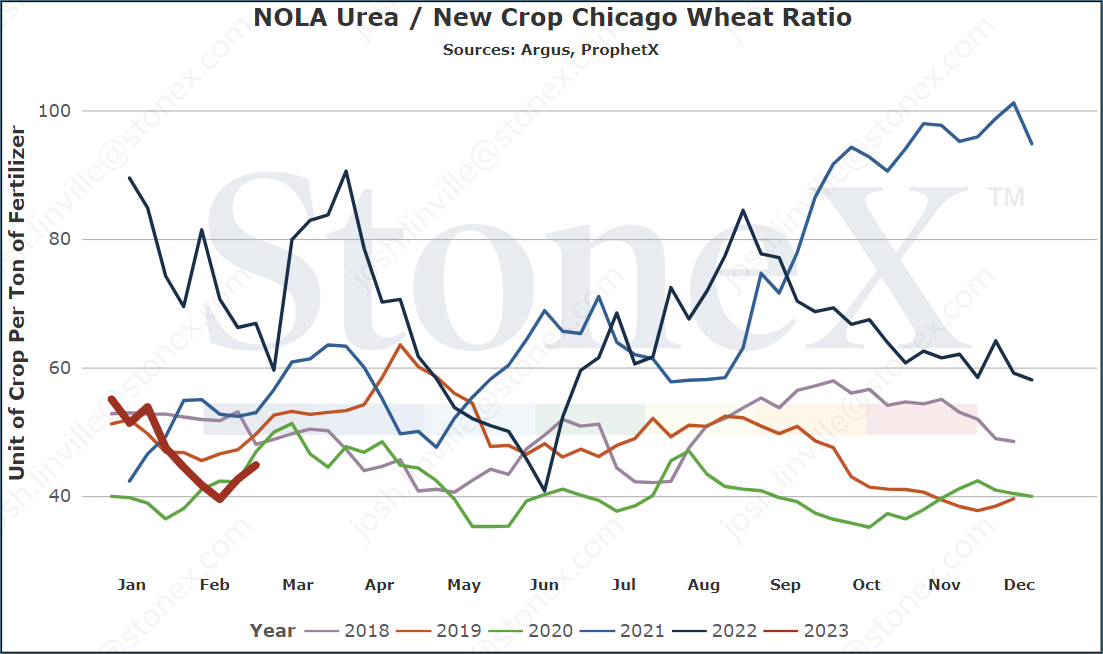
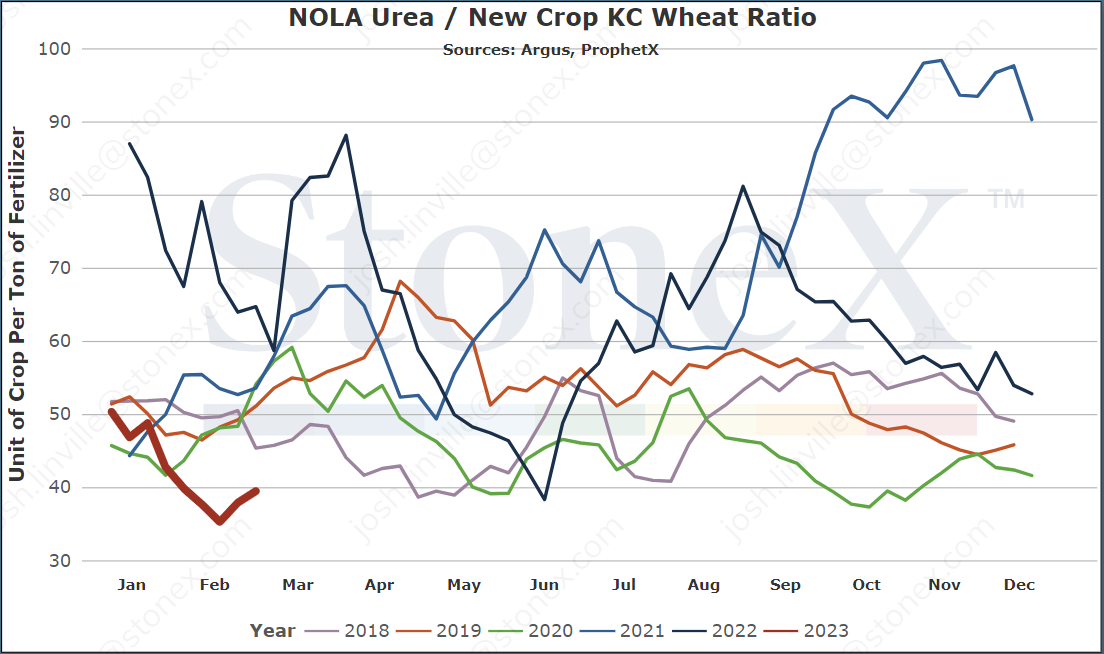
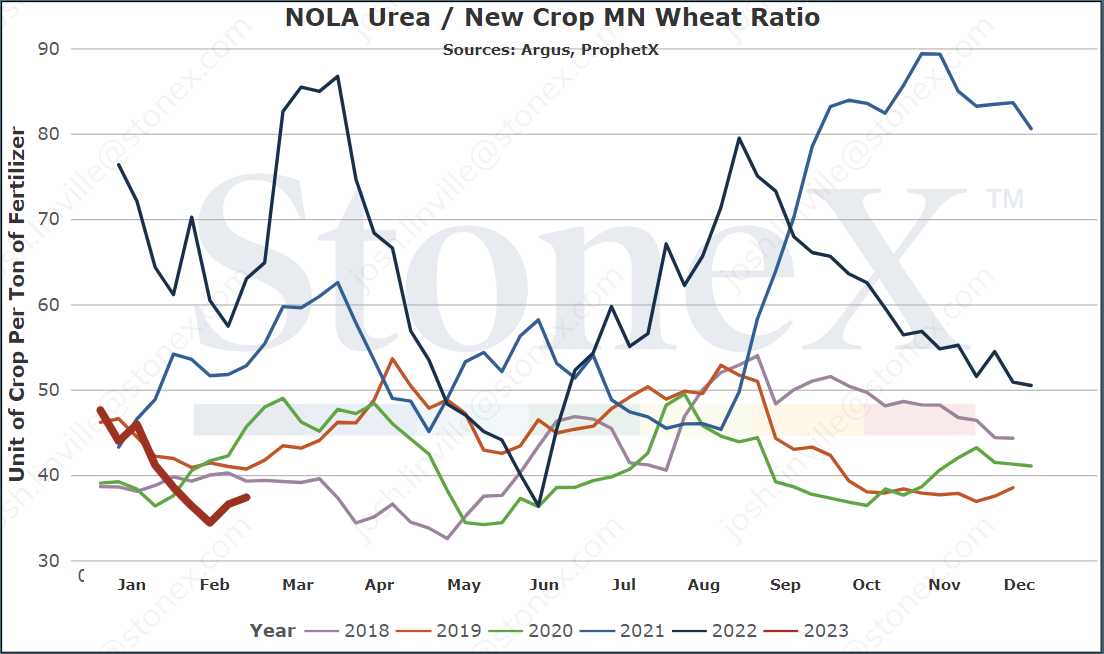
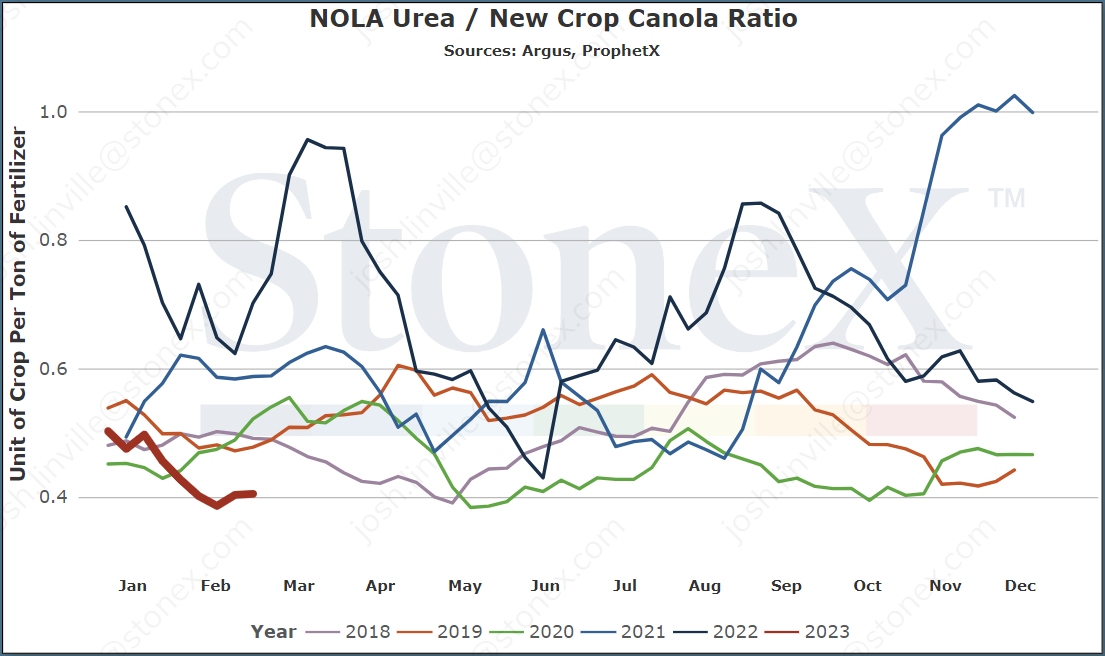
The corn/urea ratios are solid
I'm not going to go into too many details. You can look below at the ratio charts and see it for yourself.
Those graphs prove that waiting for the highest grain price is not always the best value. We have seen corn as high as what? $6's? $7's? In the last few weeks, December 2023 corn was trading around $5.90. Still solid but a far cry from the high's. However, urea fell and established one of the best values seen in the last half decade.
Ultimately, we want to spend less bushels per ton of urea. That approach does not care how high corn values are. It does not care how low urea prices are. It works on every single input.
Look for the value.
Also, crops like KC Wheat and Canola should take a hard look at the graphs below. They are at some of the best ratios since 2018. Canola is nearly as low as it has been since 2003.
India releases more info on their purchase tender
This is being added last minute so excused the lack of full breakout.
India released the next round of information on the tender and the results were "yawn".
Just over 3.5MMT were offered vs their stated goal of buying 1M tons (which can go higher). That is a big number.
Lowest west coast price was $330 which was right in line with market expectations.
Now we wait and see how many tons they can buy. If the market holds their prices high and India falls short of needs, it could paint a bullish picture globally (not likely at the moment). Or they could lock up a lot more tons and the world moves on.
Where are current values in relation to the past
NOLA/New Orleans, Louisiana
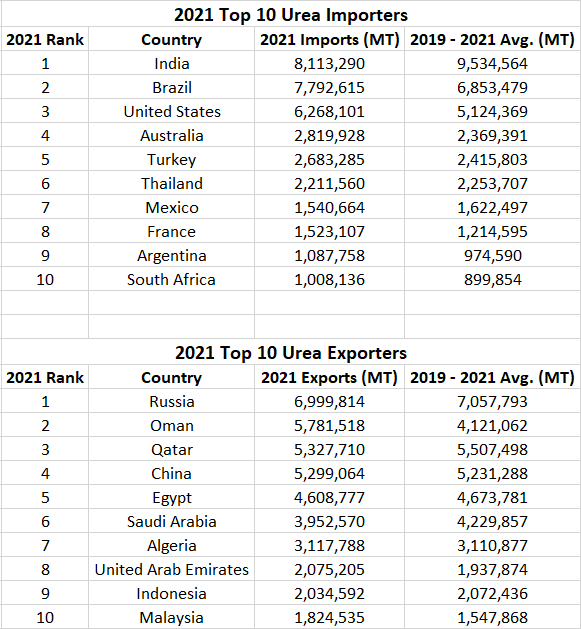
Number 3 importer (6.3mmt in 2021)
Top 5 import origins
- Qatar (19%)
- Russia (18%)
- Canada (13%)
- Algeria (12%)
- Saudi Arabia (12%)
Price comparisons
- Vs 30 days ago - -13% or approximately $45 lower
- Vs 90 days ago - -32% or approximately $146 lower
- Vs 6 months ago - -54% or approximately $370 lower
- Vs 1 year ago - -61% or approximately $478 lower
U.S. Midwest Average
- Vs 30 days ago - -14% or approximately $63 lower
- Vs 90 days ago - -36% or approximately $215 lower
- Vs 6 months ago - -48% or approximately $347 lower
- Vs 1 year ago - -52% or approximately $409 lower
U.S. Southern Plains Average
- Vs 30 days ago - -12% or approximately $55 lower
- Vs 90 days ago - -31% or approximately $170 lower
- Vs 6 months ago - -47% or approximately $343 lower
- Vs 1 year ago - -48% or approximately $350 lower
U.S. Northern Plains Average
- Vs 30 days ago - -13% or approximately $57 lower
- Vs 90 days ago - -34% or approximately $198 lower
- Vs 6 months ago - -47% or approximately $345
- Vs 1 year ago - -50% or approximately $394 lower
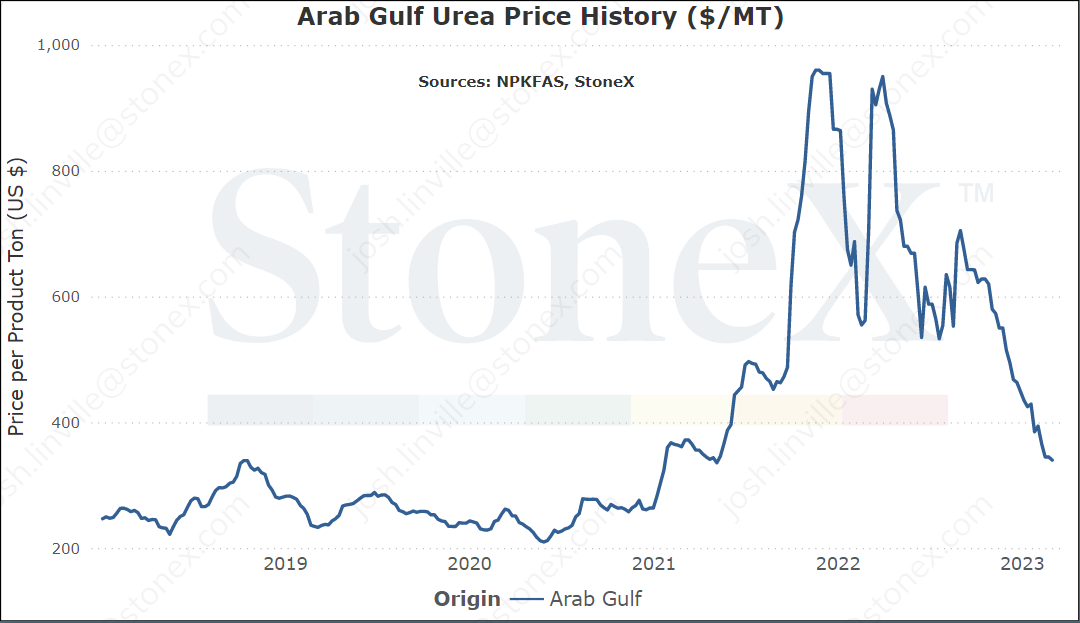
Middle East
Number 1 exporter (as a region, not as individual nations)
- Vs 30 days ago - -12% or approximately $45 lower
- Vs 90 days ago - -34% or approximately $175 lower
- Vs 6 months ago - -52% or approximately $365 lower
- Vs 1 year ago - -52% or approximately $365 lower
Egypt
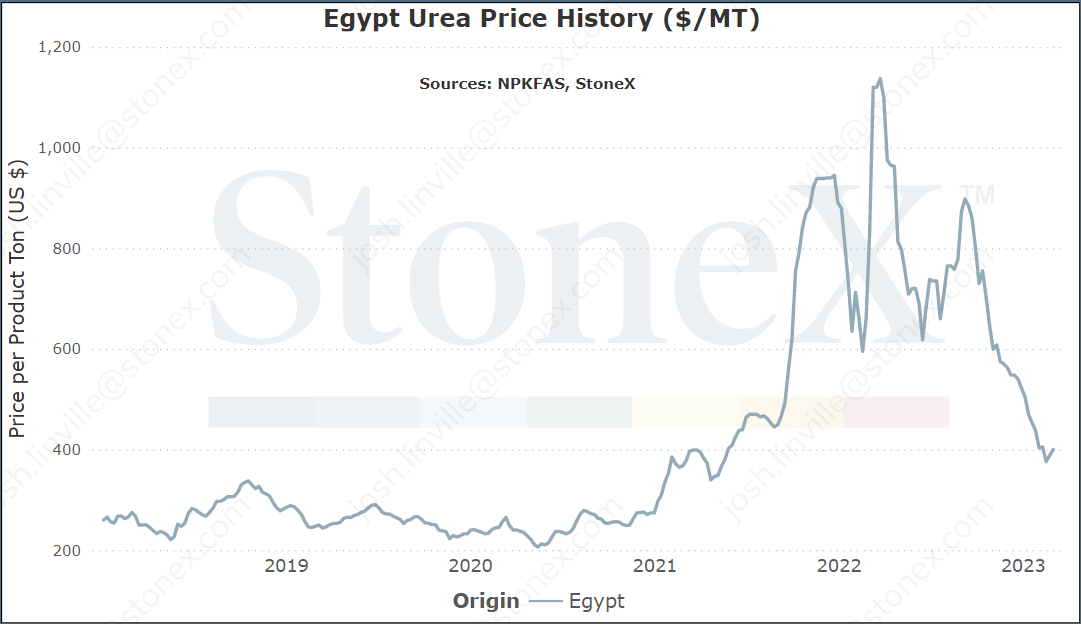
Number 5 exporter (4.6mmt in 2021)
Top 5 export destinations
- India (14%)
- Argentina (14%)
- Turkey (11%)
- France (10%)
- Italy (9%)
Price comparisons
- Vs 30 days ago - -9% or approximately $37 lower
- Vs 90 days ago - -29% or approximately $162 lower
- Vs 6 months ago - -54% or approximately $473 lower
- Vs 1 year ago - -52% or approximately $432 lower
Black Sea
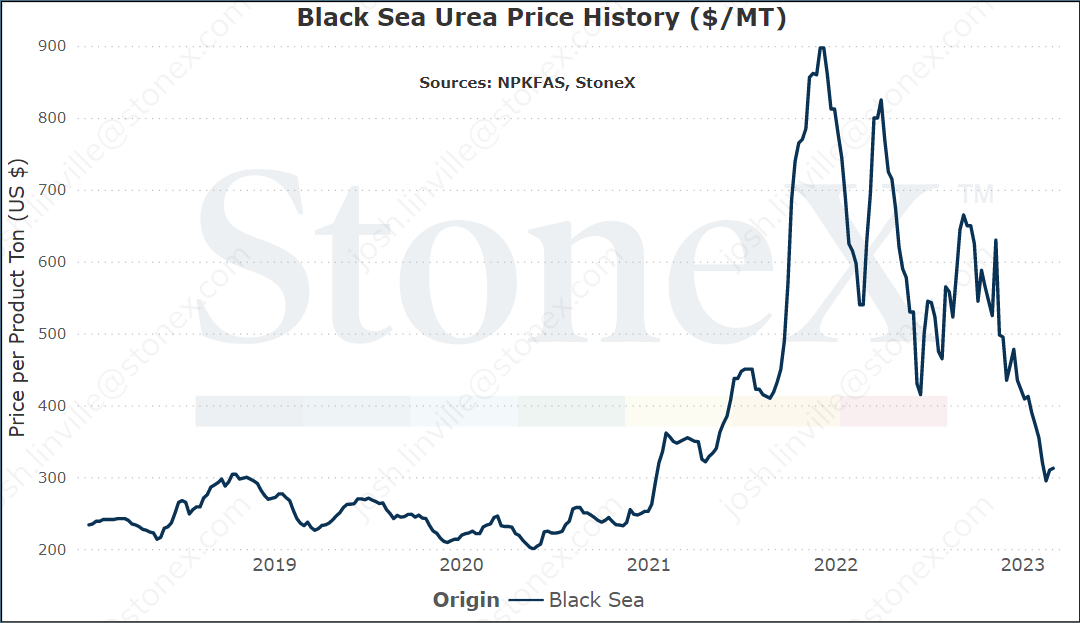
Number 1 exporter (7mmt in 2021)
Top 5 export destinations
- Brazil (20%)
- United States (16%)
- Canada (8%)
- Mexico (7%)
- India (3%)
Price comparisons
- Vs 30 days ago - -16% or approximately $60 lower
- Vs 90 days ago - -28% or approximately $122 lower
- Vs 6 months ago - -52% or approximately $332 lower
- Vs 1 year ago - -50% or approximately $317 lower
China
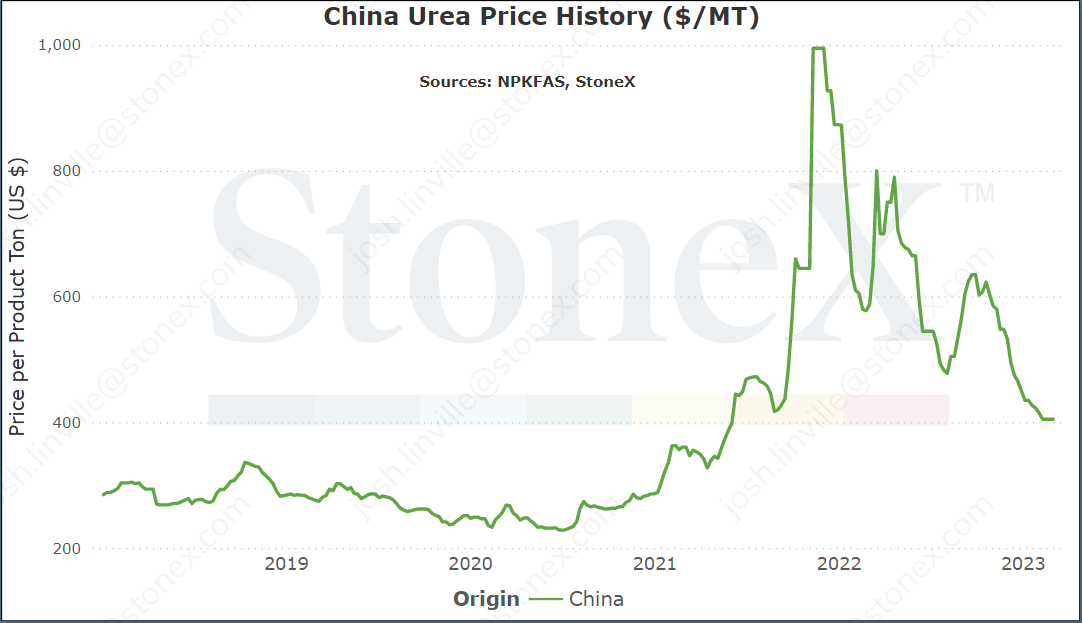
Number 4 exporter (5.3mmt in 2021)
Top 5 export destinations
- India (53%)
- South Korea (12%)
- Mexico (8%)
- Chile (5%)
- Colombia (3%)
Price comparisons
- Vs 30 days ago - -4% or approximately $17 lower
- Vs 90 days ago - -24% or approximately $127 lower
- Vs 6 months ago - -28% or approximately $160 lower
- Vs 1 year ago - -31% or approximately $182 lower
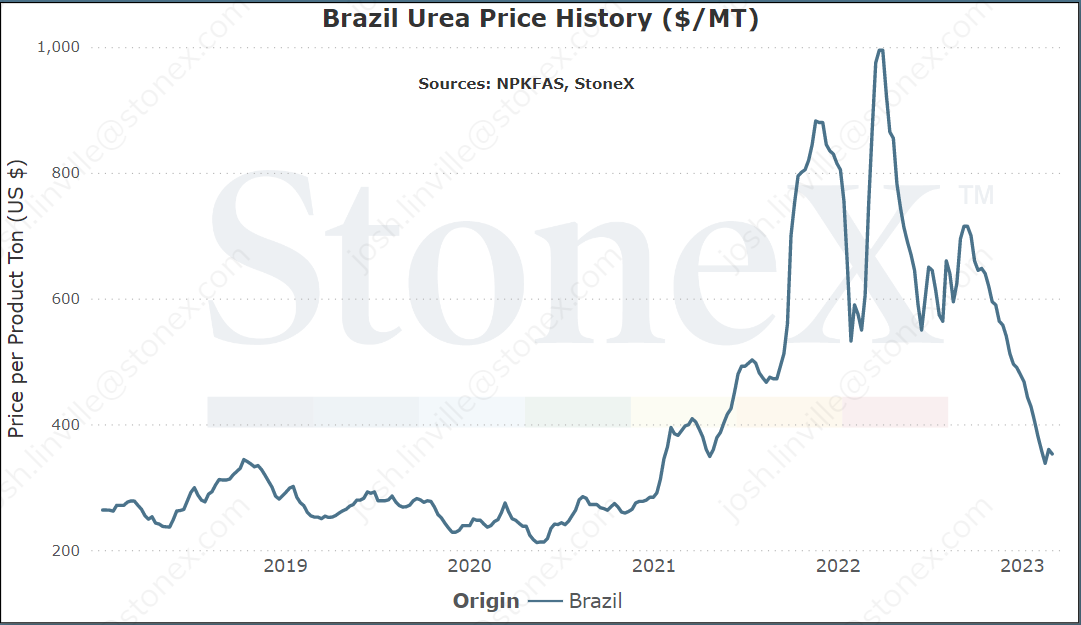
Brazil
Number 2 importer (7.8mmt in 2021)
Top 5 import origins
- Qatar (23%)
- Russia (18%)
- Oman (16%)
- Algeria (14%)
- Nigeria (11%)
Price comparisons
- Vs 30 days ago - -13% or approximately $52 lower
- Vs 90 days ago - -35% or approximately $187 lower
- Vs 6 months ago - -49% or approximately $342 lower
- Vs 1 year ago - -53% or approximately $397 lower