

The intention of the below graphs are not to use to say "my price should be X based on this graph". These prices are derived from an FOB price point average. The intent is to show major global price movement trends. Your values will likely have significant basis difference (similar to your local grain price being different than the traded market price).
This graph is labeled as MT in USD currency.
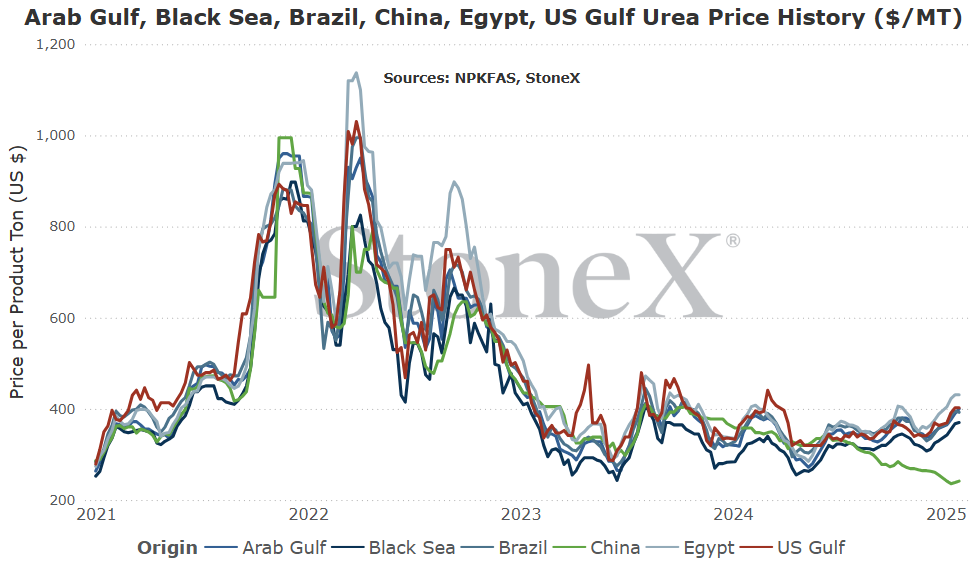
- Chinese exports are still non-existent...but their stockpiles are huge. Record high's by some accounts. Could this mean the government softens its export ban to allow some tons to flow? How will that be interpreted?
- Iran production is offline...but it isn't expected to be a long term situation. They should return sooner than later we think. If they return, does that do much to change things?
- Europe...I have no hope for Europe today.
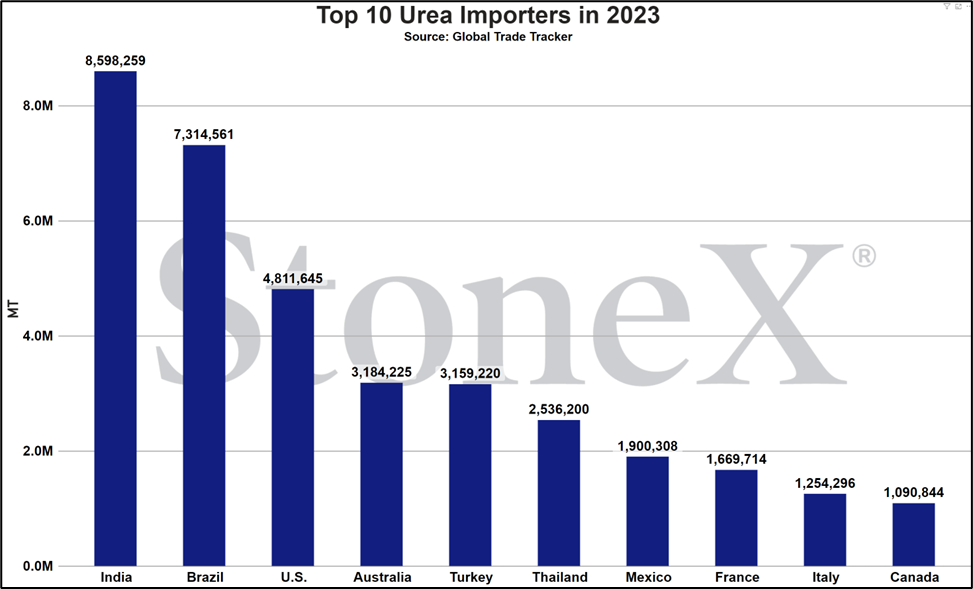
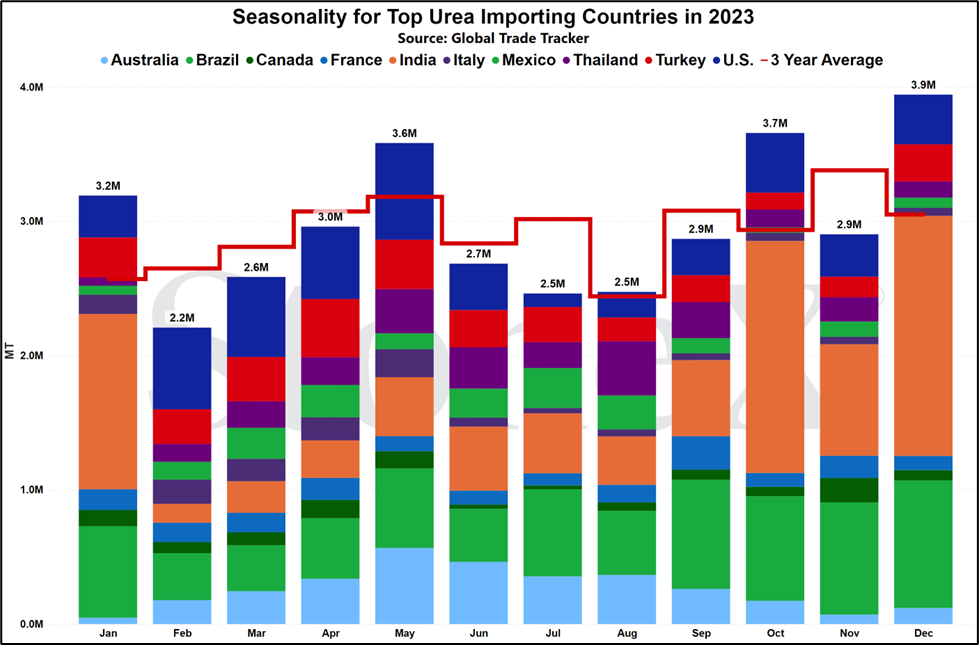
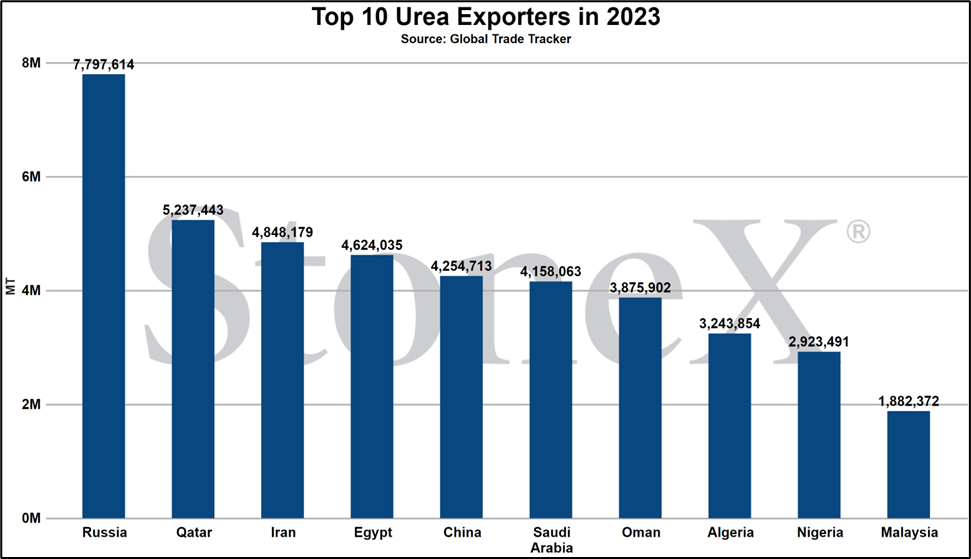
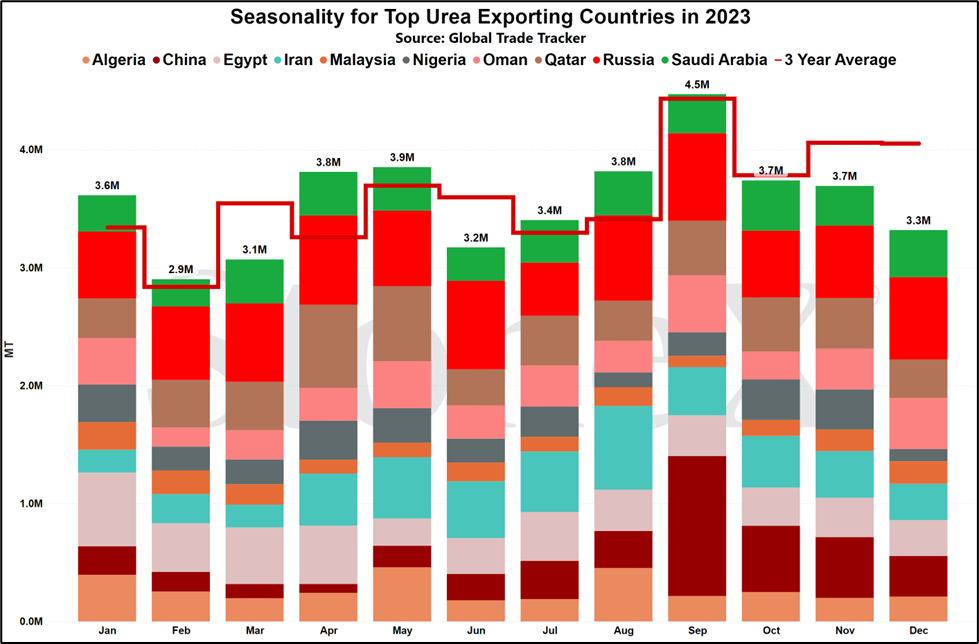
- Years of sanctions have not allowed materials/personnel to enter the country to keep gas infrastructures in top shape which may reduce supply capabilities.
- Iran is currently in their "winter" season which means temperatures drop. That causes residential demand to spike to stay warm. This surge of demand overwhelms their gas S&D and causes the government to slow/stop industrial demand in favor of its people.
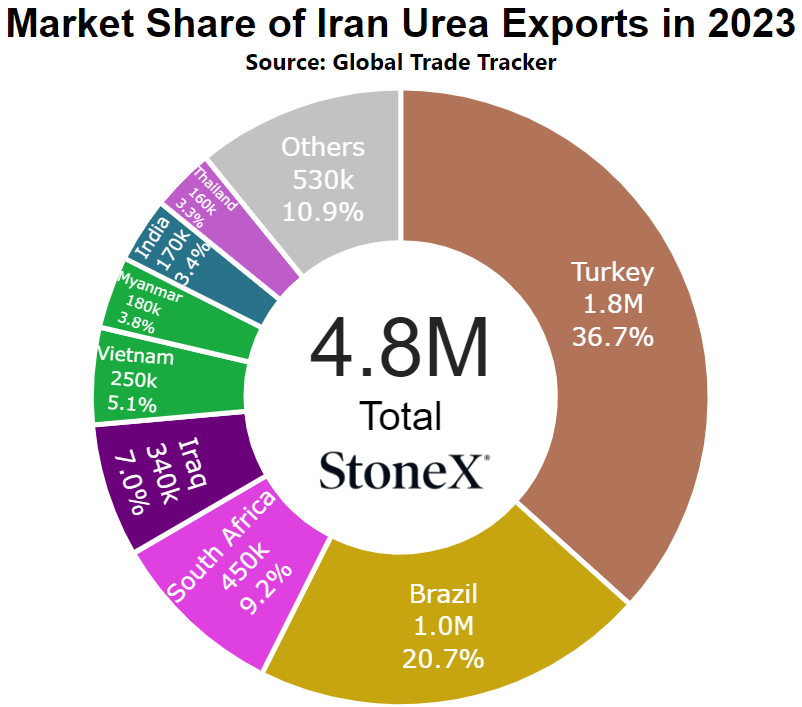
Globally, supplies were already tight with Chinese exports not existing (more below) and European production still at 75% with fears rising it could get worse (again, more below). For every 30 days that Iranian production is offline, the world loses 400K tons that cannot be "made up" short term. This, combined with India laying the supply story bare, helped to finally spark price ideas significantly higher.
Now, we do not believe this will be a long term issue. We are expecting to see reports that production has returned in the coming weeks, but there are no guarantees to this. When they return, no doubt it will remove some of the worst fears in the market, but damage will have already been done and the calendar simply isn't the buyers friend.
What does this mean for farmers?
If this was a story on its own, I probably wouldn't be worried. I think this is a short term event which will hopefully result in less than 1M tons lost.
However, it isn't a story in its own.
- Chinese exports still do not exist (that could change but hasn't yet).
- European production is still 75% of normal (higher chance it gets worse than better).
Adding Iran offline to this mix was the final nail in the coffin. When all 3 are combined and broken down to an annualized basis, the world is losing 1M+ tons per month.
The world does not have that kind of excess capacity available. Supplies are down. Demand looks solid. In Econ 101, the answer was higher prices...
- Ensure adequate supplies for domestic farmers.
- Put pressure on domestic values, putting their own farmers in better position vs the world.
Fortunately for Chinese farmers, the strategy has worked. Unfortunately for the rest of the world, the strategy worked and continues to be used today.
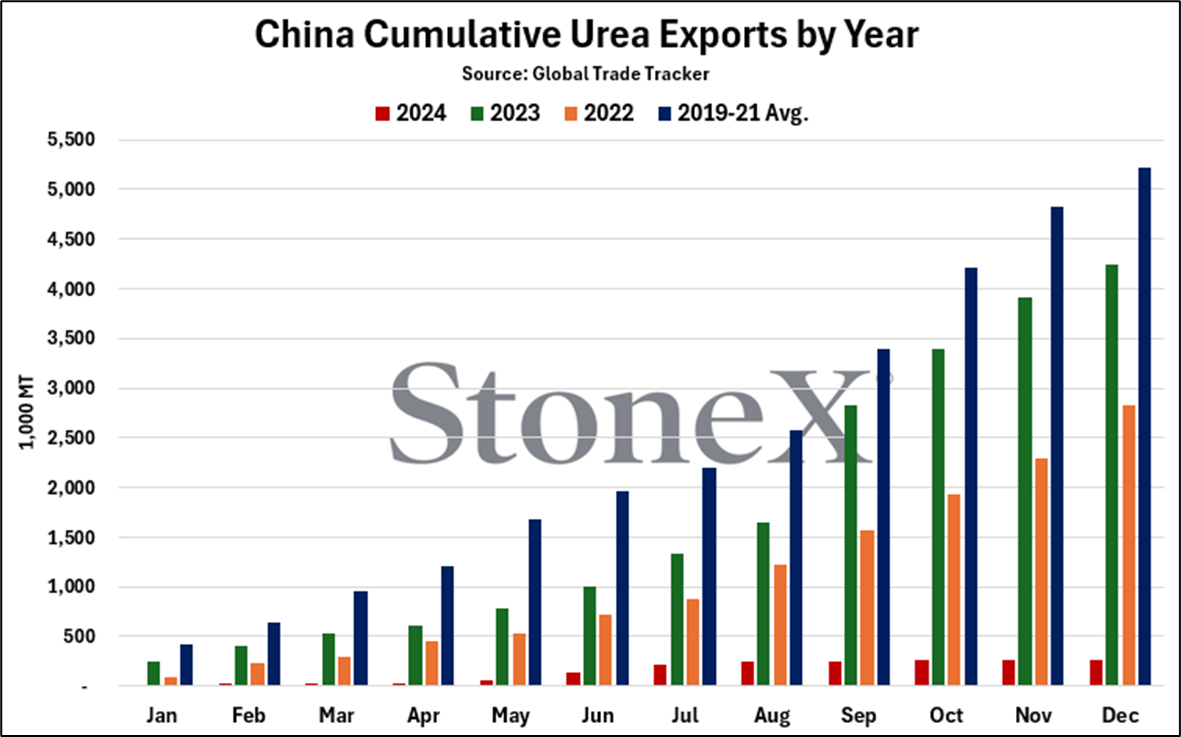
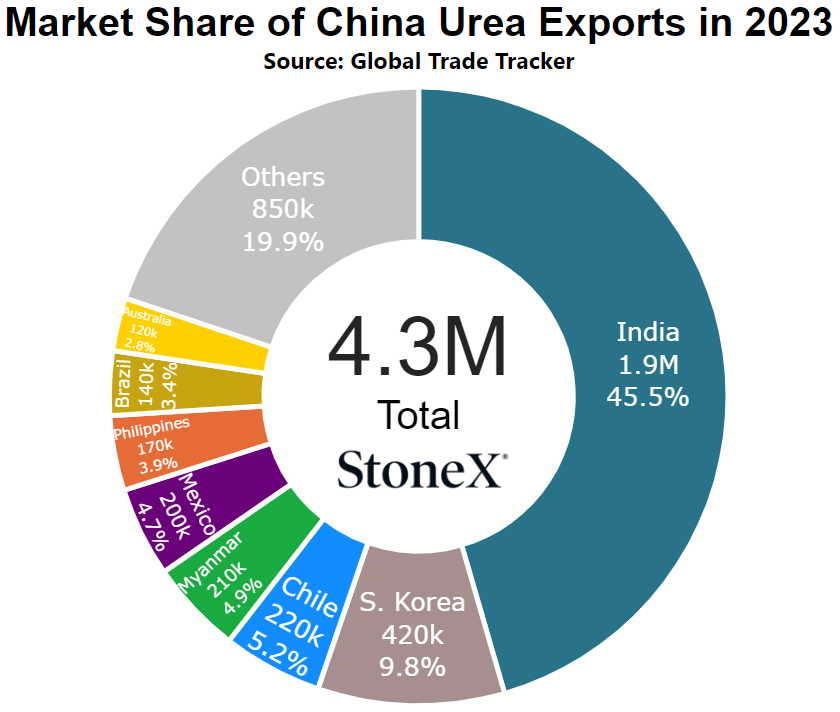
There was hope in 2023 that typical export flows were returning. While the year closed less than normal, seeing 4.25M tons be released was welcome...but that helped keep their values higher. 2025 saw enormous restrictions put into place and 2024 calendar year trade data reflects that only 266K tons departed. In perspective, this is 5M tons less than the market is used to. This leaves a massive hole in the global S&D and the world has been paying the price.
Now the question is what will happen in 2025.
On the one hand, there is reason to be hopeful. We have recently heard rumors/seen reports that Chinese stockpiles of urea are at record levels. This helps answer our question of where all the tons have been going because their operating rates have remained high. In a normal situation, we would think that the government would allow exports to return to help alleviate these massive stockpiles. If Chinese exports are allowed to return, it would add much needed supply to the world and take an edge off the current story.
On the other hand, the government should be caring more for its farmers than manufacturers. If they allow exports, it is likely that values will start to climb domestically which is in stark contrast to their stated goals. From their perspective, would you rather allow exports which helps several manufacturers or keep exports low and prices down which helps hundreds of millions of farmers?
Ultimately, it is China. We do not know what they do. We take a very reactionary position in terms of their programs meaning that we try to think thru the possibilities. While we do not know what route they will take, at least we will have a game plan for if/when one plays out.
Today, our stance is that exports will remain very restricted near-term which will keep global supplies tight and prices higher...but there is a chance they return.
What does this mean for farmers?
When I spoke about Iran above, I stated that for it I wouldn't be nearly as worried if it stood on its own.
China not exporting is a story with or without help.
China represents 10% of the global urea export market and is highly driven by government interaction. That means we have no freaking clue what will happen with a large chunk of tons.
Calendar year 2024 closed with excessively low exports which result in much tighter global supplies. Could they keep 2025 exports slow? Yes. Would that move the market? Yes. Could they resume exports in 2025? Yes. Would that move the market? Yes.
For now, we must assume exports will remain low until they are not and as long as they are low, urea prices are high.
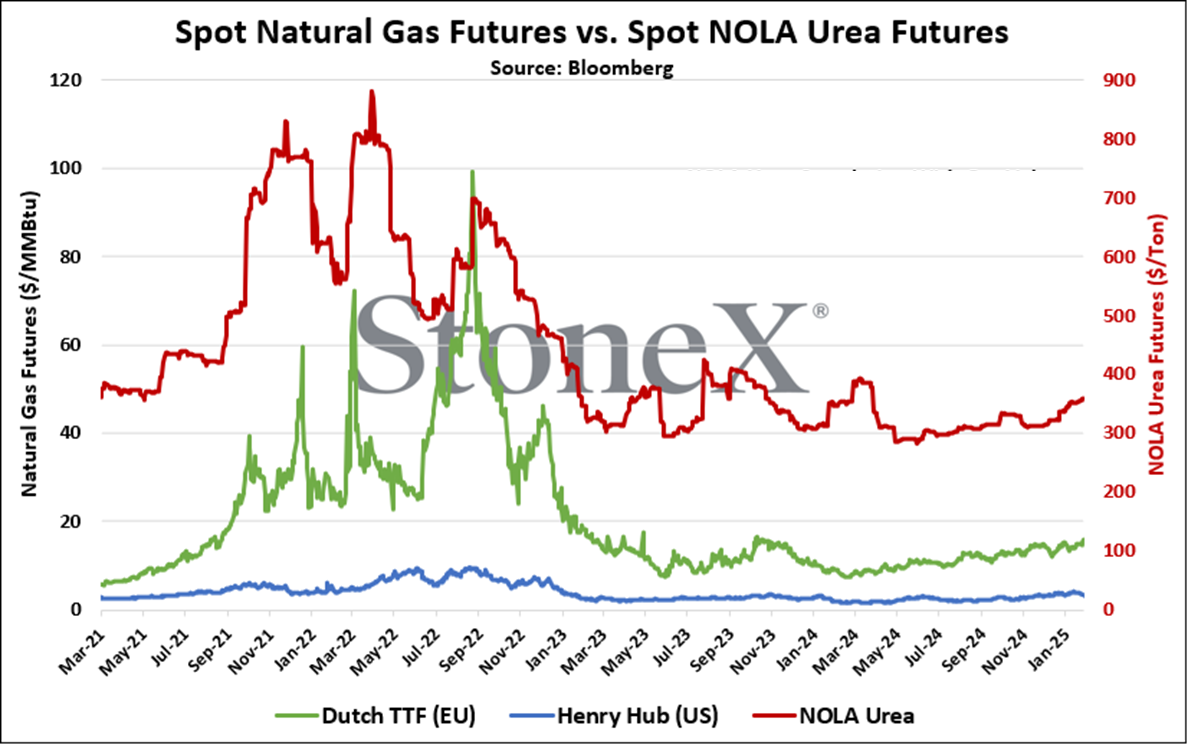
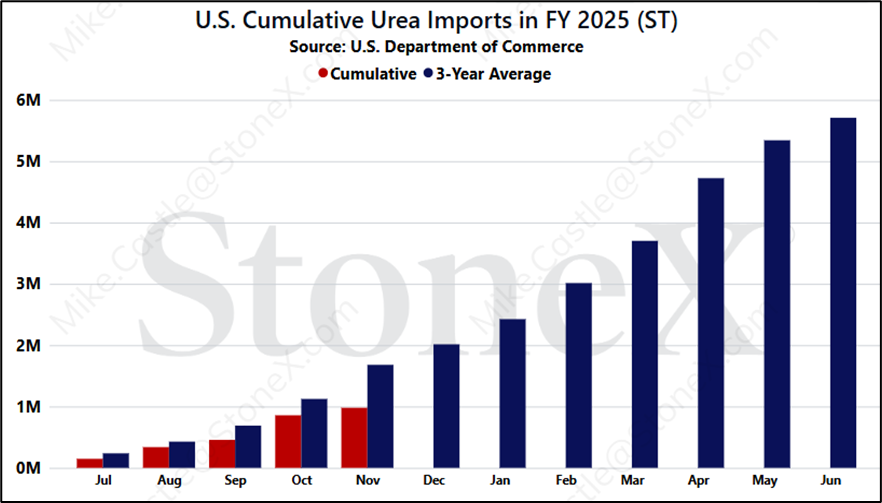
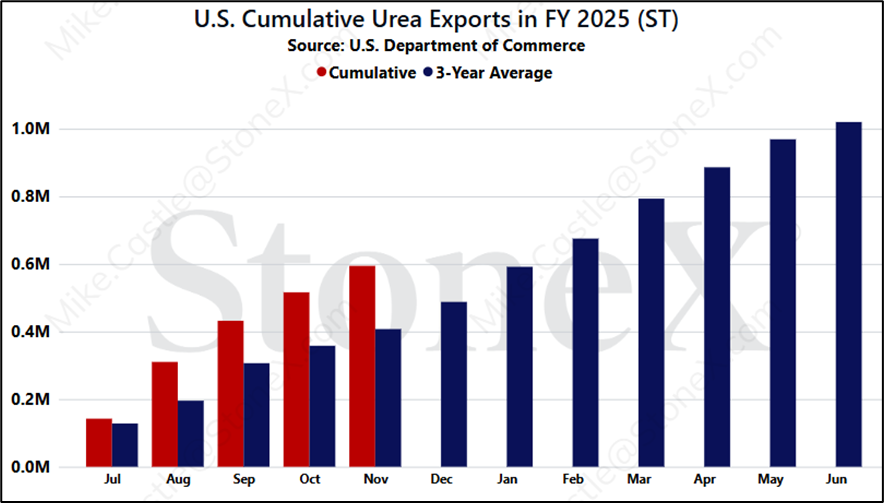
- I am fearful global values will continue to appreciate.
- I am fearful that the N.A. market is about to get fearful as we flip the calendar to February.
- The world IS tight on supplies.
Our prices have rallied pretty hard since last month but do not let that fool you. There could certainly be more bullishness left...
What does this mean for farmers?
This is what worries me that N.A. farmers haven't seen the worst of price increases.
My biggest fear is that the market is going to "freak out" in the coming couple weeks as it realizes the poor S&D situation. When it does, a buying frenzy will begin and prices almost always go higher when that happens.
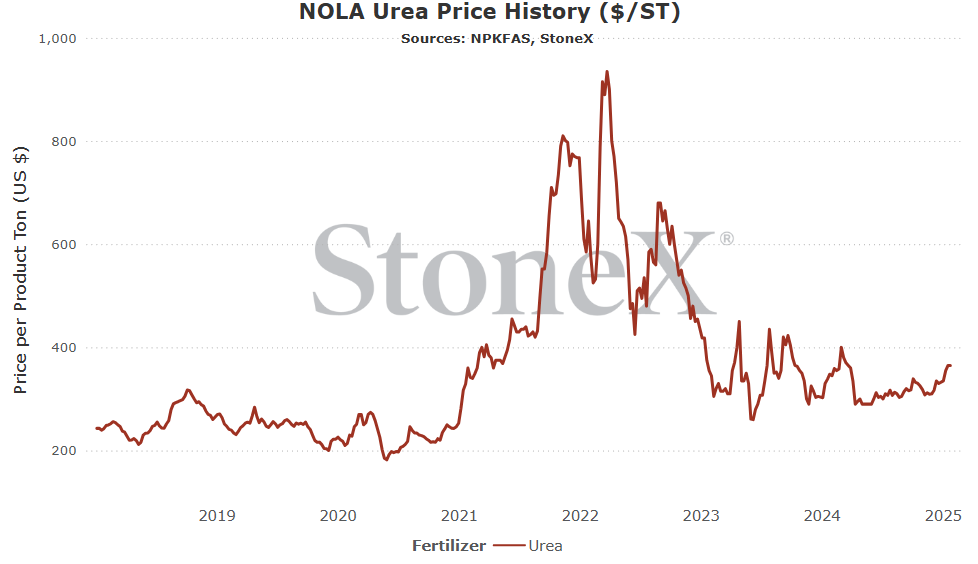
We still have time to get imports but that time is running out. We could see NOLA prices jump $50 from where they sit right now just to get to normal world premiums. That would put our price $25 over replacement and turn on the light for vessels to arrive. However, given how tight we see the S&D, I'm not sure $25 premium is enough.
Then we have to factor in the world market. The above assumes global markets stay flat and I do not believe that will be the case. I've been wrong before and markets are always changing but today, there are a lot more factors that point to higher prices than lower.
We are in a race, starting behind and have a lot of ground to cover.
NOLA/New Orleans, Louisiana
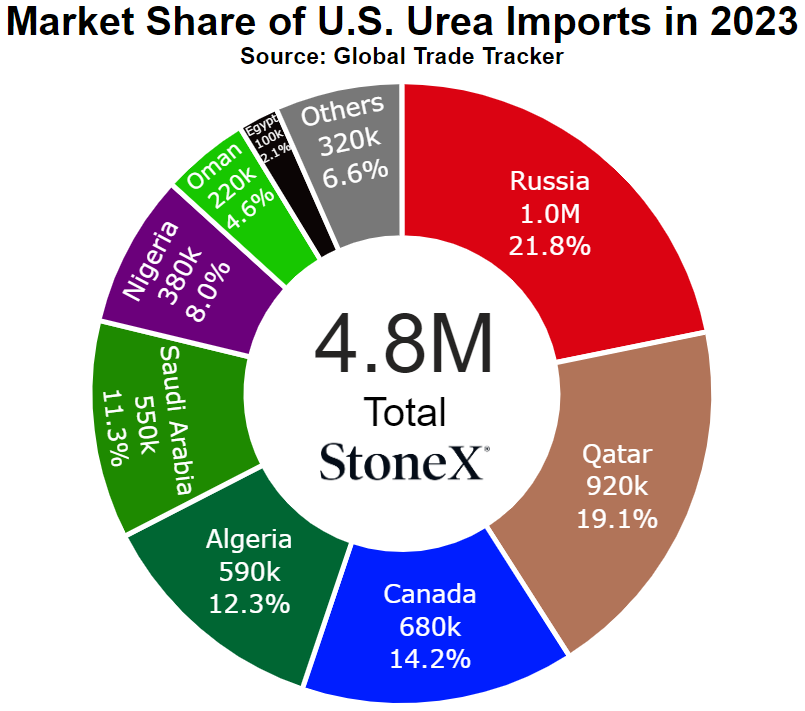
Number 3 global importer in 2022
Price comparisons
Vs 30 days ago - 11% or approximately $35 higher
Vs 90 days ago - 11% or approximately $35 higher
Vs 6 months ago - 19% or approximately $58 higher
Vs 1 year ago - 5% or approximately $17 higher
U.S. Midwest Average
Vs 30 days ago - 7% or approximately $26 higher
Vs 90 days ago - 8% or approximately $30 higher
Vs 6 months ago - 13% or approximately $48 higher
Vs 1 year ago - 11% or approximately $42 higher
U.S. Southern Plains Average
Vs 30 days ago - 10% or approximately $40 higher
Vs 90 days ago - 10% or approximately $40 higher
Vs 6 months ago - 19% or approximately $68 higher
Vs 1 year ago - 7% or approximately $28 higher
U.S. Northern Plains Average
Vs 30 days ago - 4% or approximately $15 higher
Vs 90 days ago - 5% or approximately $21 higher
Vs 6 months ago - 11% or approximately $40 higher
Vs 1 year ago - 3% or approximately $12 higher
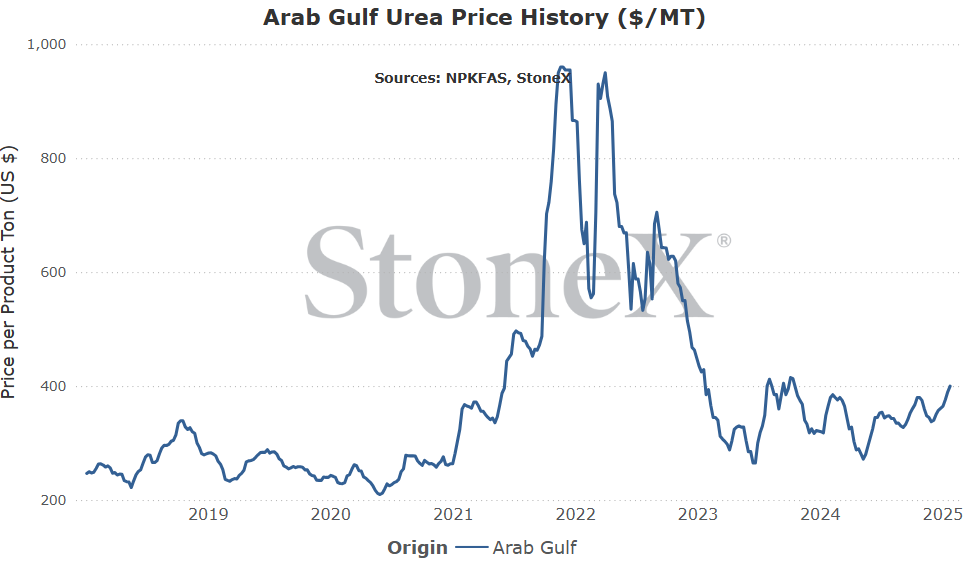
Middle East
Number 1 exporter (as a region, not as individual nations)
Vs 30 days ago - 12% or approximately $43 higher
Vs 90 days ago - 5% or approximately $20 higher
Vs 6 months ago - 15% or approximately $54 higher
Vs 1 year ago - 10% or approximately $35 higher
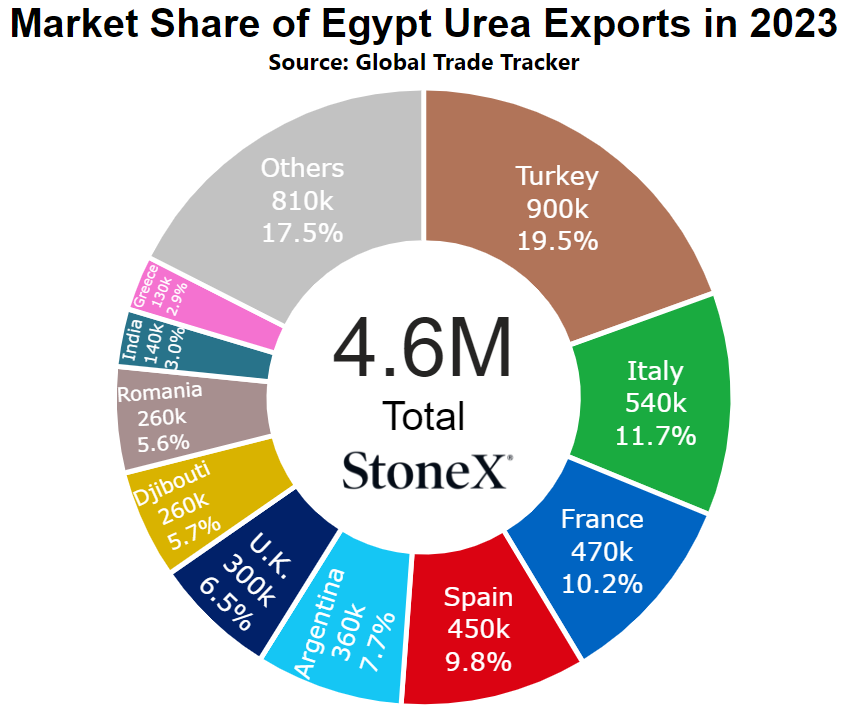
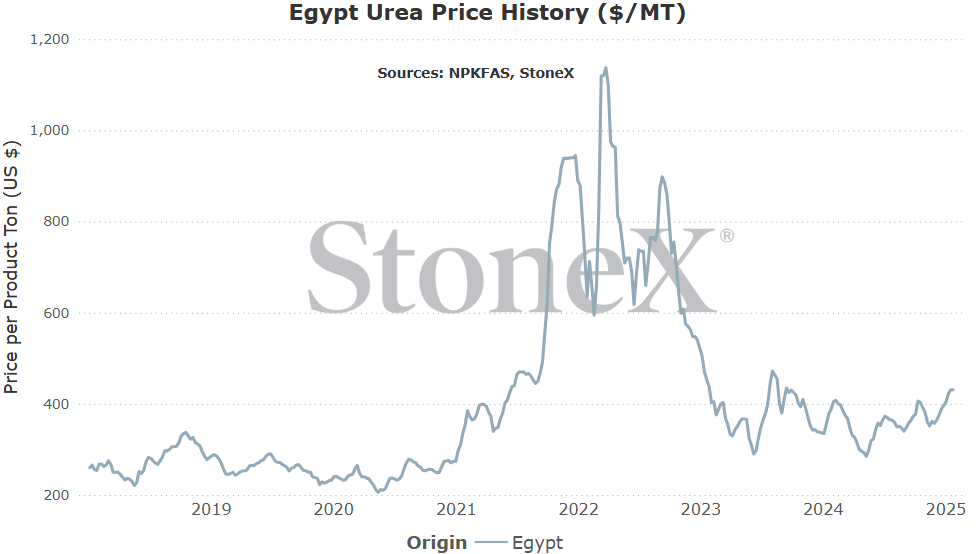
Egypt
Number 4 global exporter in 2022
Price comparisons
Vs 30 days ago - 11% or approximately $43 higher
Vs 90 days ago - 7% or approximately $28 higher
Vs 6 months ago - 18% or approximately $67 higher
Vs 1 year ago - 11% or approximately $44 higher
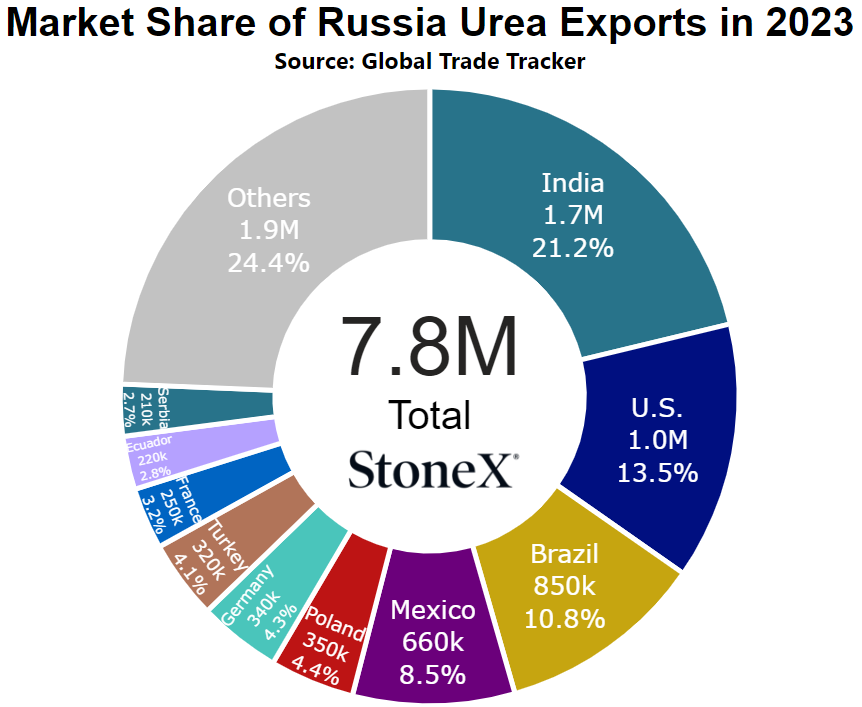
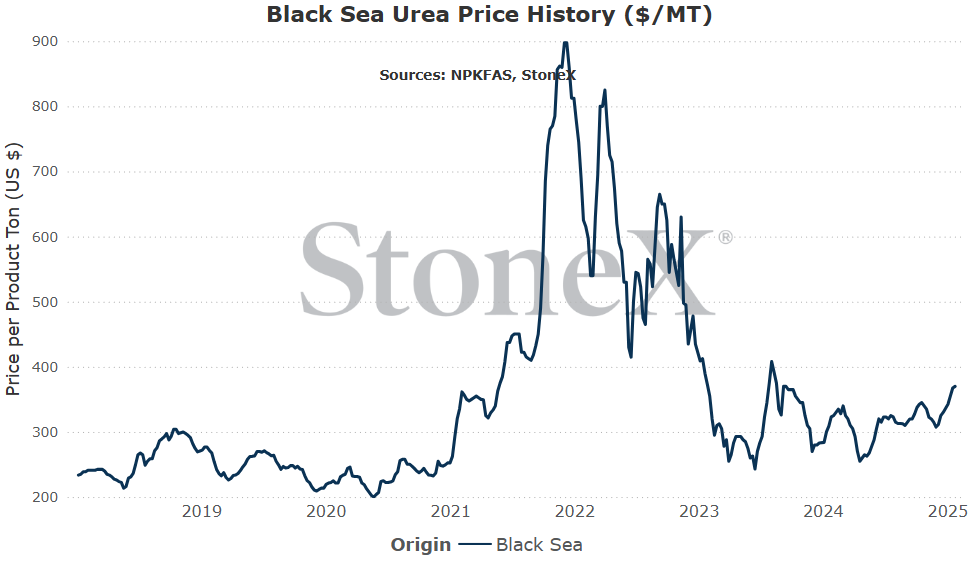
Black Sea
Number 1 global exporter in 2022
Price comparisons
Vs 30 days ago - 12% or approximately $40 higher
Vs 90 days ago - 7% or approximately $25 higher
Vs 6 months ago - 14% or approximately $45 higher
Vs 1 year ago - 15% or approximately $48 higher
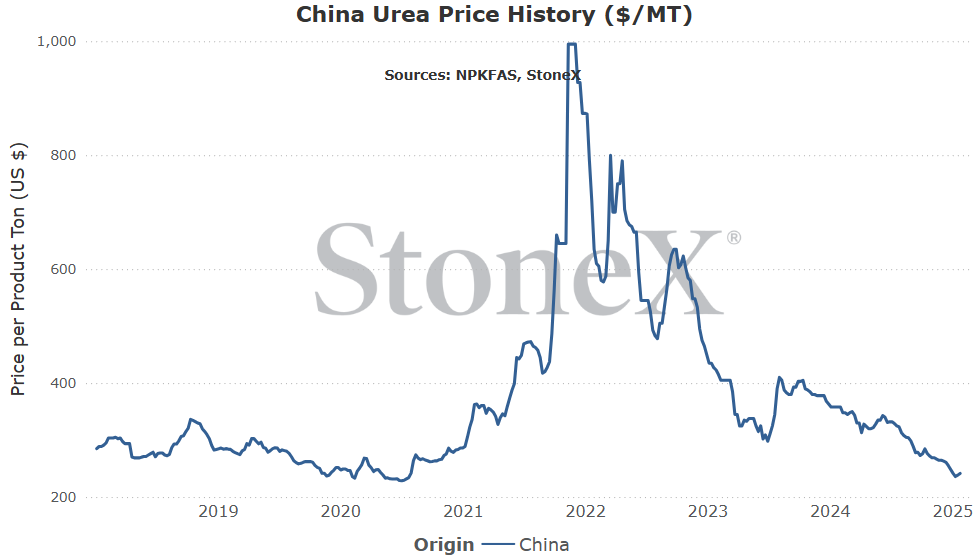
China
Number 9 global exporter in 2022
Price comparisons
Vs 30 days ago - -5% or approximately $14 lower
Vs 90 days ago - -13% or approximately $35 lower
Vs 6 months ago - -26% or approximately $84 lower
Vs 1 year ago - -32% or approximately $116 lower
Brazil
Number 2 global importer in 2022
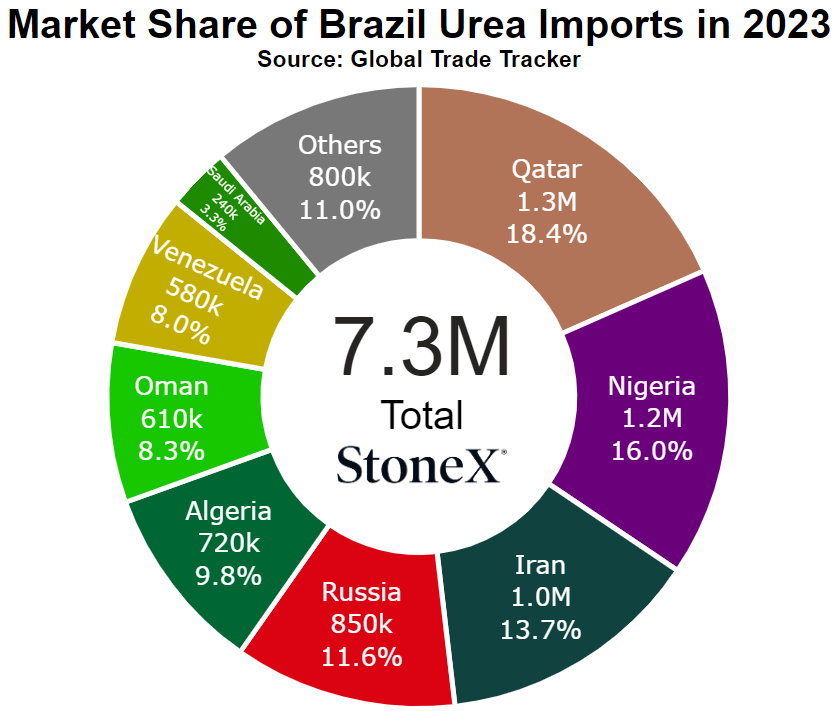
Price comparisons
Vs 30 days ago - 9% or approximately $34 higher
Vs 90 days ago - 3% or approximately $13 higher
Vs 6 months ago - 8% or approximately $30 higher
Vs 1 year ago - 6% or approximately $23 higher
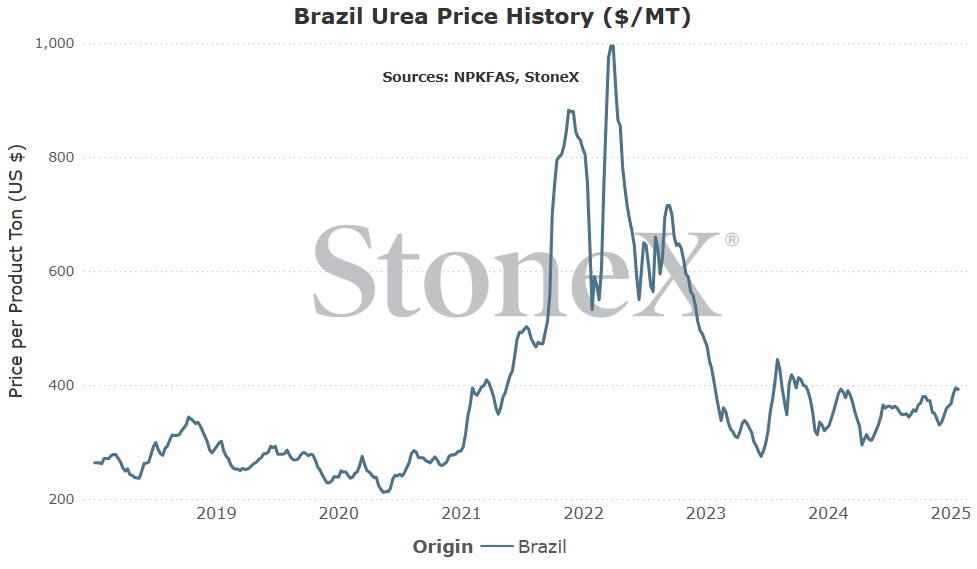
- Chinese exports remain near zero - it is hard for the market to ignore China when they are exporting. They tend to be the global market boogeyman. That also means that when their exports are stopped, the market can run and that is where we are today. China historically represents around 10% of the global urea market. The issue is that there is very little indicating their return. Not impossible, but few signs so far.
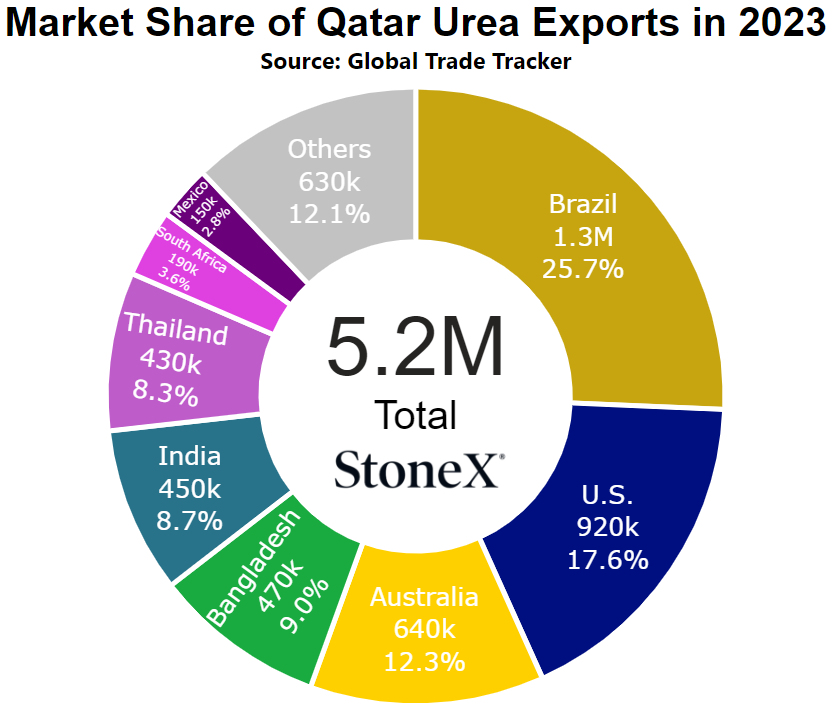
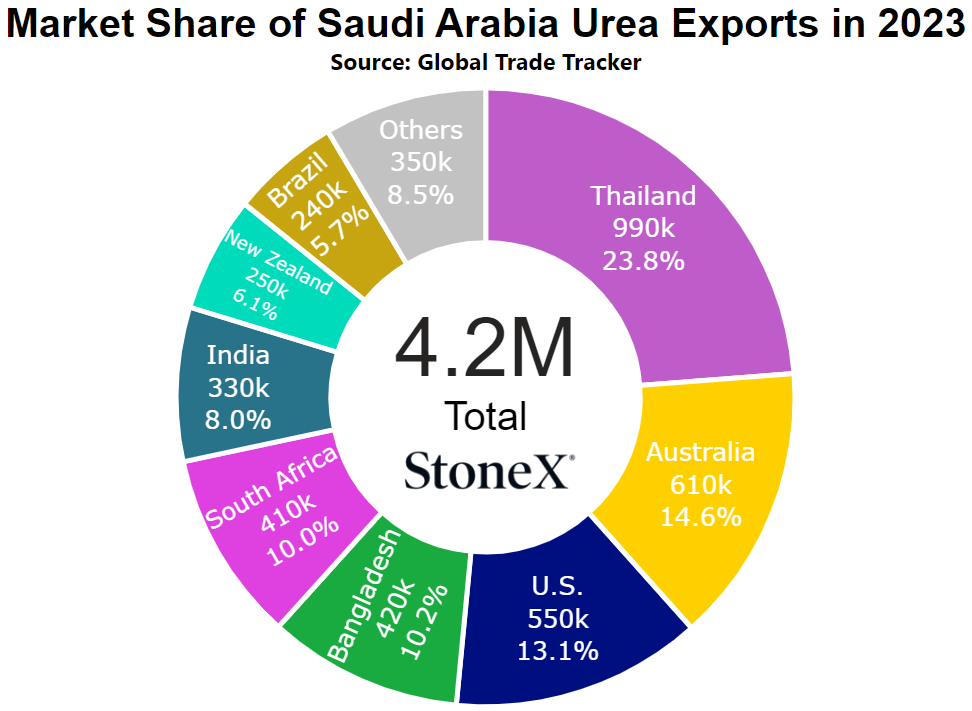
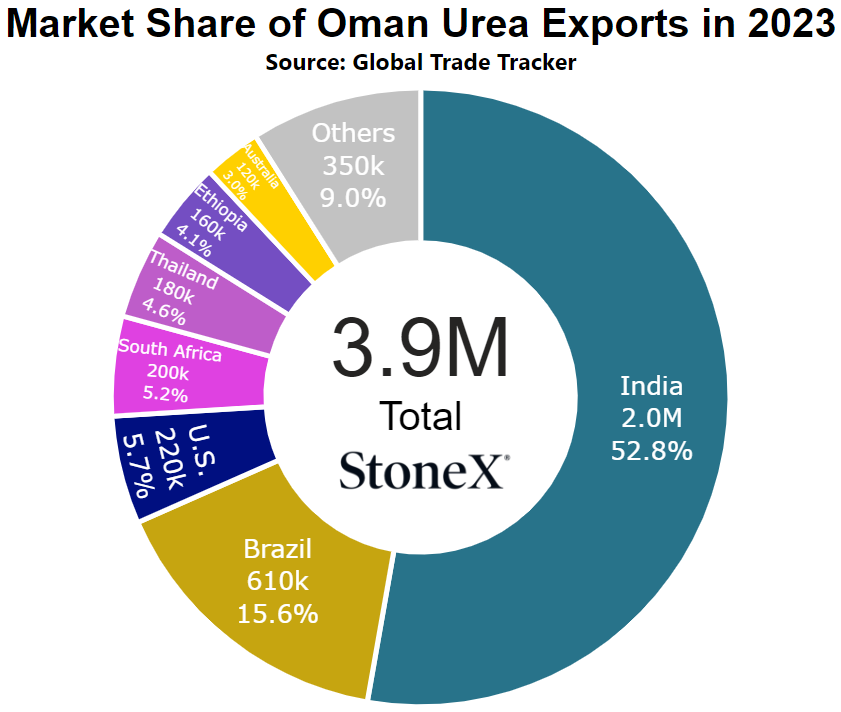
- Iranian production remains offline - years of heavy sanctions has no doubt taken a toll on Iranian infrastructures. That and cooler winter temps which has increased public demand on gas markets have combined to shortages...and nitrogen producers are paying the price by having to stop. This is not expected to be a long term problem, but as long as it is, it is a loss of supply in an already tight supply market. They exported 4.8M tons in 2023, that means 400K tons are lost every 30 days.
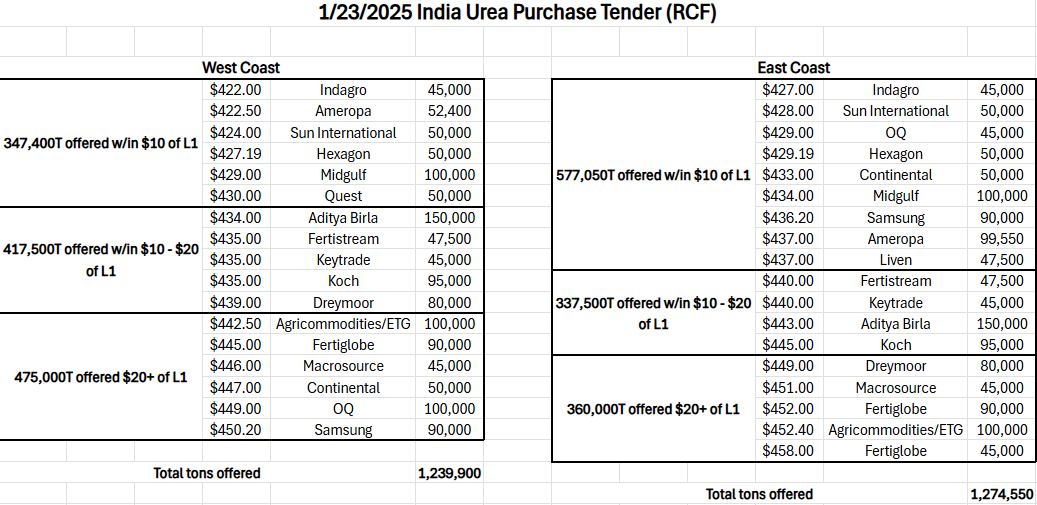
- India wipes out February/early March tons - this is my main concern, especially for the west. It appears that India is going to wipe out most excess inventories in February and the first week of March. So western manufacturers are going to be relatively empty going into March when demand picks up. That is a lethal combination. Imagine what prices will do when big buying meets limited supply...
- Chinese stockpiles are heard to be building to record levels - recently, we have started seeing reports that Chinese urea stockpiles may either be at or above record levels as a result of government export restrictions. The problem is that operating rates are still high. Something has to give. It is possible that producers will be forced to slow production. The other possibility is that the government allows exports to resume which will not be seen as a bullish event globally. Right now, we do not expect exports to resume, but it is back in the realm of possibilities.
- Iran should come back sooner than later - Iran's production being offline is not expected to be a long term situation. This is just due to a short term gas shortage that should go away with repairs/warmer temps. When they come back, the damage will have already been done but fertilizer markets are funny. Sometimes emotion wins the day.
- The focus of the market turns from current tightness to late Q2/Q3 price resents - this is too early in the year for this to happen, but I'm struggling with a 3rd reason for why urea could soften!! Eventually, the market will shift away from demand/supply issues and will start to fear carrying product into the late Q2/Q3 period when values historically hit their low's. Again, this is February. This isn't something I expect in the next month or two, but is certainly in play after that.
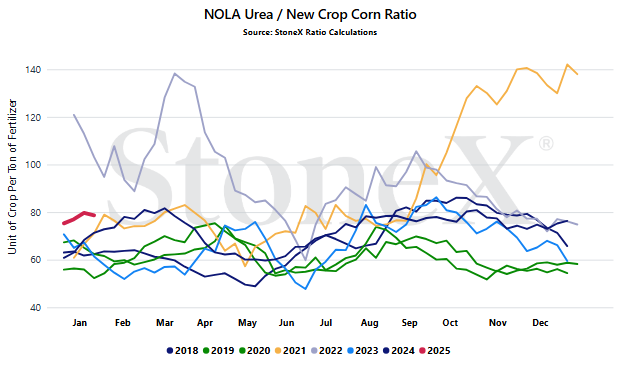
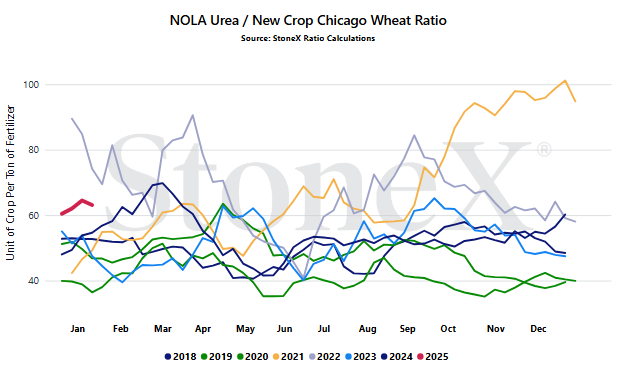
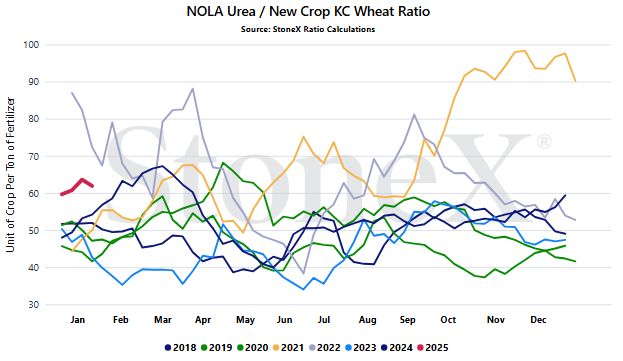
We believe that only looking at the flat price of either grains or fertilizer can be misleading:
- Only selling grain can hurt you if fertilizer prices rise substantially
- Only buying fertilizer can hurt you if grain prices fall
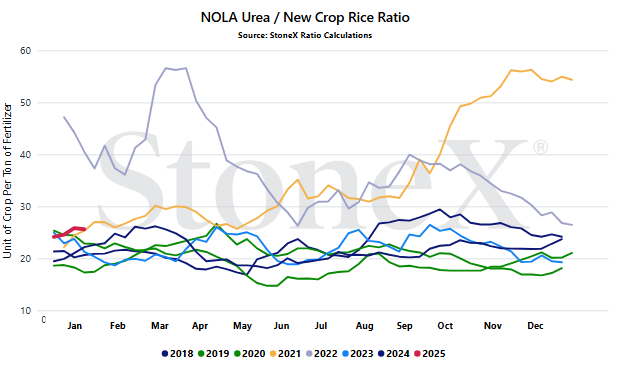
We look at the ratio "value" to get a better indication of where we are or how many bushels of X does it take to pay for 1 ton of fertilizer.
Would you rather:
- Spend 135 bushels to pay for 1 ton of urea
- Spend 55 bushels to pay for 1 ton of urea
When we compare the current ratio value against recent years, we start to see if we are high or low.
YOUR VALUES WILL LOOK DIFFERENT
This graph looks at the NOLA urea price vs the flat grain price. There are no logistics on either product. Your location will look different due to fertilizer logistical costs, grain basis, etc.
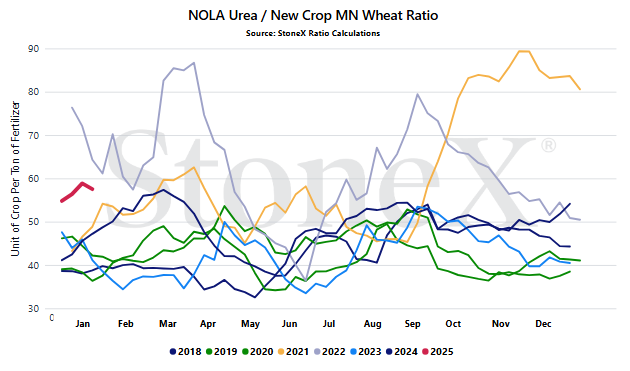
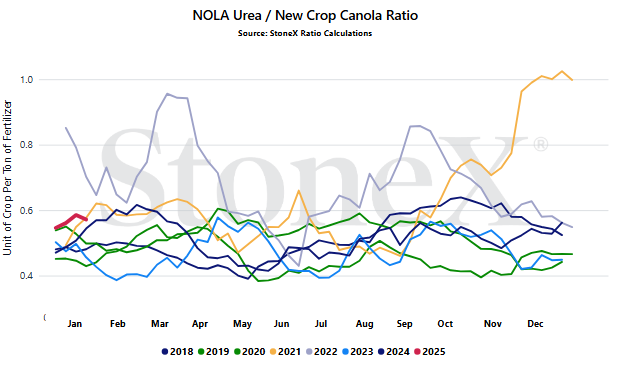
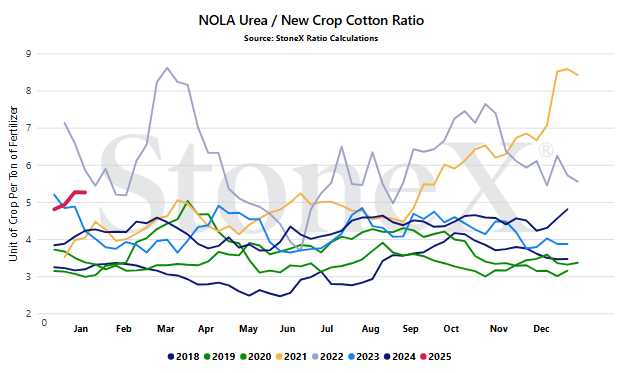
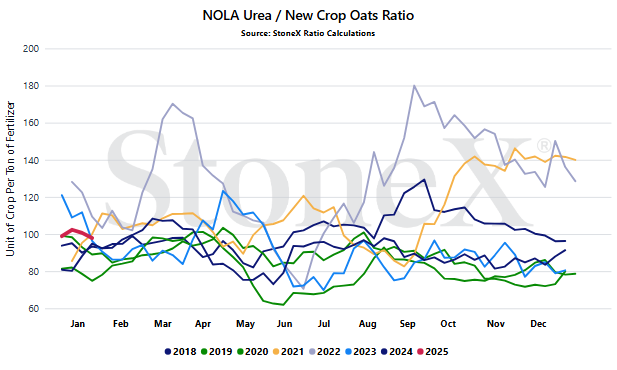
- Iranian production rates/timing - Iranian production going offline, in partnership with the current India urea purchase tender, really helped the urea market find its footing in a bullish way. So if Iran played that part going up, would their return to producing have negative effects? While I do not think so, it needs to be watched because fertilizer emotions are a funny thing.
- Chinese exports flows - Chinese urea markets are at a crossroads. On the one hand, the governments strategy has worked. By lowering exports, domestic stockpiles are near or above record levels and domestic prices are some of the cheapest in the world. On the other hand, with stockpiles so high, they either need to start exporting or lower production rates. If exports begin, the immediate global S&D effect wouldn't be huge, but there is little way to describe the emotional damage. We do not expect them to return, but never say never.
- How spring buyers react to India locking up February/early March shipments - at this point, it is fair to believe that the western global urea market will be tightly supplied thru to the first part of March. India should lock everything up. That means that countries needing supplies for their spring season will all be competing for March ship tonnages. You know manufacturers will take advantage of this...
- Growing N.A. demand - we were in a bad place before. Imports of urea were lagging the 3-year average and the NOLA price continuing to be a discount to Middle East replacement values meant very few spot cargoes were heading this way. Well, now we are dealing with a situation where global supplies are even more snug and N.A. demand is growing with increasing corn acres. That is a bad combination...
StoneX Ratio Calculation
The ratio calculation is derived from Bloomberg historical grains values as well as fertilizer values from StoneX, NPKFAS, and Argus.
The calculation is simply dividing the fertilizer price by each grain price.
All data was sourced from StoneX unless otherwise noted.




