February '26 NH3/Anhydrous Ammonia
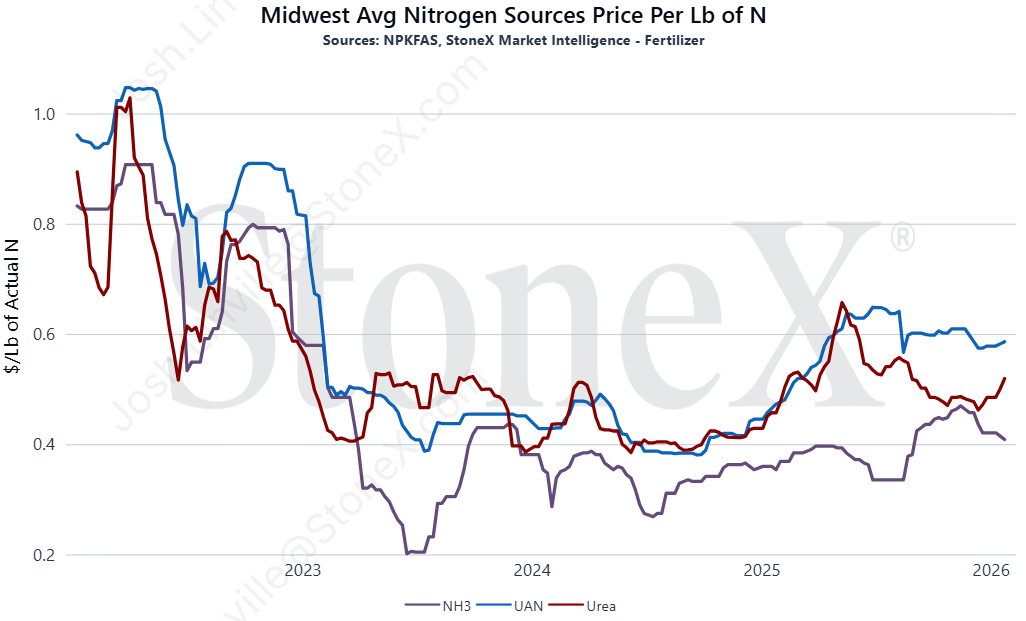
U.S. MIDWEST/TAMPA PRICE GRAPH
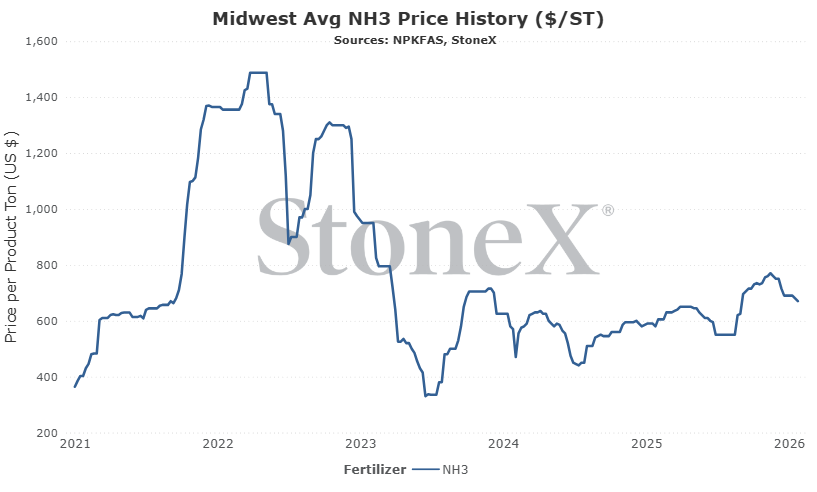
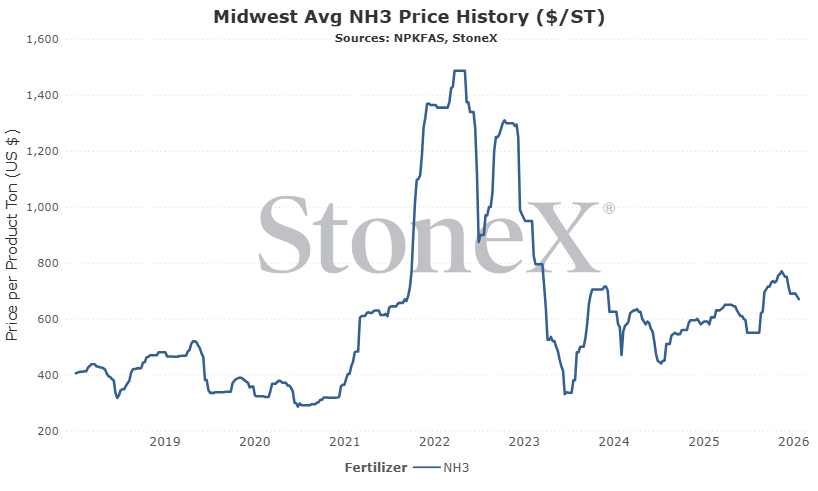
The first graph is the AVERAGE of the entire Midwest U.S. region. That means your local value WILL be different than what the graph reflects. Please do not take this into your retailer and say "why isn't my price the same as here". That is comparing apples to oranges. You might be on the cheaper or more expensive side of this graph. This doesn't take into account logistics/storage/interest/insurance/shrink/etc.
This graph looks at the price from a short ton and USD currency POV.
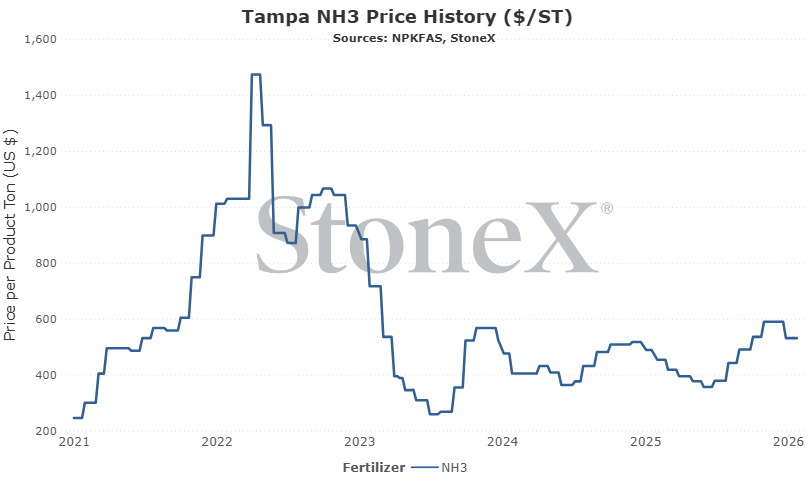
This second graph looks at the price set for Tampa NH3. This value does not have a high correlation to Midwest values. It is a talking point used when prices are rallying...yet somehow gets skipped on the way down. This price is more an indication of the global price. This price is set by two parties (purchaser - phosphate producer in Florida / seller - international producer providing NH3 to FL phosphate production).
This graph CAN be used as an indication of global market price direction/trends. This graph SHOULD NOT be used to determine a Midwest value. Tonnage is listed in short ton and currency in USD.
What everyone wants to know first, what do we think will happen going forward
Global
There are still a lot of production/supply issues around the world:
- Russia exports continue to struggle with the Ukraine invasion ongoing
- Iran's production rates have plummeted with ongoing domestic issues
- Trinidad production rates remain low due to gas supply problems
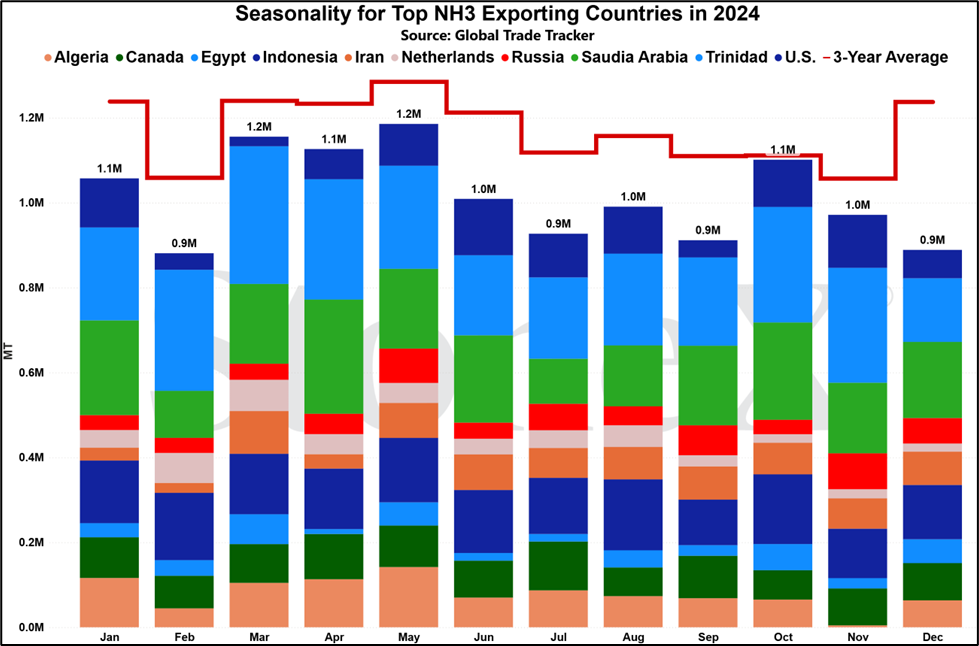
There are other issues out there, but that spells a pretty drastic story for 3 of the 10 largest NH3 exporting nations in the world. The February Tampa NH3 price was set at a $40 premium to January which helps back the global supply issue globally.
Current global NH3 values remain very high. I will not be surprised to see weekly/monthly volatility up and down. However, as long as that list remains, global NH3 prices are going to remain extremely high.
However, if one or more of those start to improve, watch out.
North America
The global outlook remains high priced, so why wouldn't domestic Midwest values do the same?
Even if global values would have fallen again for the Tampa price, I do not think it would have made any difference. We are still looking at big spring demand on healthy 2026 corn acres. The artic temps have had a slight impact on production rates. Ultimately, time is almost gone. There is only 30 - 45 days before widespread preplant applications begin across North America. I know this. You know this. Most importantly...manufacturers/distributors know this.
It would take an enormous event to cause inland values to fall substantially from where they are today. Manufacturers are in the drivers seat with a mere 4 - 6 weeks before spring applications begin.
Could weather cut the knees out of spring demand? Yes...but that will not be known until it is too late.
General Global NH3 Information
What has happened in the last 30 days?
Hopes of European nitrogen production restarting fade
This.
This is why I do not let my hopes rise.
Last month, I was getting excited at the albeit small prospect that we could start seeing offline European nitrogen plants beginning restart procedures. Gas values were continuing to fall. The CBAM implementation could have meant higher domestic Europe nitrogen fertilizer prices which would help solve the economic piece of the puzzle.
I guess small hopes are at least easier to kill.
In the last few weeks, we have watched gas values rise and uncertainty rise regarding the CBAM situation.
For gas values, we had seen Dutch TTF values dipping to the upper $8/lower $9 MMbtu price range. This was seen across all forward months and while they still represented higher than historically normal prices, they were MUCH better than what had been seen in recent months/years. With gas values lower, that helped to reduce the cost of production for domestic nitrogen manufacturers and I was hopeful this would lead to restarts.
Then, the CBAM story. We had learned what the rates would be for imported NH3 and they were high. Very high. Like tariff effects around the world, we expect that the end result will be higher domestic European nitrogen values. The struggle to find unaffected origin points had pointed to a hope that they would restart more reliable domestic plants.
Today, both of those are different.
Gas values have risen. A quick jump from an average $9MMbtu to a current $13+ for nearby months mean that economically speaking, it likely makes little sense to restart any plants.
Then the CBAM story. There are still a lot of questions in my mind, but we are starting to find out that it is likely that tons from new green facilities will be able to bring tons free and clear. Suddenly, the need for domestic tonnage has lessened.
All of this to say that my hopes of higher European production rates are all but gone again. A return would have boosted global supplies and helped remove "unnatural" demand from the marketplace...a great recipe to help lower global values.
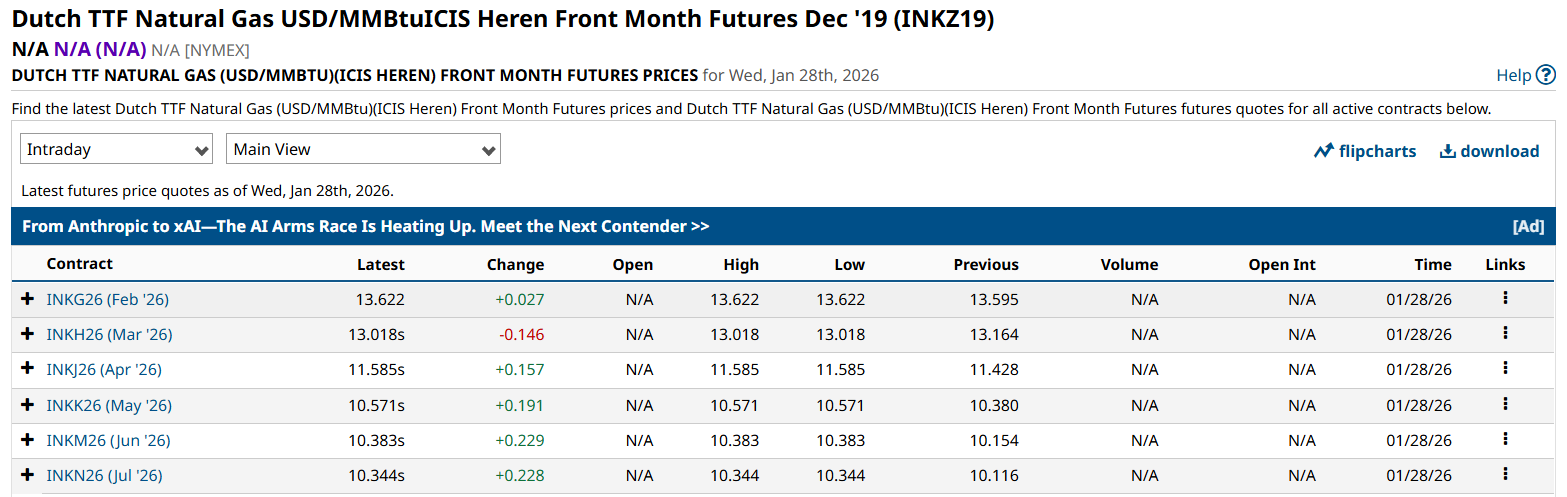
Source: www.barchart.com
Global supplies continue to suffer across multiple nations/regions
More of the same regarding global NH3 exports/supplies. I know many of you have read this over and over again but for those that are new, it is important to get everyone onto the same page.
There are multiple major NH3 manufacturers/exporters that are having supply issues today.
Russia
Historically speaking, Russia is the world's largest NH3 exporter. It makes sense given their natural resources and an economy highly reliant on those exports. Up until 2021, they were the world's largest with around 4.4M tons...however, their NH3 economy got the find out part of FAFO following the Ukraine invasion.
Over the years, Russia was highly reliant on Ukraine to export their NH3. Russia would produce the tons in their country and then inject the tons into a pipeline (very similar to the one here in the Eastern Cornbelt of the U.S.) that ran through the east/south of Ukraine, ended in the Odessa region. From there, they would unload NH3 from the pipe and into storage where it would eventually be transferred to vessels that sailed it around the world.
It turns out that when you invade a country, they are not keen on doing business with you.
Very quickly, that pipeline was shut down and Russia lost their export capabilities.
They have worked to move tons through their Ust-Luga facilities (near St. Petersburg). They have also built an export facility in Taman and it appears to be ready to work. However, Russia is approaching this cautiously. Ukraine has become very good at striking Russian targets in Russian territory. In recent weeks, Ukraine successfully struck an oil facility in the...you guessed it...Taman region. Imagine the environmental/public devastation if a major storage facility was attacked and caused a full release. Better to keep the facility offline until the war is over...whenever that will be.
Trinidad
Another major manufacturer and exporter that has been struggling. Trinidad's natural gas supplies have been suffering to the point that nitrogen manufacturers have had to reduce or fully stop production. While this has happened from time to time in the past, it appears this recent situation has had longer term effects on production with one company completely shutting down their plants.
There is hope on the horizon as they have approved the research and development of previously untouched territorial waters. Unfortunately, those waters are near Venezuela who has seen its share of turmoil recently.
All this to say that Trinidad is no longer a reliable supplier like they have been in the past and these efforts to increase gas supplies/NH3 production will take time.
Iran
Many folks like to discount any talks of Iranian production and supplies. As one of the more sanctioned countries in the world, many in the market cannot do business with them so why would they matter?
Well, whether you do business with a country or not, their exported tons move the S&D of the world...and Iran has been struggling
Before the recent uprising against the government, production of nitrogen was struggling due to gas supplies. It started as a typical winter drawdown. When temperatures fall, they need to move limited gas supplies to the public for heating homes. However, it has extended from that and appears to be a longer term issue.
Then the uprising. The people of Iran are protesting the current government and demanding them to step down and allow a new generation of leaders. The current leaders did not take this lightly and it has been widely reported that lethal force was used to disrupt the protests. This approach was not taken lightly by western nations. President Trump has actually taken a step forward and has started moving naval forces into the region to put pressure on the government. Take a read through the article link below. Traffic in the Persian Gulf has slowed due to this build up. Even if Iranian nitrogen production was running at full steam, it looks like they would be struggling to get the tons shipped out.
https://www.foxnews.com/world/global-shipping-grinds-halt-near-iran-us-…
In conclusion, the global NH3 market has a lot of problems with some very big names/countries. As long as these issues continue, NH3 prices are going to be a hefty premium to what used to be considered "normal". However, things can change. If we suddenly see improvement in one or more of these countries, no doubt sellers will run for the hills and prices will react accordingly.
Persian Gulf tension could have big NH3 impact in worst case scenario
The Trump administration has been ratcheting tensions higher in the Persian Gulf region as it continues to keep pressure on the Iranian government following their lethal measures against the domestic uprising.
The world watched as the people of Iran rose up against the Iranian government. While these protests have been seen before, they continue to grow in size and in influence. This one felt different (my uneducated outside looking in perspective, of course). This one appeared to put a lot of pressure on the Iranian government which pushed them far enough to retaliate with lethal force. While actual numbers in terms of arrests and fatalities are cloudy given the governments work to shut down the internet and largely not discuss the matter, it has been rumored to be in the thousands.
It appears that the Trump administration is not announcing a red line and then ignoring that red line.
It looks like the USS Abraham Lincoln carrier strike force is making its way to the Persian Gulf with the goal to at the very least apply pressure to the Iranian government or at most to physically begin attacking government targets.
As a precautionary measure, shipping in the Persian Gulf has slowed significantly as carriers wait to see how this operation will play out. As the article link below discusses, the few vessels that have moved through the Strait of Hormuz received threats/warnings from Iran. During these situations, the world watches oil shipments/markets very closely and why wouldn't it given how important Middle Eastern oil supplies are to global markets. However, there is a large amount of NH3 that also flows through the waterway.
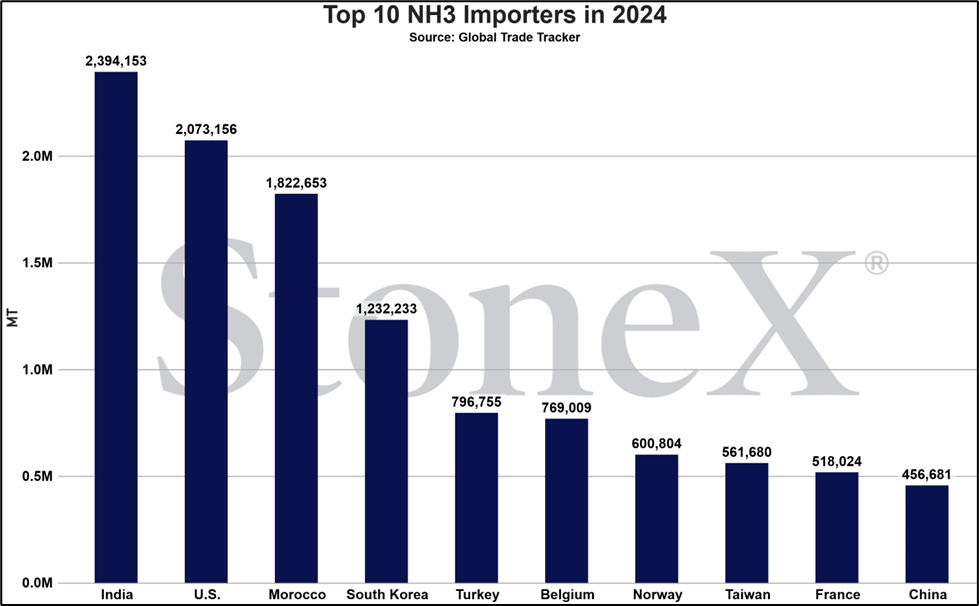
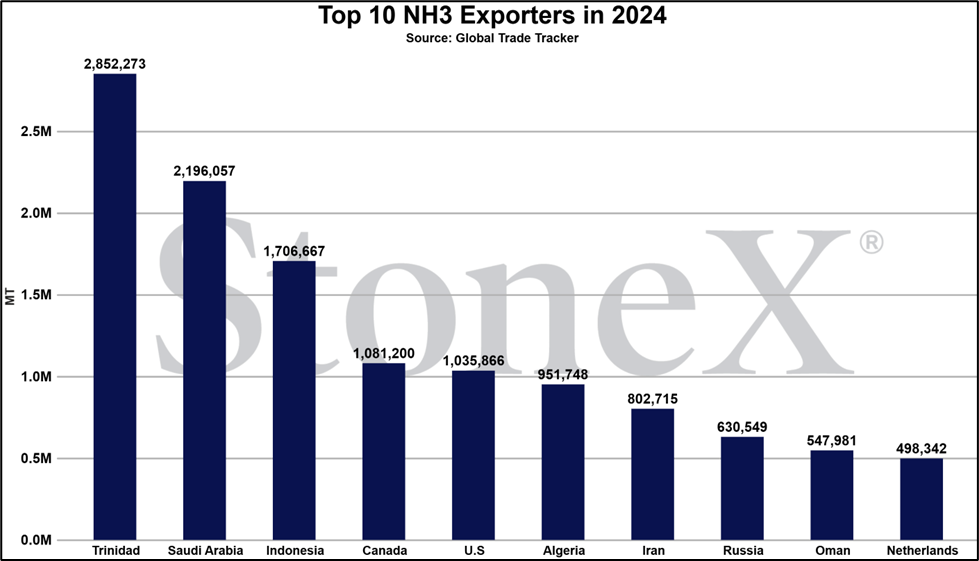
- Saudi Arabia - world's 2nd largest exporter at 2.2M in 2024
- Iran - world's 7th largest exporter at 800K in 2024
- Oman - world's 9th largest exporter at 550K in 2024
So far, this story has largely centered around pressure and threats. No physical attacks have been seen or heard (at least I haven't as of this writing. However, if we suddenly start to see actual military action either from the U.S. against Iranian targets or by Iran on vessel targets transiting the Strait of Hormuz, the world will focus on oil...but we need to focus on the effects on NH3.
https://www.foxnews.com/world/global-shipping-grinds-halt-near-iran-us-…
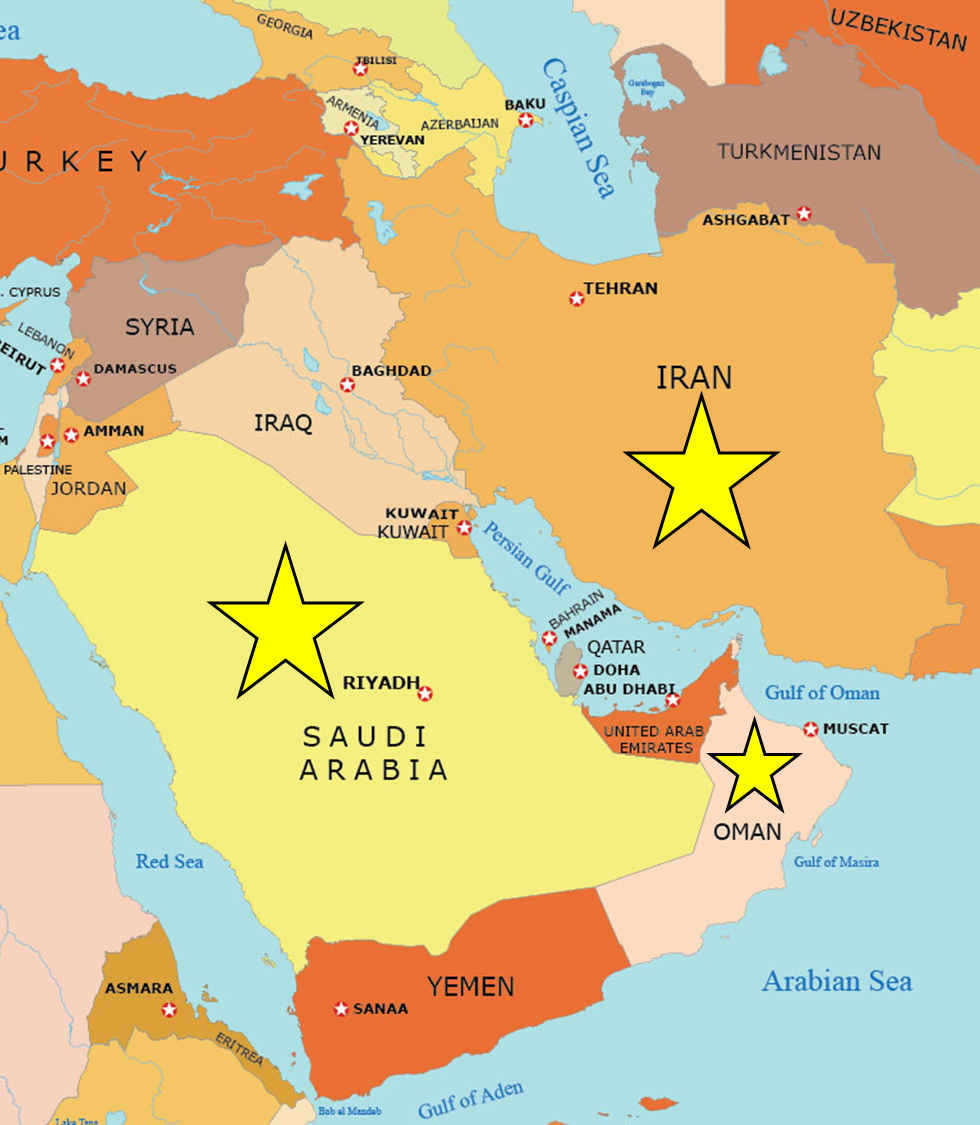
Source: www.gisgeography.com
Tampa NH3 prices rallies $40 on tight global supplies and continued demand
Well, we will always have the January price that dropped $65!!!
The Tampa February NH3 price, a value which we use as a great indicator for global pricing, was announced at a $40 increase vs January pricing. Production hiccups and political disruptions became too much to usher in a 2nd weak price month.
My hope had been that if we had seen February lower still, we could start to see that place some bearishness on inland Midwest pricing. When Tampa/global values rise, sellers love to talk about it. If global prices are moving higher, then domestic values need to rally with it or risk XYZ reason. However, when Tampa/global values turn bearish, it suddenly becomes less of a story. It typically takes a few months of price weakness before inland values start to follow...if they do at all.
Unfortunately, even if February was lower, it was going to be hard to drop inland prices substantially. First, expected demand is still very big. We continue to use a "conservative" 93M acres of corn. Second, the calendar is working against us. It is cold outside. There is snow on the ground. Winter feels like it just started, but we are a mere 30 - 45 days from the start of spring preplant NH3 application. That means the sell side of the market only has to wait 30 - 45 days until demand is effectively forced to step forward and they get the price they want. Third, NH3 is already the better priced nitrogen product. When looking at the price vs grain values, it is high. However, when compared to urea and UAN, NH3 is sitting at a slightly larger discount than "normal".
All of this to say that the February Tampa price jumped higher which basically removed one of the last remaining potential bear events before preplant demand steps forward.
N.A. NH3 market remains high priced, unlikely to change before spring
I thought about just tying this story into the one above, but thought it was important enough to leave on its own.
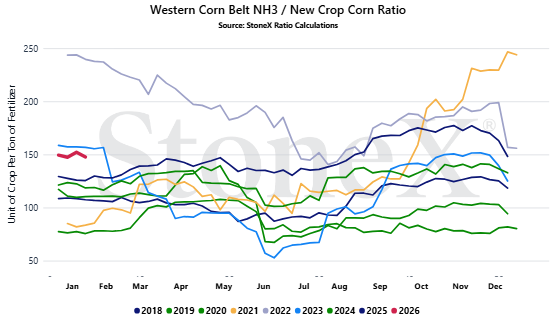
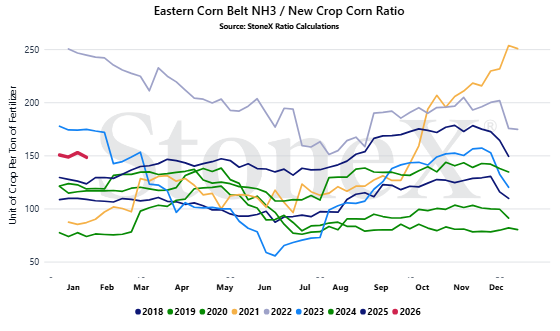
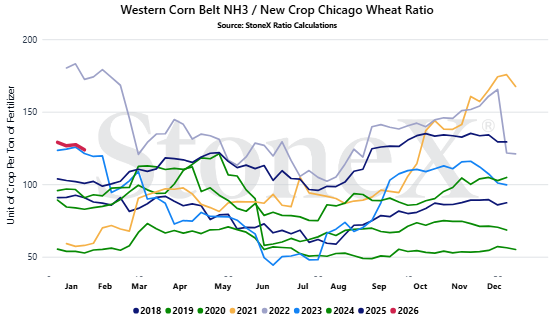
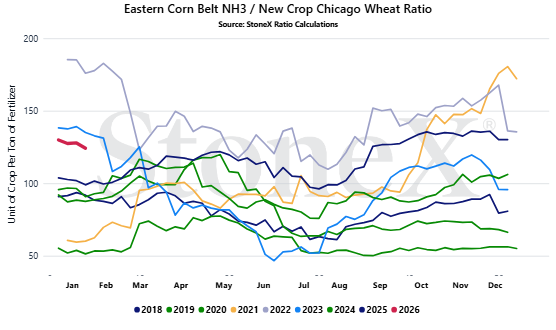
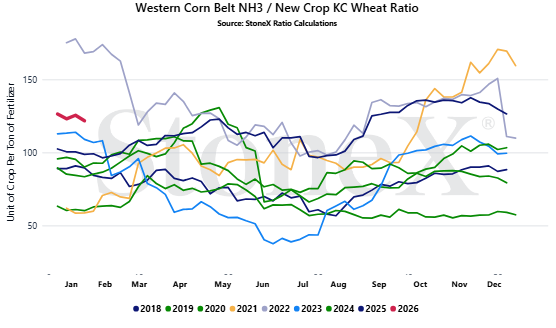
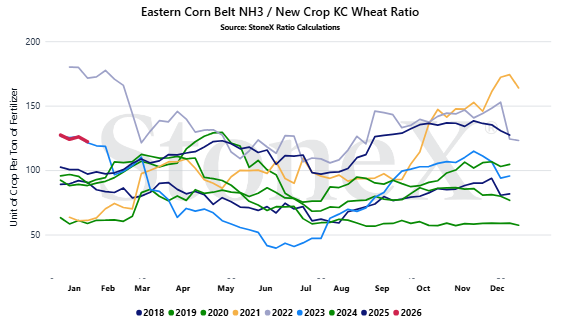
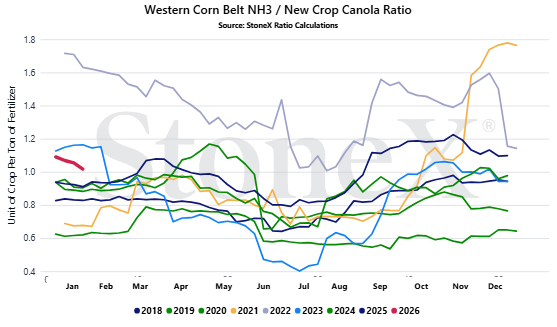
When looking at the current NH3 marketplace, there are a lot of things working for it in terms of flat to higher prices. Does that make current values "good" for farmers? No, not really. Take a peek at the ratio graphs below. When looking at current values vs corn prices, we are the 3rd highest/bad ratio since 2018. I actually updated the graph to grab all the weeks/values that we have which goes back to 2012. For that time series, this is the 4th highest/worst ratio that we have. With the price outlook for NH3 continuing to be steady to higher and there not being much hope for higher corn prices, it feels like a matter of weeks before we become the 2nd highest for that period of the year.
Past that viewpoint, NH3 actually looks supported:
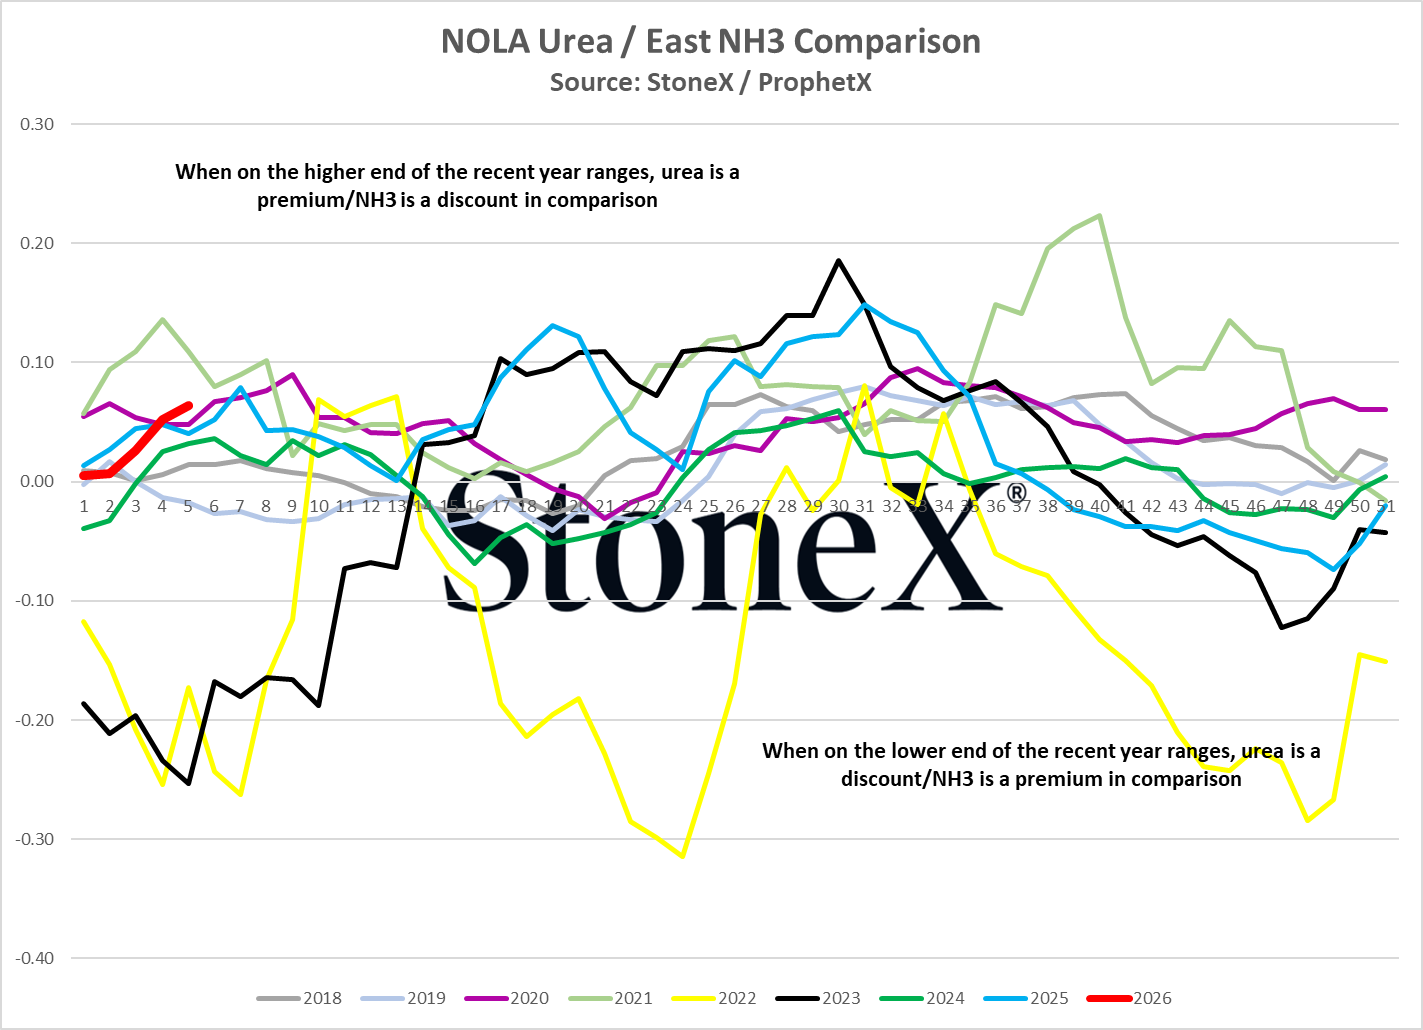
- Current NH3 values are good vs urea
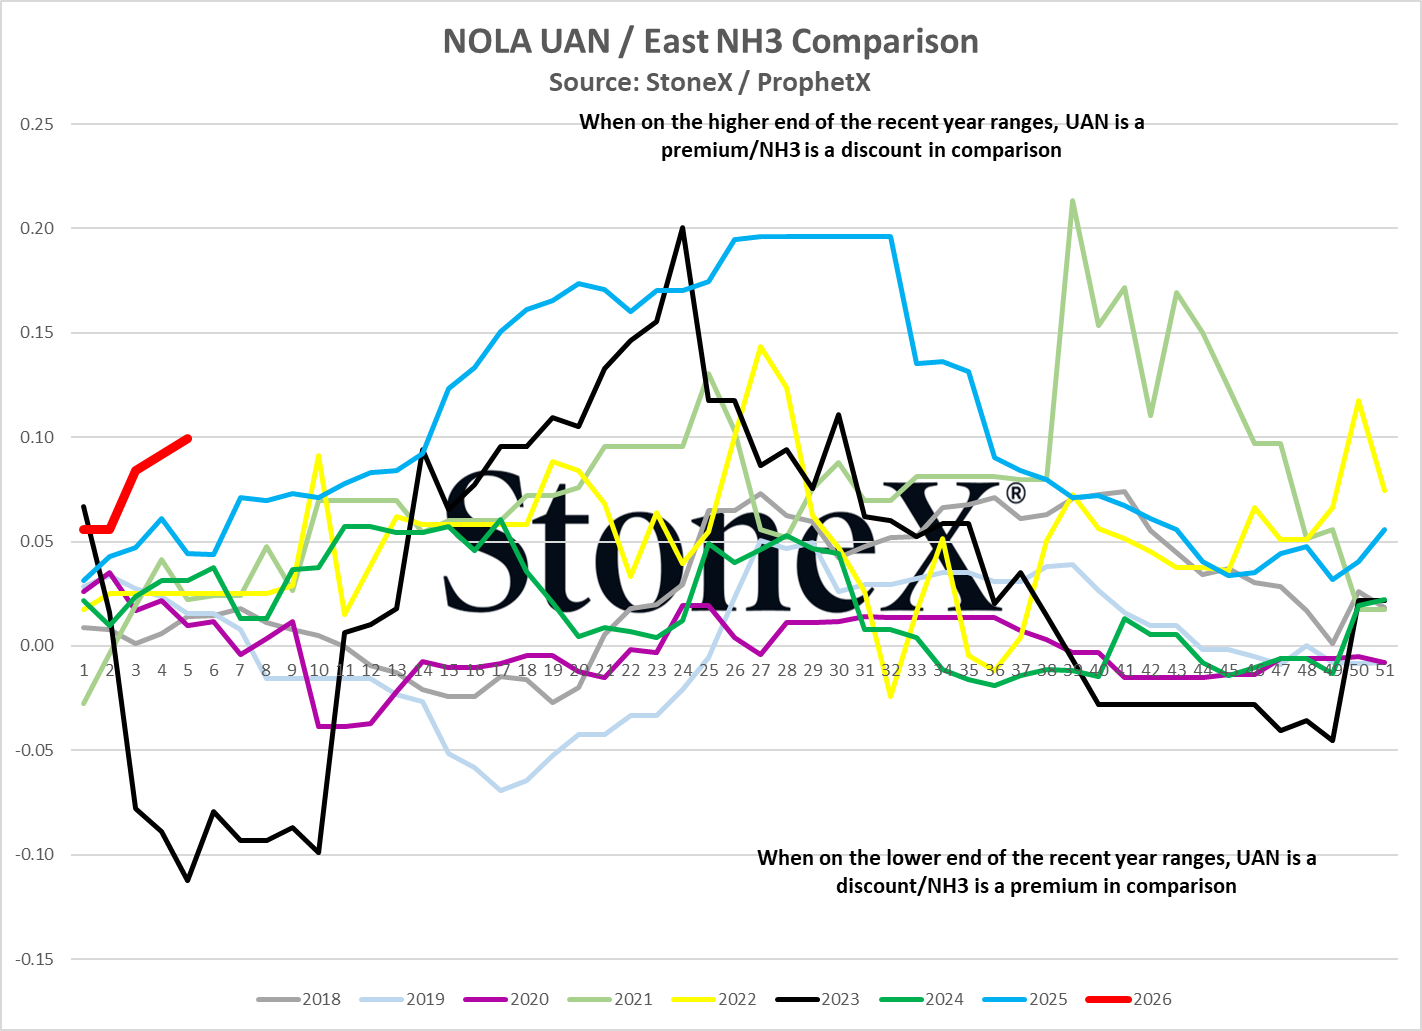
- Current NH3 values are great vs UAN
That, in addition to strong global NH3 values, is where I get worried.
The price difference between NH3 and urea points demand toward urea, but not in a major way. The current price per pound of actual N spread points demand to NH3, but not in a massive way for this time of year. However, the price difference between NH3 and UAN is SCREAMING at demand to consider a change. Check the 2nd graph below. The price differential between the products is the highest (UAN premium) that we have seen in recent years for this time of year. For farmers that can readily switch between the nitrogen sources, there should be a sizeable cost savings by pulling the toolbar across a few more acres of land.
That is where price support could come from for NH3. With that kind of savings theoretically being out there (this uses Midwest averages so your local numbers may or may not show similar), farmers are being rewarded for pushing harder to apply NH3. If/when that demand is seen in the NH3 market, then that starts to boost price ideas.
Of course, all of this is dependent on weather.
Keep in mind that right now, it is cold and winter feels like it just started. However, we are a mere 30 - 45 days from the start of preplant NH3 applications. Time is not on our side. Time is on the side of the suppliers. If/when demand starts to show up, I will not be surprised to see that price difference close...and I do not expect to see the correction from the UAN market.
N.A. markets take a hit with prolonged cold temps hitting gas values/supplies
For North America, winter showed up in a big way and that had an impact on domestic nitrogen production...at least from an emotional/market talking point POV.
Artic temperatures have been plunging deep into the south of the U.S. What happens when temperatures fall? The population burns gas to heat their homes. What happens when unnatural population demand pops up? Gas values start to spike. What happens if gas values spike enough? Production lines that are highly reliant on gas start to slow/stop production.
Guess what uses gas as a major input...
The big talking point of the North American nitrogen market in late January was production impacts due to the cold. There is some truth as well as a lot of liberties taken with this storyline.
First, the liberties:
Years ago (I think 2021), there was a massive cold wave that had deep freezes getting to the U.S./Mexican border. That event was large enough that a lot of domestic nitrogen production went offline as gas supplies were pushed to the public. It had a major impact on expected produced nitrogen supplies and acted as a solid bull event right before spring season.
This cold has been rough...but not the same effect. To date, we have only heard of one plant that only went down for a short time. Other plants may reduced their production rates, but again it was for a short time. It appears the supply effect was not nearly what the market tried to make it out to be.
Now, the realities:
It is right to wonder why plants would reduce or stop production in this event. Those companies are likely smart enough to secure/hedge their gas needs ahead of time so if the price spikes, they can continue production with no impact.
Let's assume that is the case for all nitrogen and that they secured all their winter needs ahead of time. You are right to think that they could continue producing with no impact...but what if producing fertilizer out of that gas is not the most profitable path forward? If the price spikes enough, selling those contracts/supplies back to the market could make a lot more money than making a few more tons of fertilizer. At the end of the day, these companies are making fertilizer to make money, not friends.
All to say that the cold has had an impact on nitrogen markets, I just do not think it is as big an impact as some make it out to be. It feels like it was a great story to kill time in an otherwise slow time of the year. Unfortunately for fertilizer, sometimes that is all it takes.
Where are current values in relation to the past
U.S. Midwest Wholesale price average
Vs 30 days ago - -3% or approximately $20 lower
Vs 90 days ago - -9% or approximately $65 lower
Vs 6 months ago - 22% or approximately $120 higher
Vs 1 year ago - 11% or approximately $65 higher
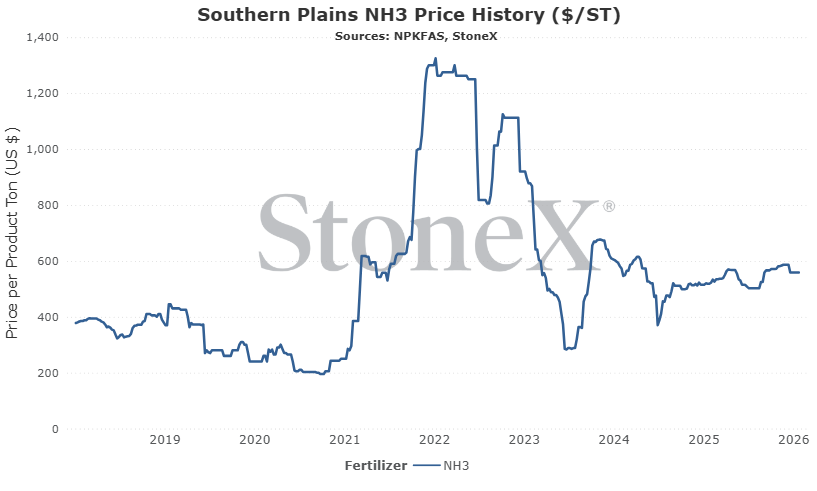
U.S. Southern Plains price average
Vs 30 days ago - unchanged vs a month earlier
Vs 90 days ago - -2% or approximately $14 lower
Vs 6 months ago - 11% or approximately $57 higher
Vs 1 year ago - 7% or approximately $37 higher
Bull/Bear Factors
Because no market is ever guaranteed to go higher/lower, we try to consider the factors that can sway values so that we are able to act when they occur rather than react.
- Bullish Factors
- Russian exports remain very low due to ongoing invasion of Ukraine – it has been incredibly difficult for Russia to export anything close to their normal volumes. They lost their export pipeline that ran through Ukraine and out to the world. Their Taman facility appears ready to go, but who would chance filling it with NH3 just for it to be attacked by Ukraine. Issue after issue has kept Ust-Luga from flowing heavy volumes. If the war continues, it appears the world will remain without its largest supplier.
- European production remains at 75%, leaving gaping supply hole – there was a short time when I was starting to believe that Europe’s 25% offline nitrogen production could restart. It was a long shot, but it was improving. Now, we do not know what the CBAM will be like. We are watching gas values rise. It seems like we took one step forward…and 2 steps back. If they remain at 75% of normal, it reduces global supply and pushes European buying into the global complex.
- Wide open spring weather window allows for solid applications – right now, it is hard to see North American having a wide-open March and early April. At least here in Kansas City, we got a heavy snow, and the longer-range forecast continues to point to more bitter cold…but that can change in a hurry. The snow means we have some soil moisture. The demand should be there. If mother nature plays nice and North America has a solid run, that would likely boost price ideas.
- Bearish Factors
- Peace between Russia/Ukraine could usher Russian exports back to the market – I know how incredibly small a chance this is…but we must watch it. If there was an unexpected peace, that could pave a quick route to Russia exporting more product. They could more confidently start their Taman facility. They may have more luck with their Ust-Luga facility. It does not seem to have a lot of chances but even a small chance of the world’s largest exporter returning needs to be watched.
- Poor N.A. spring weather window/high prices keeps farmers out of fields – today, with the snow cover and bitter cold temps, a poor spring application window for NH3 feels more likely. Things can change…but maybe they do not. If mother nature keeps conditions poor for NH3 application through much of March, farmers will be forced to decide between applying NH3 or planting seed. For many, that wouldn’t be a choice. Get the seed in the ground and do another N form later. That would devastate NH3 demand.
- EU CBAM situation accidentally helps European production restart – this is looking like a very low probability today, but it still needs to be watched due to its probable impact on all nitrogen products. If the CBAM is put into place and it raises domestic values enough, it could be the last straw and offline facilities may restart. That would boost global supplies and lower demand.
Where are the current NH3/grain ratio values today
We believe that only looking at the flat price of either grains or fertilizer can be misleading:
We look at the ratio "value" to get a better indication of where we are or how many bushels of X does it take to pay for 1 ton of fertilizer.
Would you rather:
When we compare the current ratio value against recent years, we start to see if we are high or low.
YOUR VALUES MAY LOOK DIFFERENT
This graph looks at the NOLA NH3 price vs the flat grain price. There are no logistics on either product. Your location will look different due to fertilizer logistical costs, grain basis, etc.
- Josh Linville’s Focal Points
- Any peace between Russia/Ukraine...or any escalation between the nations - yep, another month of me discussing Russia and Ukraine. Yes, Russia used to be the largest global NH3 exporter. Yes, they fell almost off the global top 10 exporters following their invasion. Yes, we think the facilities could be operational but why would they while Ukraine continues to successfully attack targets within Russia. If peace is found, we could find ourselves in a situation where prices start to plummet with Russian tons returning....even though that still seems SO far off. It isn't impossible so we continue to watch.
- Iran's uprising, does anyone else step in an attack gas infrastructure? - Iran is a global top 10 NH3 exporter so what is happening there matter. If Iran's production continues to struggle as it has, it limits global supplies. Worse, if other nations start to intervene and decide a strategy is to destroy their gas fields, we could see Iranian production lost for a very long time. Iran matters, even if a lot of the world will not do business directly with them.
- Trinidad production rates (tied relatively closely to Venezuelan stories) - Trinidad is not only a global S&D problem with their production rates suffering, it is worse for North American direct applicators given that a lot of the imports come from there. There is hope on the horizon that production improvements may come down the road, but how long is that road? The longer they have issues, the more easy it is for domestic manufacturers/distributors to justify higher prices.
- EU CBAM, does it impact European production (positively or negatively) - this, along with the next point hitting on tariffs, is a story that I am still confused by. Originally, it looked like most normal importers of NH3 to the EU were going to get hit with big tariff rates. My thought was this would boost European prices which may help restart offline nitrogen production facilities. Now, I do not know if fertilizer is included, what the rates are, etc. Just know that if the CBAM story starts to cause offline production to restart, it will be a bearish event for the world.
- Global tariffs, who is tariffing who? - I am sick and tired of hearing the word tariff...but I have no choice but to talk about it. It seems like tariffs are getting thrown around the world a lot more today...and that is saying something. My way of simplifying it is this: if your country puts tariffs/duties/any economic blockade on NH3 imports, you are within your right to expect your values to climb. These tools do not typically work like politicians think they do. The little man/woman ends up getting screwed like normal.
- N.A. spring values, can they hold before demand returns in 45 days? - January Tampa NH3 values fell a large $65 from December. Right now, I do not know the February price but I am leaning bearish again. That "should" mean that domestic inland values fall as well, right? Ok, ok. Stop laughing. Wipe that tear away. The ultimate question is whether manufacturers and distributors can hold on for 45 more days. If they can, spring demand is here and it is no longer about price (it is, but you know what I mean) and more about supply. Can they is the key question. With urea bullish and UAN holding/pushing higher, unfortunately I think the answer is yes.
StoneX Ratio Calculation
The ratio calculation is derived from Bloomberg historical grains values as well as fertilizer values from StoneX, NPKFAS, and Argus.
The calculation is simply dividing the fertilizer price by each grain price.
All data was sourced from StoneX unless otherwise noted.