I made a case for gold prices to bounce into month-end, which clearly did not work out as well as I had hoped. But then again, gold has not completely rolled over either. With prices clinging to the 4,000 level, there is certainly the potential for two-way chop around current levels. Meanwhile, futures traders have continued to build net-long exposure, options traders are not as bearish as they were a few weeks ago, and Q3 seasonality could provide a tailwind in the weeks ahead. So perhaps the case for a gold rebound is not completely over yet, although bulls may first have to endure a move towards 3,900.
Will Gold Prices Stabilise as July Seasonality Improves?
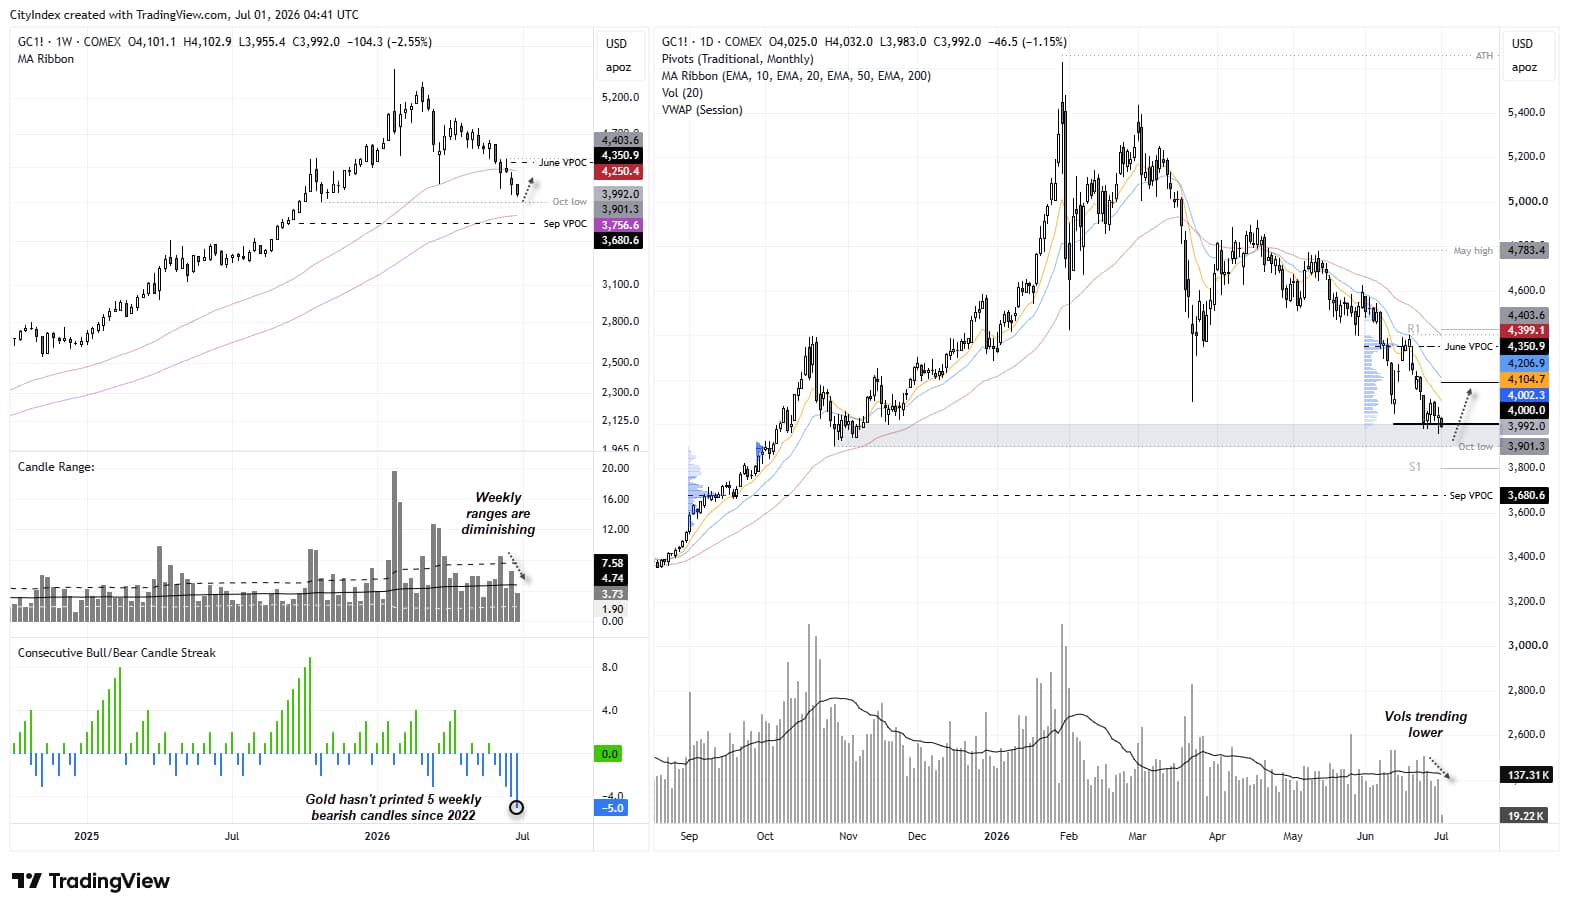
Gold's Longest Bearish Run Since 2022?
By Friday's close, gold had produced its fourth consecutive bearish weekly candle — its longest such streak since January 2024. It is now attempting to extend that run to a fifth, which would mark its longest bearish weekly streak since July 2022 if sellers succeed.
Still, the high-to-low ranges are diminishing, and a doji formed last week around the 4,000 level. Daily trading volumes are also trending lower into current support levels, suggesting the bears may be losing momentum.
Given the strength of the broader bearish trend, bulls should remain alert for an unwelcome spike towards 3,900. But with several clues pointing to a mature bearish move, I suspect many bulls are still sitting on the sidelines, ready to pounce once their buy signal appears.
Source: COMEX, TradingView
Gold (XAU/USD) remains firmly bearish, but shrinking ranges, lighter volumes and a doji near 4,000 hint that sellers are running out of steam.
A final flush towards 3,900 remains possible, but the selloff looks increasingly mature, putting bulls on watch for a reversal signal.
Gold Futures (GC) Positioning | COT Report
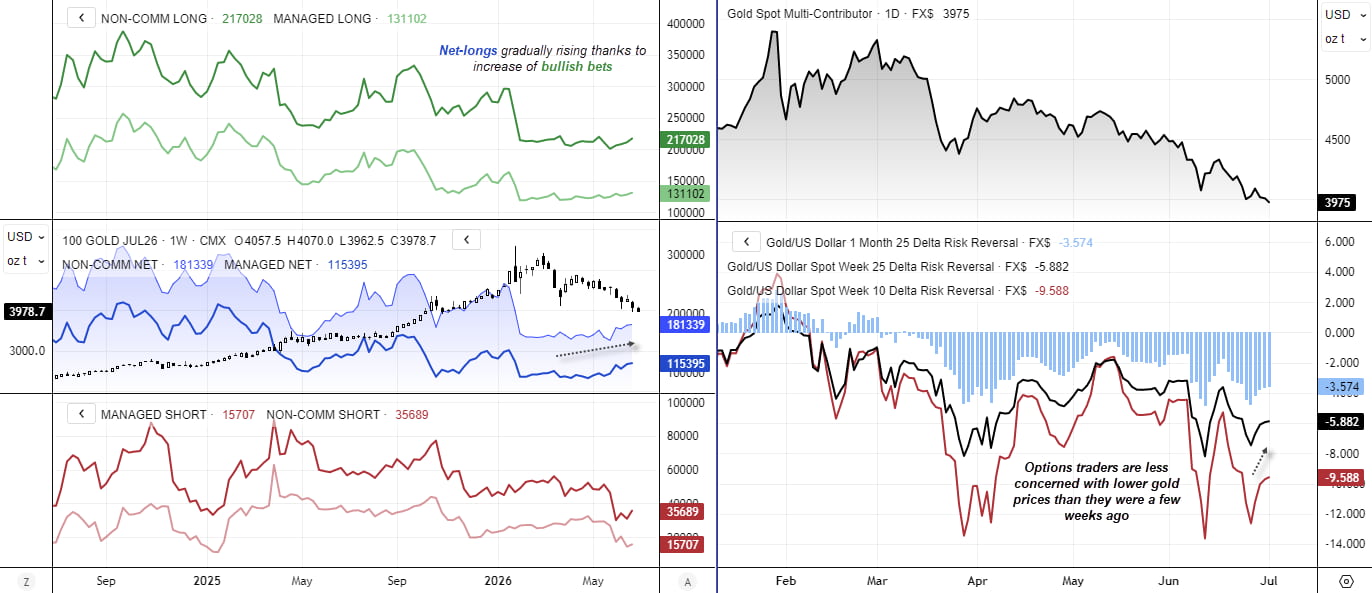
Net-long exposure continued to edge higher among gold futures traders, primarily driven by an increase in long bets from large speculators and managed funds, while shorts have continued to capitulate in recent weeks. That said, we did see a slight increase in short positions among managed funds last week.
Risk reversals continue to show that demand for puts outweighs demand for calls on XAU/USD, although by a shrinking margin. This is not a bullish signal per se, but it does suggest that options traders are less concerned about lower gold prices than they were a few weeks ago, when risk reversals fell to their most negative levels since April.
Taken together, this suggests that appetite to short XAU/USD may be dwindling despite the solid downtrend on the daily gold chart.
Source: COMEX, LSEG
Gold futures positioning continues to improve as long exposure builds and short sellers retreat, pointing to fading conviction among bears.
Options markets remain skewed bearish on XAU/USD, but downside hedging demand is easing, hinting that the gold selloff may be losing momentum
Gold Seasonality Analysis
Gold's Monthly Seasonality Turns More Supportive
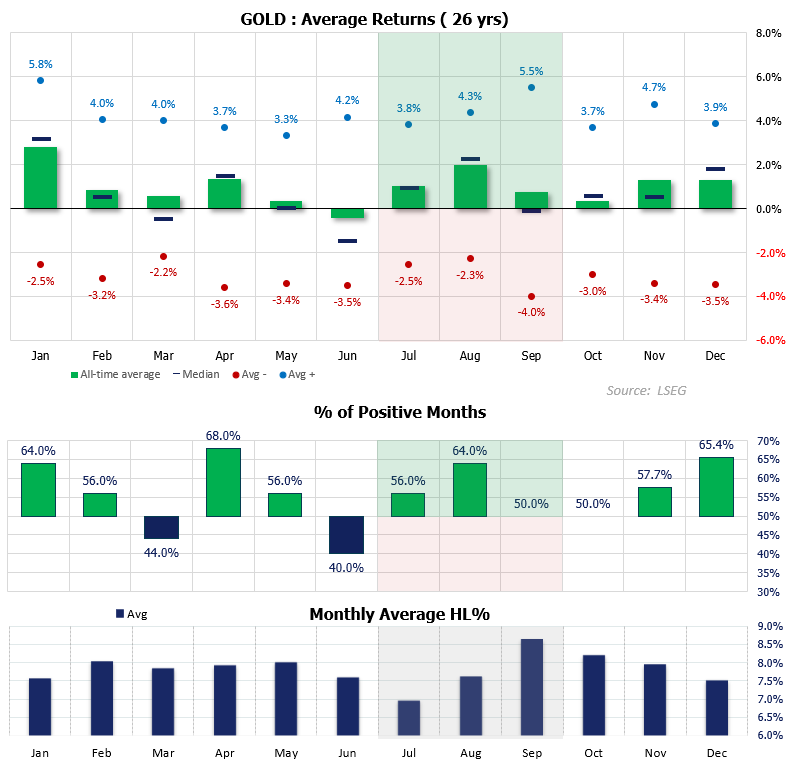
Looking at gold seasonality data since 2000, June has typically been the most bearish month of the year by both average and median returns, alongside a low win rate of 40% (or a loss rate of 60%). Yet average returns for gold prices are positive in each month of Q3, while median returns improve further in July and August. Moreover, the win rate rises to 56% in July and 64% in August before falling back to a coin-flip 50% in September.
Before gold bulls get carried away, July also has the lowest average monthly trading range of the year. Its 56% win rate is not exactly stellar, while average and median returns are a modest 1%.
But we can take a closer look at the daily seasonal profile for gold (XAU/USD) in July to see if bulls can time any upswing with greater accuracy.
Source: LSEG
Gold (XAU/USD) seasonality turns more supportive in Q3, with July and August historically delivering modest gains after June's typically weak performance.
Any July rally may be measured rather than explosive, as the month also records gold's lowest average trading range of the year.
Gold's Daily July Seasonality Signals a Shaky Start for July
As gold seasonality patterns are simply an average of past performance, we need to remember that they are not a roadmap to the future. Fundamental drivers can easily overpower a seasonal pattern, and that becomes even more likely when we drill down to the daily timeframe.
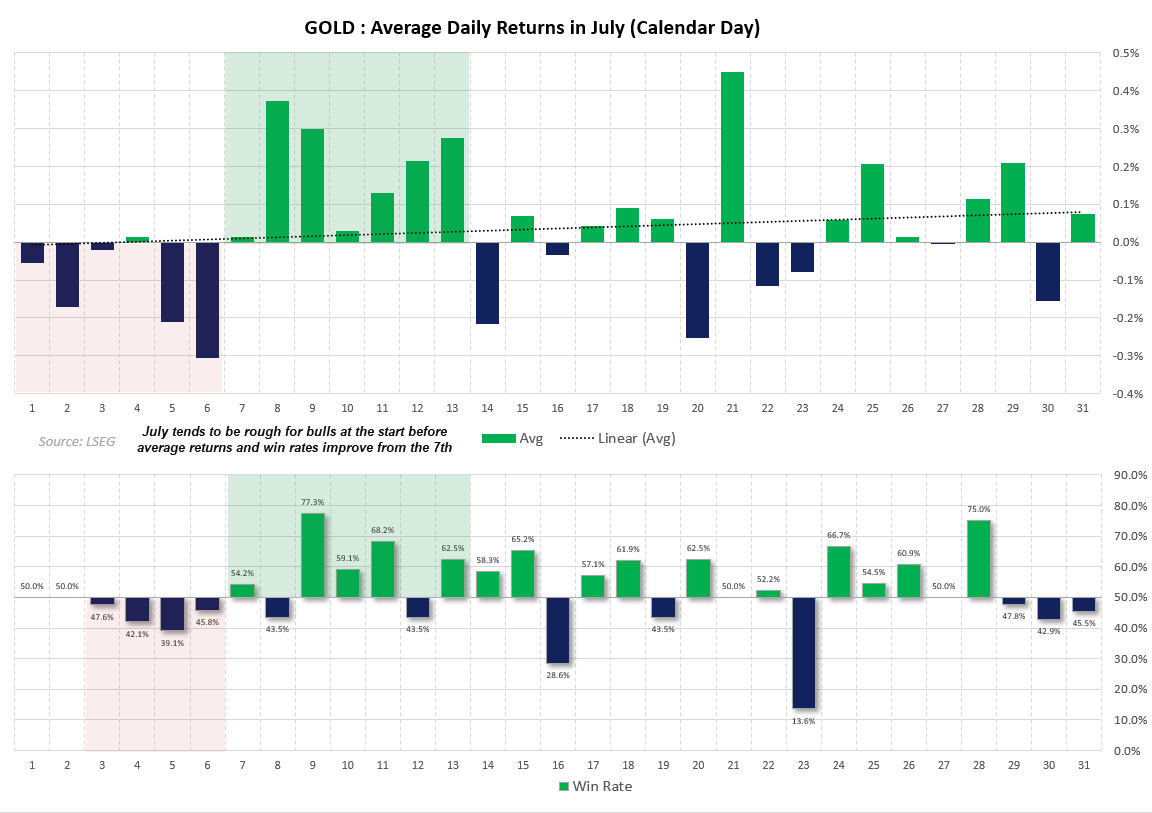
Still, the daily returns data for XAU/USD since 2000 shows that July tends to be bearish through to the 6th, with win rates below 50%. Yet from the 7th, average returns and win rates tend to improve through to the 13th. These patterns disappear in the second half of the month, where the distribution of wins, losses and returns appears more random.
But if this seasonal pattern holds true this month, gold bulls may have their work cut out this week before standing a better chance of success from the middle of next week.
Source: LSEG
Daily seasonality for XAU/USD is weakest through 6 July, with below-average returns and win rates under 50%.
Historical odds improve from 7–13 July, although fundamental drivers can easily override seasonal patterns and the edge fades later in the month.
Precious Metals
StoneX TV content is created, produced, and distributed solely by StoneX Media Ltd (“StoneX TV”) and is provided for informational and educational purposes only. StoneX TV does not provide investment, financial, legal, or tax advice and does not make any recommendation or endorsement of any investment strategy, transaction, or financial instrument. Nothing in this content constitutes, or should be construed as, investment advice or a recommendation to buy, sell, or hold any financial instrument, including securities, futures, derivatives, digital assets, foreign exchange products, or CFDs. This content does not constitute an offer, invitation, or solicitation to engage in any investment activity. The information presented is general in nature and is not tailored to the financial situation, investment objectives, or risk tolerance of any specific person. You should not rely on this content as a substitute for independent professional advice. Investing and trading in financial instruments involves significant risk of loss and is not suitable for all investors. Past performance is not indicative of future results. Any views or opinions expressed are those of the presenter at the time of publication and are subject to change without notice. Such views may not necessarily reflect those of StoneX Media Ltd or its affiliates. StoneX Media Ltd and its affiliates, including StoneX Group Inc., may from time to time have positions in, or engage in transactions involving, the financial instruments referenced. This content may include general market commentary and opinion. It does not constitute independent investment research and has not been prepared in accordance with legal requirements designed to promote the independence of investment research. StoneX Media Ltd is not authorised or regulated to provide investment services and does not act in a fiduciary capacity. StoneX Media Ltd is incorporated in Ireland and operates in accordance with applicable Irish law. It is a wholly owned subsidiary of StoneX Group Inc. and is a separate legal entity from other subsidiaries within the StoneX Group, which may be regulated in various jurisdictions. StoneX Media Ltd does not act on behalf of, or provide services for, any regulated affiliate. This content is not directed at, and may not be distributed to, any person in any jurisdiction where such distribution would be contrary to local laws or regulations. Supporting documentation for any claims, comparisons, statistics, or technical data may be made available upon reasonable request, where applicable.
Discover more insights
Our subscribers have access to comprehensive market analysis from StoneX spanning commodities, equities, currencies and more.
Our market expertise, advanced platforms, global reach, culture of full transparency and commitment to our clients’ success all set us apart in the financial marketplace.
Reach
With access to 40+ derivatives exchanges, 180+ foreign exchange markets, nearly every global securities marketplace and numerous bi-lateral liquidity venues, StoneX’s digital network and deep relationships can take clients anywhere they want to go.
Transparency
As a publicly traded company meeting the highest standards of regulatory compliance in the markets we serve; our financials and record of accomplishment are matters of public record. StoneX’s commitment to “doing the right thing over the easy thing” sets us apart in the industry and helps us build respect, client trust and new partnerships.
Expertise
From our proprietary Market Intelligence platform, to “boots on the ground” expertise from award-winning traders and professionals, we connect our clients directly to actionable insights they can use to make more informed decisions and achieve their goals in the global markets.