China is of great importance in the global commodities market. According to USDA data, in the 2020/21 crop, the Asian giant was the main importer of soybeans, corn, cotton, beef, pork, and the 2nd main importer of wheat, second only to Egypt.
With this, the performance of the Chinese economy and, consequently, the demand is closely monitored.
Since the beginning of the pandemic, the country has adopted very restrictive measures to contain Covid-19.
Currently, outbreaks of the omicron variant of the coronavirus have resulted in significant containments, fueling fears of negative impacts when the country's economic growth no longer reaches the levels of the past. However, it is high by today's standards around the world.
In the following paragraphs, the behavior of Chinese imports of soybeans, corn, wheat, meat, cotton, and vegetable oils will be analyzed, considering February data from the China Customs Department (GAAC).
Soybean
China is the world's largest importer of soybeans, and what happens in the country regarding demand is always closely monitored since it impacts the global balance of the oilseed.
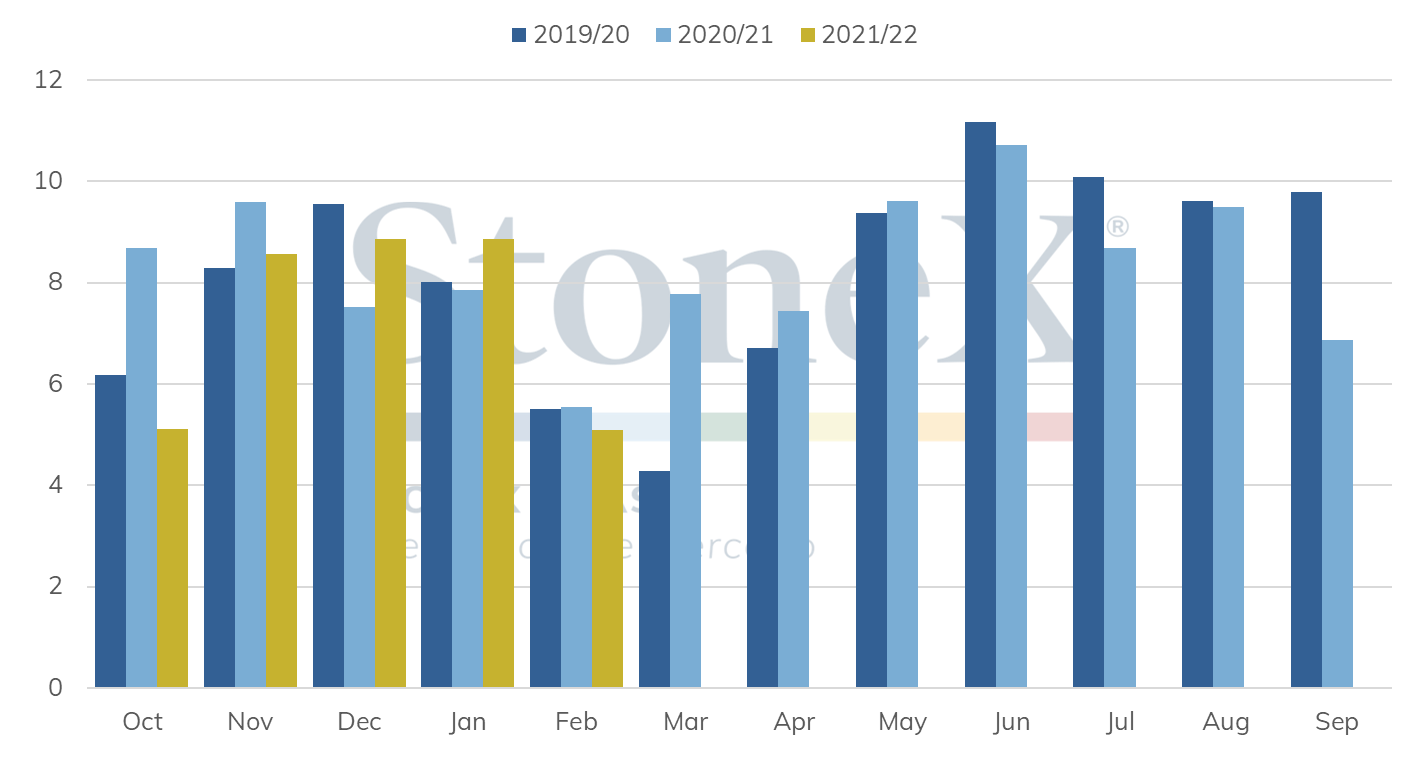
In 2020, China imported 100.3 million tonnes of soybean, falling to 96.5 million in 2021. However, considering the crop year calculated by the USDA for the country, between October and September, Chinese imports reached 98.5 million tonnes in 2019/20 and 99.8 million in 2020/21.
As for the 2021/22 cycle, which runs from October 2021 to September 2022, there are many doubts about the volumes China will import, even with its pig herd being practically recovered after the outbreaks of African swine fever in August 2018.
In the latest USDA monthly supply and demand reports, the Department cut the Chinese import number from 100 million tonnes to 97 million and then to 94 million tonnes in March. It is important to remember that sales and shipments of US soybeans in 2021/22 to China are considerably lower than in the same period of the previous cycle. This situation has lasted since the beginning of the 2021/22 crop. Considering the accumulated volume through March 17, US 2021/22 soybean sales to China are 8.1 million tonnes behind that recorded in the same period a year earlier.
Between October 2021 and February 2022, China imported 36.5 million tonnes of soybeans, a lower volume than the 39.1 million tonnes recorded in the same period a year earlier. Notably, imports were weaker in
October and November but showed a more heated performance in the following months. As a result, in the first two months of 2022, China imported 13.9 million tonnes of soybean, a volume slightly above that reached in the first two months of 2021, at 13.4 million tonnes.
So, as estimates are more pessimistic for Chinese imports in the 2021/22 crop, there is still most of the 2021/22 crop year left. Brazilian exports are already quite heated, which is normal for the period. However, with the significant shortfall of the 2021/22 crop this year, North American shipments may gain some strength still in the first half, including to China, which is not seasonally usual.
Soybean monthly imports - China (MMT)
Source: Chinese Customs. Design: StoneX.
Corn
In 2021, the Asian country imported 28.3 million tonnes of corn, a volume 2.5 higher from 2020. Between 2017 and 2020, 22.4 million tonnes entered China, a lower volume than the imports recorded between January and September 2021 (24.9 million tonnes). Chinese purchases increased more than ten times in the period in question (2017 to 2021), from 2.8 to 28.3 million tonnes.
The significant increase in the volume purchased is largely due to the strong increase in demand from the animal protein-producing sector, especially the pork industry. In addition, after the significant reduction in the hog herd caused by outbreaks of African Swine Fever, mainly between 2018 and 2019, China began a process of rebuilding its herd in 2020, which increased the demand for the grain, not only due to the growth in the number of animals, but also the ban on the use of washing and leftover food in animal feed, a measure taken to control the disease and prevent new outbreaks.
In addition to the variation in the volume purchased, a change in the main supplier of the grain to China was also observed. Between 2017 and 2019, Ukraine was the origin of about 80% of the corn imported by the Asian giant, while the US had an average share of 12%. However, in 2020 this disparity was significantly reduced, with 56% of the corn imported by China originating from the Eastern European country and 39% from the US. In 2021 the scenario was reversed, with the US having a 70% share and Ukraine 29%.
It is important to understand the dynamics of the two exporting countries to understand the reason for this change in the origin of the grain. According to USDA data, Ukraine's ending stocks averaged 1.4 million tonnes between the 2015/16 and 2019/20 crops, while the US stood at 52.4 million.
Thus, Ukraine would hardly be able to supply the sudden increase in Chinese demand, which made the Asian giant intensify its relationship with other players. In addition, in 2020, the Black Sea country was hit by significantly hot and dry weather than usual, resulting in a significant reduction in Ukrainian production and exportable surplus, contributing to the US's higher share as a corn supplier to China.
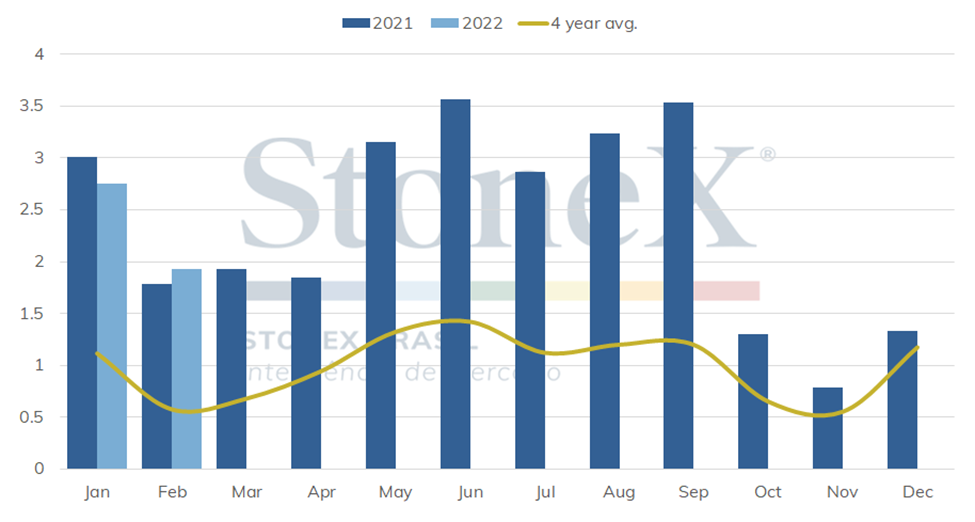
After the strong increase in Chinese purchases observed in the previous year, in 2022, the country is expected to show reduced imports. Still, the Asian country is expected to continue to purchase higher volumes and maintain its leadership among corn importers since the high hog herd and government incentives after the African Swine Fever outbreaks to replace food waste in animal feed should contribute to the demand for grains. At least, that is what the data for January and February indicate. In the last two months, the country imported 4.7 million tonnes versus 4.8 million in 2021.
On the grain origin side, the tendency was that, with the recovery of Ukrainian production in 2021/22, China would once again purchase larger volumes from the country, which is what the latest import data suggest. Between January and February 2021, the country had imported 2.36 million tonnes of corn from Ukraine and 2.41 million from the US, volumes equivalent to 49% and 50% of the total recorded in the period, respectively. In the first two months of 2022, these figures reached 2.65 (56%) and 1.92 million tonnes (41%).
However, with the conflict between Russia and Ukraine, the Black Sea country will hardly be able to supply large volumes of cereal this year. The Ukrainian ports are closed, preventing the country from fulfilling its export contracts, causing China to redirect its demand to other players. Moreover, this issue extends to 2023 as corn planting starts in April and with no signs that the end of the conflict will occur so quickly, a strong impact is expected on the next grain crop.
Corn monthly imports – China (MMT)
Source: Chinese Customs. Design: StoneX.
Wheat
The Covid-19 scenario and the Black Sea conflict between Russia and Ukraine have increased uncertainties and prices in the commodities market. Therefore, the new focus of attention is the concern about the global supply capacity and how agents will position themselves for the wheat trade flow reconfiguration.
China had intense participation in the demand for wheat throughout the Covid-19 pandemic since it is markedly concerned with food security since its territorial and population proportions. As a result, according to the United States Department of Agriculture (USDA), its domestic demand grew 19% year on year, from 126 million tonnes in 2020 to 150 million tonnes in 2021. Part of this demand is reflected in the increase in domestic production of wheat, on the order of 650 thousand tonnes in the 2020/21 crop (+0.5%) and 2.696 million tonnes in the 2021/22 crop (+2%).
Despite being the largest producer of this grain, China imports wheat precisely to maintain comfortable domestic demand. The accumulated volume imported jumped from 3.2 million tonnes in 2019 to 8.15 million tonnes in 2020 (+154%) and 9.7 million tonnes in 2021 (+19.2% compared to 2020 and +203% compared to 2019).
Regarding trade partners, the increase in the participation of Australia and the United States among the main exporters stands out in this period. Australia rose from being the fifth to the first largest exporter of wheat, originating about 182.7 thousand tonnes in 2019 to China to 2.7 million tonnes in 2021 (+1,400%).
While the United States moved from the third to the second largest source, exporting 236,000 tonnes in 2019 and 2.72 million tonnes in 2021 (+1,055%). The other countries in this supply chain, France, Canada, and Kazakhstan, remained among China's top five export markets, only losing positions to Australia and the United States.
Russia showed a drop in the participation in Chinese imports over the past three years. Its share was about 1.46%, 0.88%, and 0.5% of China's total wheat imports in 2019, 2020, and 2021. In 2022, no imports were recorded, according to the USDA. Despite lower participation, agents monitor the market to reallocate trade flows due to the Black Sea conflict and possible increased competition with Australia's main Chinese source.
At this time of repositioning supply and demand, India stands out; despite not being a significant exporter of wheat, it is the second-largest producer globally.
Wheat monthly imports – China (MMT)
Source: Chinese Customs. Design: StoneX.
As for cotton, the movement observed in recent years was also increased Chinese imports. Between 2017 and 2020, the volume of cotton that entered the country increased by 86.9%, from 1.2 million tonnes to 2.2 million. However, in 2021, this sequence of consecutive years of increase was interrupted, with the country ending the last year with an imported volume of 2.1 million tonnes.
Between January and July last year, the country had imported 1.7 million tonnes versus 1 million in the same period of 2020. However, the pace of cotton entering the country dropped significantly in the remaining months of 2021, with the Asian giant importing just 0.5 million tonnes, compared to 1.1 million between August and December 2020.
One factor that helped explain this slowdown in shipments to China was the harvest delay in major suppliers. Both the US and Brazil have experienced cotton planting delays, and the former also experienced some adversities during the harvest period, further delaying its supply. With this, subsequent steps in the chain were also delayed, and this was one of the factors that supported the lower amount of cotton entering China in the final months of 2021.
With the greater availability from the US, already in December, but especially at the beginning of 2022, the country returned to present higher import volumes. For the rest of the year, the expectation is that the country will continue to make high purchases, given the revival of the Chinese textile sector after the impacts caused by the Covid-19 pandemic. In addition, on March 11, the National Development Reform Commission of China opened a new import quota of 400,000 tonnes of cotton under lower tariffs. This volume will be directed to secure the input of private sector textile mills, a matter that supports expectations of robust Chinese imports.
On the other hand, with the new coronavirus outbreak in China, questions are being raised about possible new impacts on the Asian economy. Shanghai reported last Sunday, March 27, that it will hold a lockdown in the city for nine days after recording a new daily record of asymptomatic infections and that non-essential companies and factories will suspend activities or carry them out remotely. The hope among officials is that as vaccinations progress, the impact will be milder than previous outbreaks, but this does not entirely reassure the situation.
On the side of the origin, they have had significant changes. Between 2017 and 2020, the volume of cotton imported from the US increased by 92.9% to 976.7 thousand tonnes, equivalent to 45% of that imported by the Asian giant. In 2021, the volume observed was 828.8 thousand tonnes, a decrease of 15.1%, a movement justified by the delay in the availability of North American cotton, about 34% of the total imported by China.
Brazil, which began to have greater participation in the Chinese market in 2019, benefiting from the conflict between the Asian giant and the US, continued to deepen its contact with China, consolidating itself as a major trading partner and increasing shipments to the country. As a result, the volume of Brazilian cotton entering the country rose from 66,600 tonnes in 2017 to 643.6 in 2021, accounting for 30% of the volume sent to China last year.
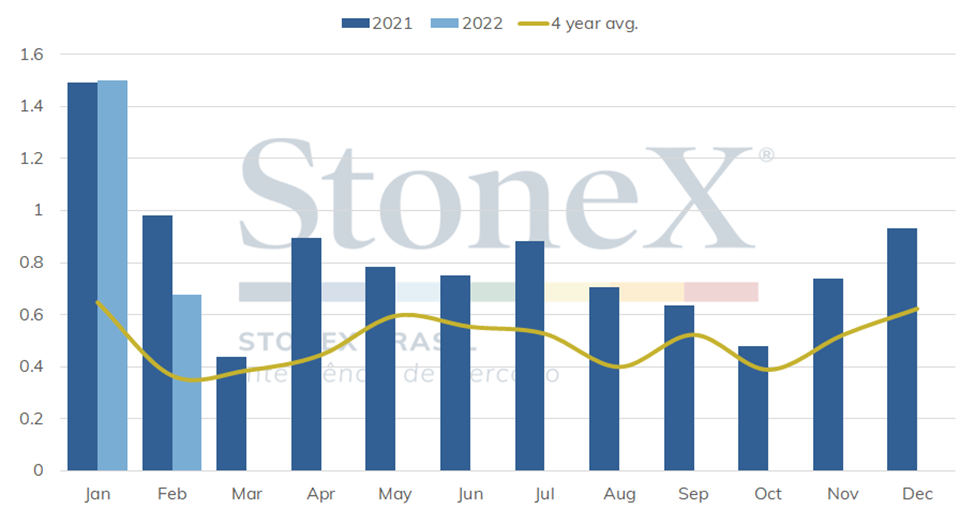
In the first two months of 2022, 412.9 thousand tonnes of cotton entered the Asian country, a volume well below the 690.7 thousand tonnes imported in the same period in 2021 but above the 3-year average of 352.9 thousand tonnes, indicating an acceleration in the pace of shipments.
In this 2021/22 crop, and for the next few years, Chinese demand should continue as one of the main drivers of the market. As already mentioned, the recovery of the textile sector in the country should continue to drive cotton purchases by the country, and even with the new outbreaks of Covid-19 in the country bringing some concern, expectations are still positive.
Cotton monthly imports – China (TMT)
Source: Chinese Customs. Design: StoneX.
Since the end of 2021, the rising prices of the vegetable oil complex have caused a certain retraction in the international demand for the import of the vegetable oil complex, which registers a slower negotiation flow compared to previous years. The soybean and palm oils prices on the CBOT and Bursa, respectively, are exploring historical highs since the middle of last year, supported by a scenario of tight availability and rising prices of energy sources. From the beginning of December/21 to late March/22, oil prices have tightened the pace of appreciation and have accumulated more than a 35% increase in the most-active contracts.
Concomitantly with the increase in the pace of appreciation, the demand for oils has weakened, marking the fall in the pace of trade this year's first two months. In Malaysia, the volume of palm oil exported in the first two months of 2022 was 8% lower than the last 5-year average for the period. In Indonesia, the January shipments represented a drop of 24% compared to the average. Similarly, China and India, the main importers of palm oil, recorded significant reductions in palm oil imports in the first two months, compared to the average of recent years – down by 49% and 68%, respectively.
In recent months, palm oil, traditionally cheaper than its competitors, has been trading at levels very close to those practiced by other historically more expensive oils, such as soybean oil. This market distortion increased the preference of importers for the "noblest" oils, which also explains the sharp drop in palm oil sales. With this, soybean oil gained a competitive advantage, reflected in the increase in Brazilian shipments. As a result, despite the 35% retraction in February, when compared to January, it was 200% higher than last year.
As of March, however, the picture of low demand for palm and soybean oils was reversed, with the beginning of the war in Ukraine and the loss of the largest global market for sunflower oil, the fourth largest vegetable oil market in the world – in which Russia + Ukraine account for almost 60% of global production. Furthermore, the sudden disruption of sunflower supplies due to the logistical disruptions caused by the war and the imposition of sanctions against Russia have forced importers (mainly India and China) to increase their demand for soybean oil in South America and palm oil in Southeast Asia. Therefore, over the next few months, as long as the supply of sunflower oil in the Black Sea does not re-establish itself, there will be additional demand for the other oils in the international market.
Volume of palm oil imported - China and India (TMT)
Source: Chinese Customs and Solvent Extractors Association of India.
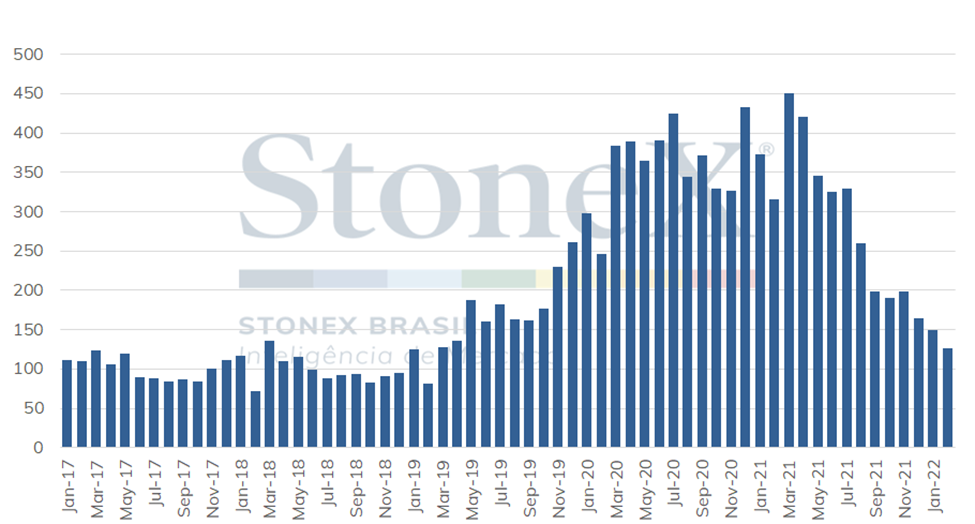
Pork is the favorite type of animal protein of the Chinese population, with its consumption significantly higher than that of beef and chicken. However, in recent years, this market has faced strong volatility, causing important variations in the volume imported. Making a brief recap, in 2017 and 2018, China was buying about 100,000 tonnes of pork on the international market per month. In 2019, with the spread of African Swine Fever (ASF) and the consequent decimation of local herds, imports began to skyrocket. They peaked between March 2020 and July 2021, when monthly purchases remained within the 320,000 to 450,000 tonnes range.
The movement we are currently experiencing, specifically since August 2021, is that of a strong deceleration in pork protein imports. This trend is largely a result of the rebuilding of the Chinese herd. According to the Chinese National Reform and Development Commission, in June 2021, the country already had 439.11 million heads, a number similar to that recorded before the ASF. Given this growth in local supply, a reduction in imports was expected.
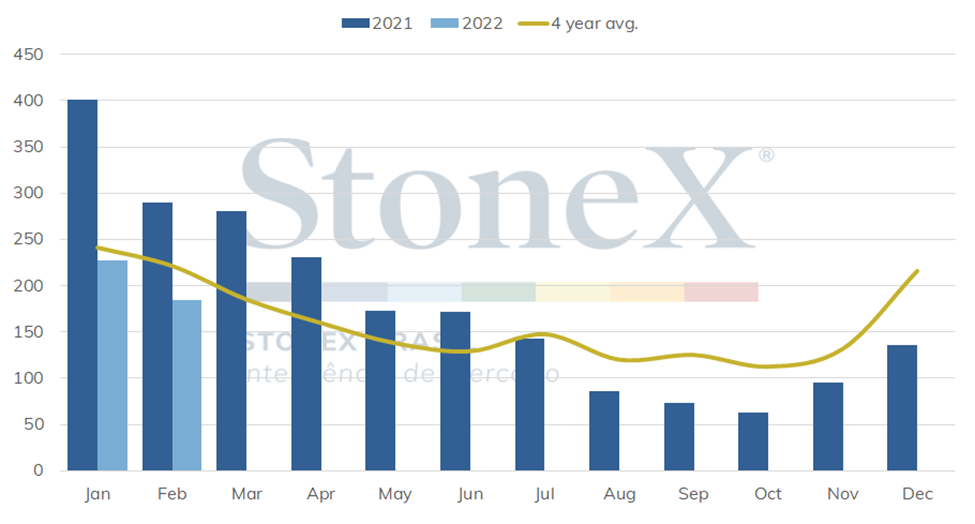
Besides this direct relationship, the rebuilding of the herd also negatively impacted imports through the drop in the domestic hog prices. For example, on January 8, 2021, the first day of trading of hog futures contracts on the Dalian exchange, the animal was trading at RMB 28.29/kg; on March 25, 2022, a little over a year later, the kilo of pork was traded at RMB 11.50, a devaluation of 146%. With this, the imported pork lost competitiveness as the logistical costs hardly allow this protein to be offered at similar values to those existing in the Chinese market. Thus, from a record import value of 450.9 thousand tonnes in March 2021, this volume declined to 126.6 thousand tonnes in February 2022, a drop of 256%.
Looking specifically at imports from Brazil, they continued to grow even after the total volume of Chinese purchases began to decline. However, since December last year, they have also been falling. In February 2022, 28 thousand tonnes of pork from Brazil arrived at Chinese ports. In 2021, the Monthly average reached 45.5 thousand tonnes.
Pork monthly imports – China (TMT)
Source: Chinese Customs. Design: StoneX.
In the USDA's latest quarterly report entitled "Livestock and Poultry: World Markets and Trade," the Department estimated that China has the second-largest cattle herd globally, with its 99.5 million head of cattle second only to the 264.1 million raised in Brazil. It is also worth noting that the amount of animals has been growing, with a 10.1% increase since 2018.
However, despite the growth, it is a fact that Chinese domestic production is not enough for the country's demand for beef in the last decade. Historically low, this demand began to increase when the country's economic growth allowed the flourishing of a middle class and the strengthening of the purchase of relatively more expensive products, among them beef. Since 2018, the USDA estimated that the Chinese demand for this product had increased 30%, reaching 10.15 million tonnes in 2022. Since the estimated 99.5 million heads of cattle will allow for the production of only 6.92 million tonnes, a significant portion of the demand will have to be met from imports. This condition has been a constant.
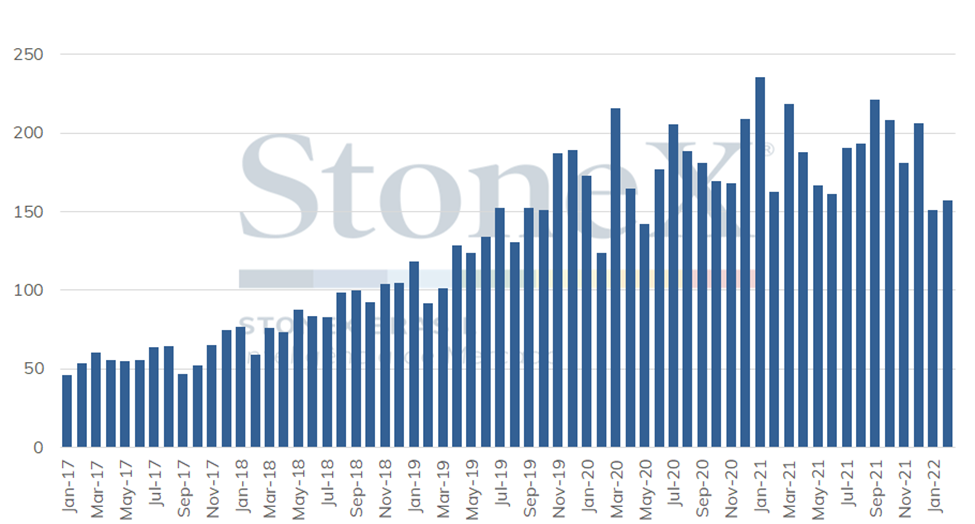
A sample base starting in 2017 shows that this gap between production and demand for beef in China grew sharply between January 2017 and November 2019, which led monthly imports to jump from 46.3 thousand tonnes to 187.0 thousand tonnes, an increase of 303.8%. However, this difference has since stabilized, with purchases on the international market remaining around this figure, despite a certain alternation between strengthening periods with cooling moments.
Given these sixteen months of relative stability, it is valid to estimate that in 2022 the Chinese demand for beef will remain firm, with Chinese importers continuing to be the most important players in the market.
However, it is also likely that purchases will not increase significantly, as they have remained around this 185,000 tonnes.
Looking specifically at the first two months of this year, the import volume was slightly below this average. In January, 150.9 thousand tonnes arrived at the Chinese ports and in February, 156.9 thousand tonnes. However, this limitation reflects the embargo period on Brazilian imports and is not consistent with a scenario of normal supply conditions. January 2022, for example, was the month in which purchases from Brazil had their lowest monthly volume since 2016, only 13.9 thousand tonnes.
More recently, data from the Secretariat of Foreign Trade proves that a significant amount of beef left Brazilian ports for China. More specifically, there were 52.6 thousand tonnes in January and 87.1 thousand tonnes in February. Therefore, in the next few days, large volumes of bovine protein should arrive in China, which should help compensate for the less abundant supply from the beginning of the year and act to maintain the monthly average of imports of around 185 thousand tonnes.
Beef monthly imports – China (TMT)
Source: Chinese Customs. Design: StoneX.