

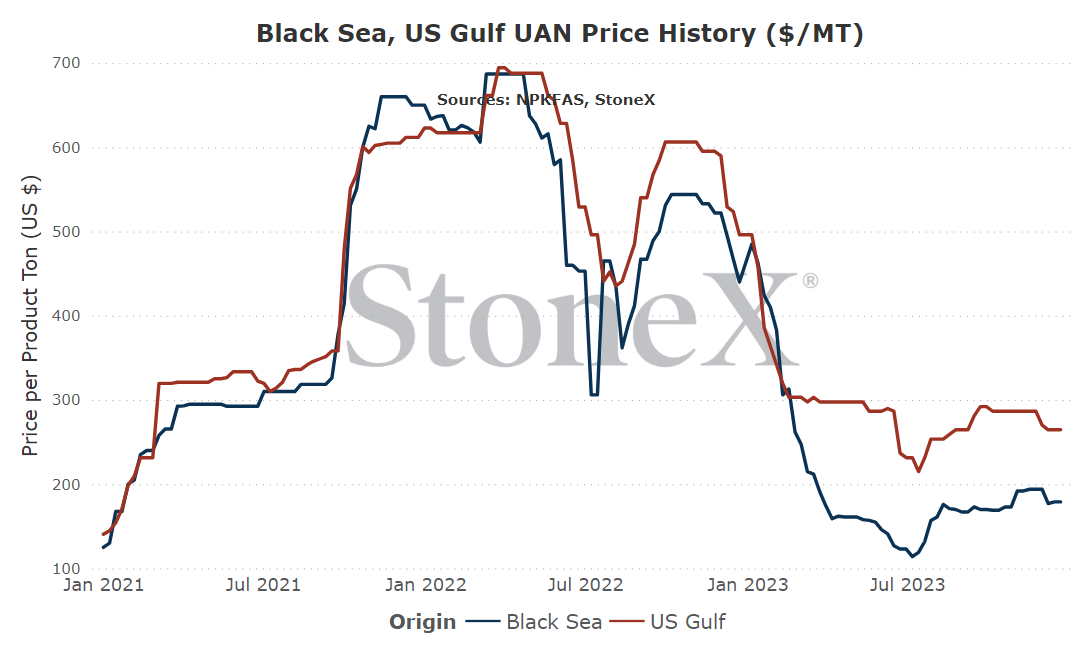
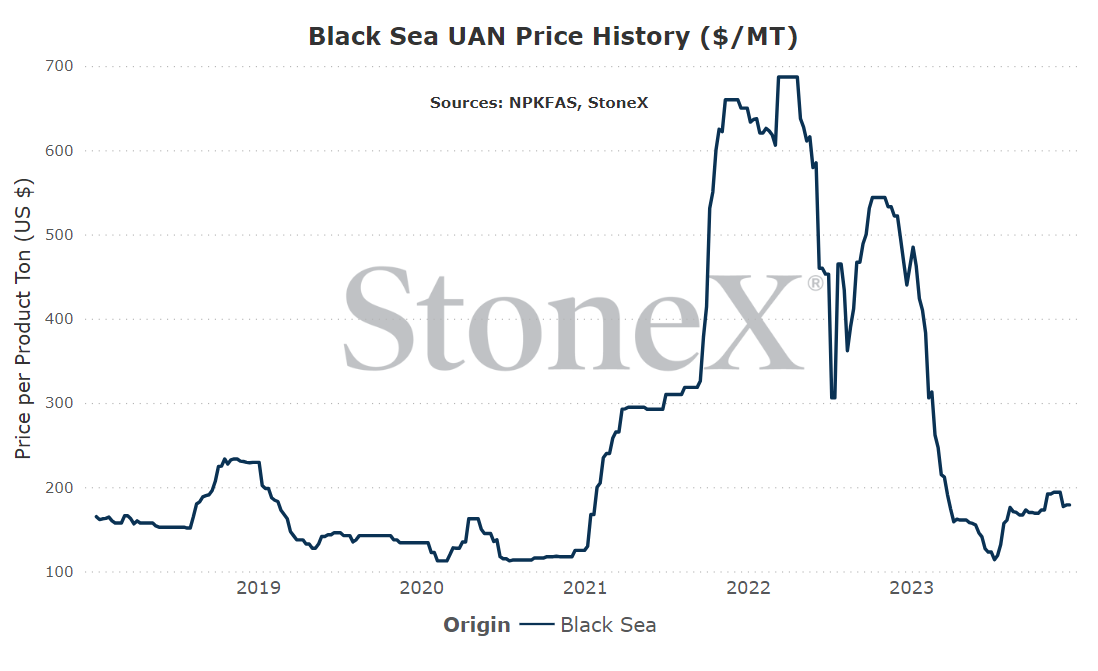
The intention of the below graphs are not to use to say "my price should be X based on this graph". These prices are derived from an FOB price point average. The intent is to show major global price movement trends. Your values will likely have significant basis difference (similar to your local grain price being different than the traded market price).
This graph is labeled as MT in USD currency.
While the fertilizer futures market is far from as liquid as its grain counterparts, it is still active and gives us an insight into what the market is thinking.
Please note that the values below can and will change daily. This is merely a look at where they are as of writing:
| NOLA UAN | |
| January | $235 |
| February | $235 |
| March | $237.50 |
Dutch TTF falls, but European UAN production unchanged
One of the highlights of the natural gas world has been the correction of European Dutch TTF values. Prices rose to approximately $103MMbtu following Russia cutting off Nordstream shipments. The outlook was bleak at best...but as always, the market finds a way (que Jurassic Park theme song music). Prices started a slide that lasted MUCH longer and were MUCH bigger than anticipated. Eventually, recent months saw those values trend into the teens. However, the Hamas attack on Israel disrupted that bearish trend and shot values from $11 - $12 up to the $18 range, with fears of going higher but since then, prices have trailed back into the $10 - $11MMbtu range.
Alright, I think that catches us up to today.
One of the hopes were that with Dutch TTF challenging single digits that we would see remaining European offline production restart which should cause world values to fall further. Unfortunately, that has not been the case.
Part of the reason is that these plants are old and they have been offline for a while. That in itself is going to be a hurdle in getting production back.
Part of the reason is that Dutch TTF value are still significantly higher than "normal".
Part of the reason is that world nitrogen prices are significantly lower than where they have been in recent months/couple years.
Today, we are still watching Europe closely as they have the ability to sway the global UAN market single handedly...but today, there is no change.
Russian destinations remain restricted
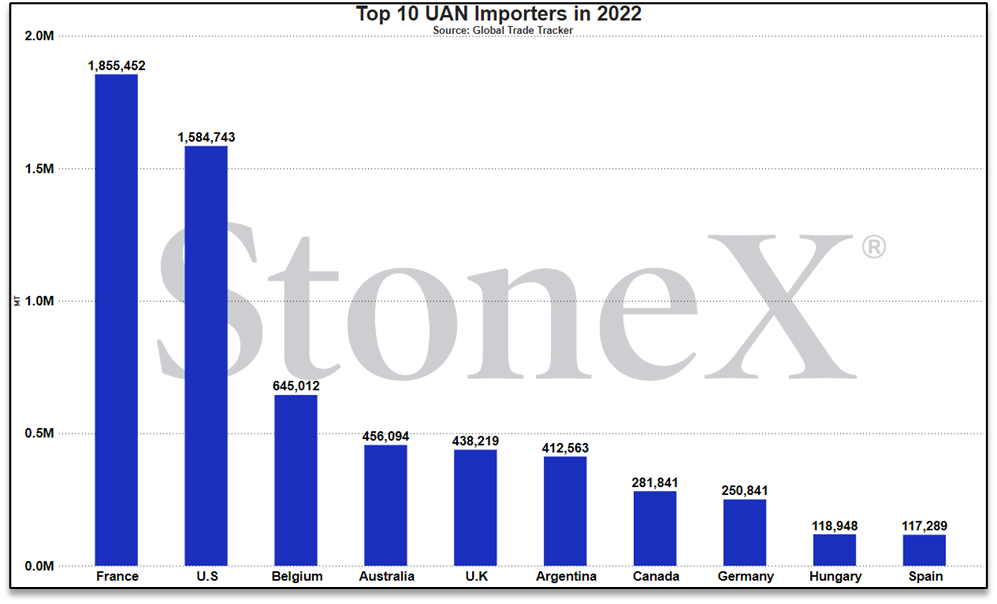
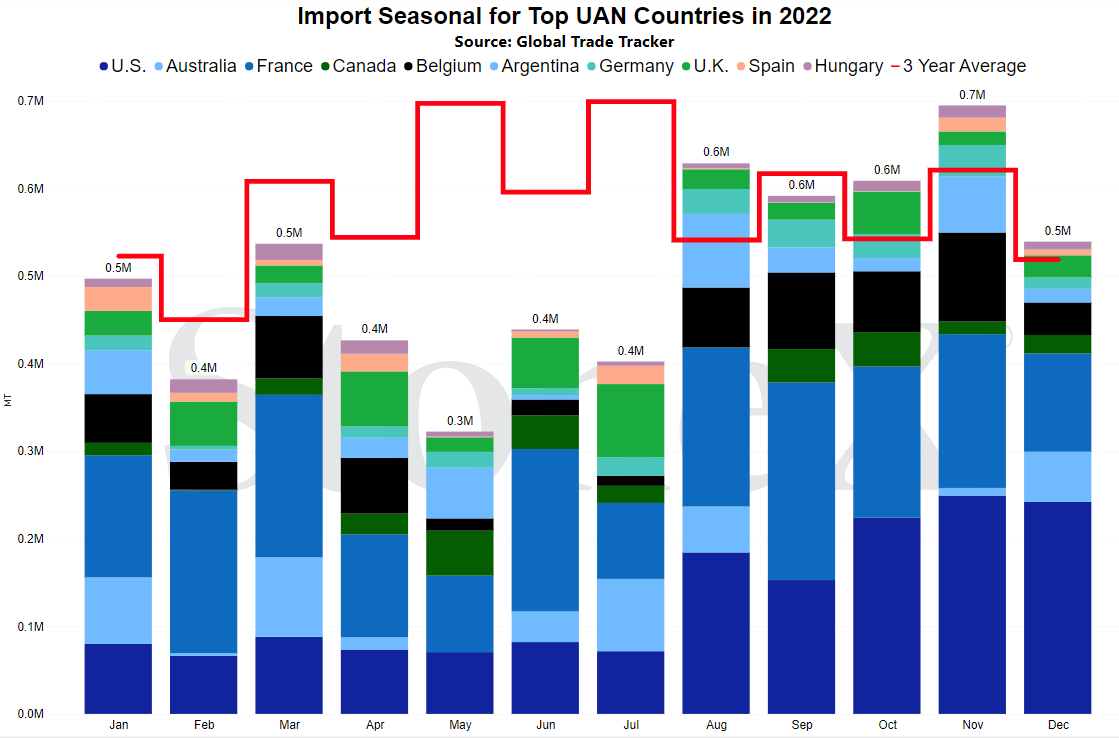
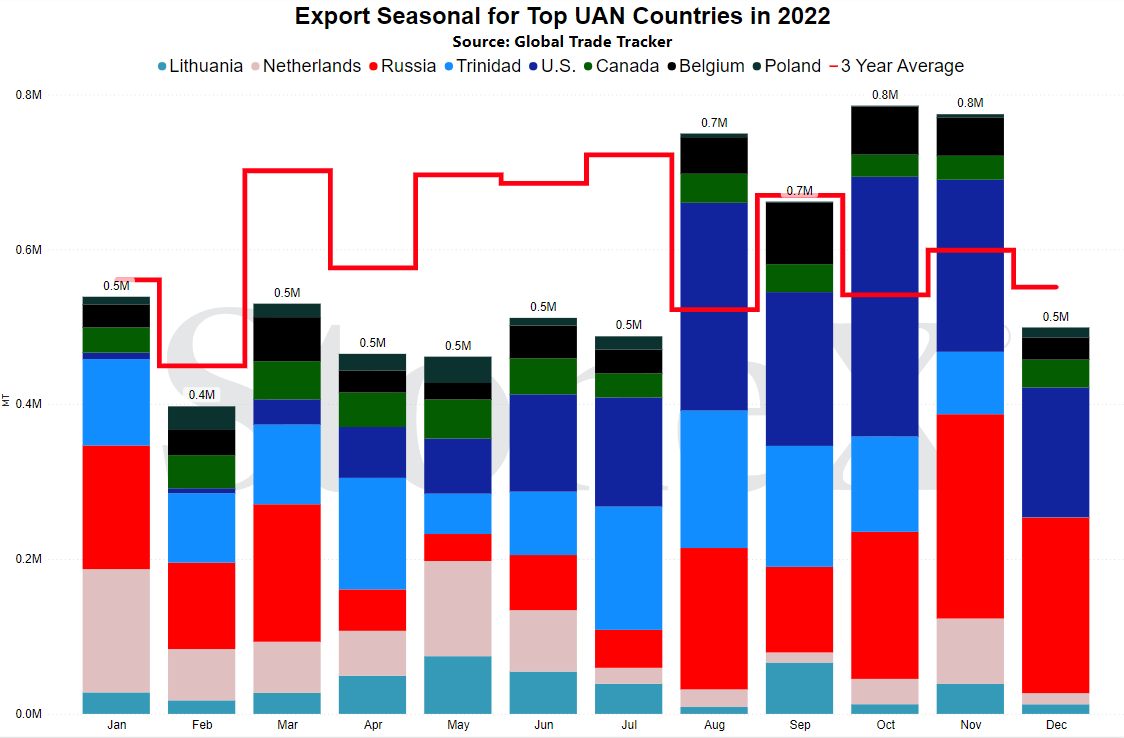
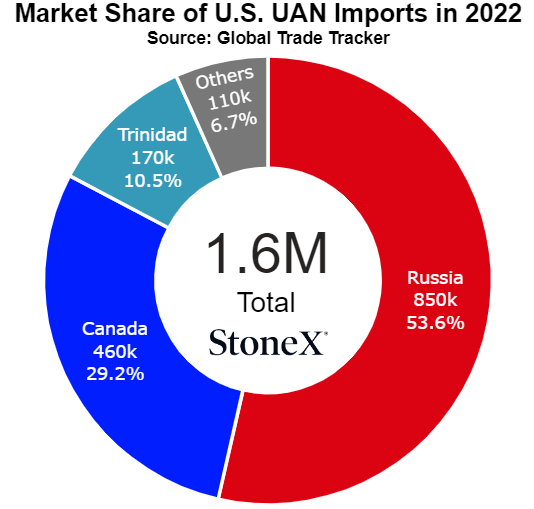
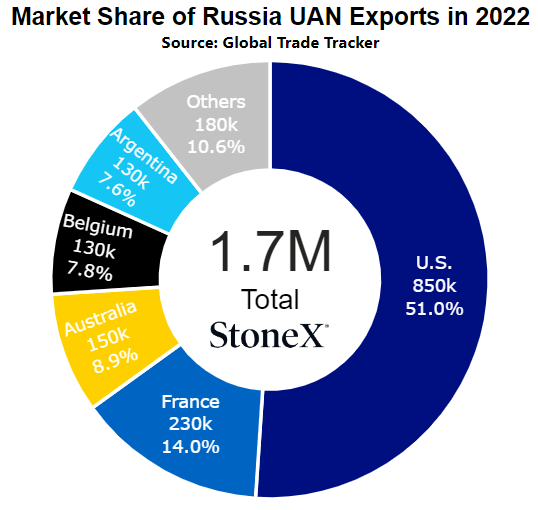
If you look at the first graph for this newsletter, you will see that Black Sea UAN values are significantly lower than NOLA UAN values. The reason is that Russian UAN producers are paying the price for global inefficiencies. Australia continues to have duty rates set on Russian produced fertilizer. Canada continues to have duty rates set on Russian produced fertilizer. Europe remains uninterested in buying from Russia. The global UAN market is relatively small. With those 3 areas out of reach, it means that the U.S. is one of the last remaining large buyers in the world...and Russia has to drop their price significantly to compete.
Now, this could all change rather quickly. If we see governments start looking at these import hurdles and opt to do away with them in hopes of lower food prices, we would suddenly see Russian values move higher as those trade lane inefficiencies go away.
However, today all those blockades remain in place...and Russia is paying the price.
Weaver, IA nitrogen facility selling to Koch lends to more consolidation
A couple weeks ago, the N.A. nitrogen market was rocked by reports and announcements that Koch was set to purchase OCI's nitrogen production facility based in Weaver, IA. This plant is the newest nitrogen facility in the U.S., completed around 2018 (based on memory). To say many in the market cried foul would be an understatement.
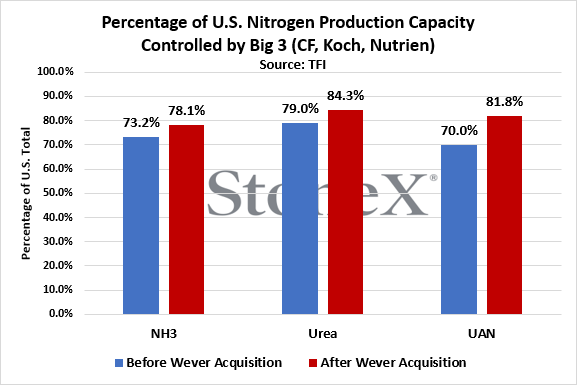
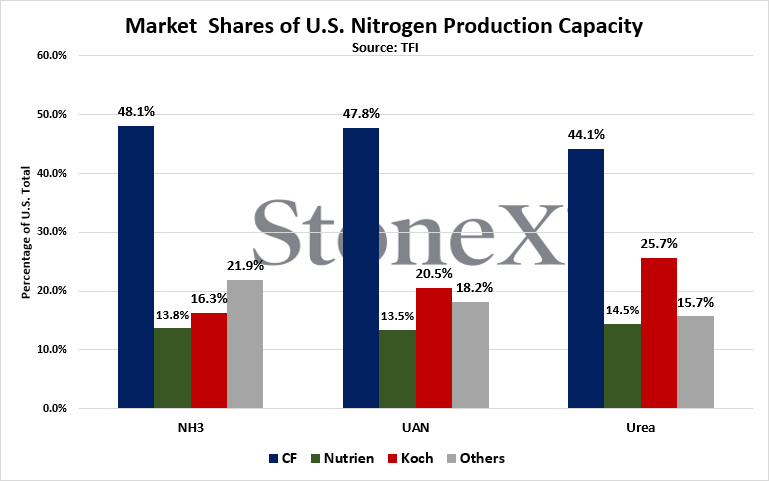
One of the bigger complaints that I have heard during my travels/presentations/etc. is the lack of competition. The term "monopoly" is thrown around a lot. CF Industries earlier this year moved ahead with the purchase of another nitrogen production facility based in Waggaman, LA. Those cries have been refreshed following the news of Koch's purchase.
We decided to take a look and see if the complains were warranted...and unfortunately it appears that they are. A monopoly is a single company controlling the market. A better term would be oligopoly for what is happening in nitrogen which is a few companies controlling it. For UAN, the big 3 own a little over 80% of UAN production.
Now, from a bare bones fundamental POV, Koch's move does nothing to the S&D. Production rates at the plant are likely going to remain unchanged so that should not shift the market. However, the focus is likely going to be on the lack of competition as it often times is viewed as a way to keep market values higher.
It is highly likely that this purchase will flow thru regulatory bodies with little to no issue...but with some U.S. Senator's putting forth fertilizer visibility bills, I would say the chance that it gets more scrutiny than others is higher. If nothing else so that D.C. can say they are working for the farmer. Still, I wouldn't hold my breath that this doesn't go thru.
N.A. UAN ends the year "high-priced" vs urea
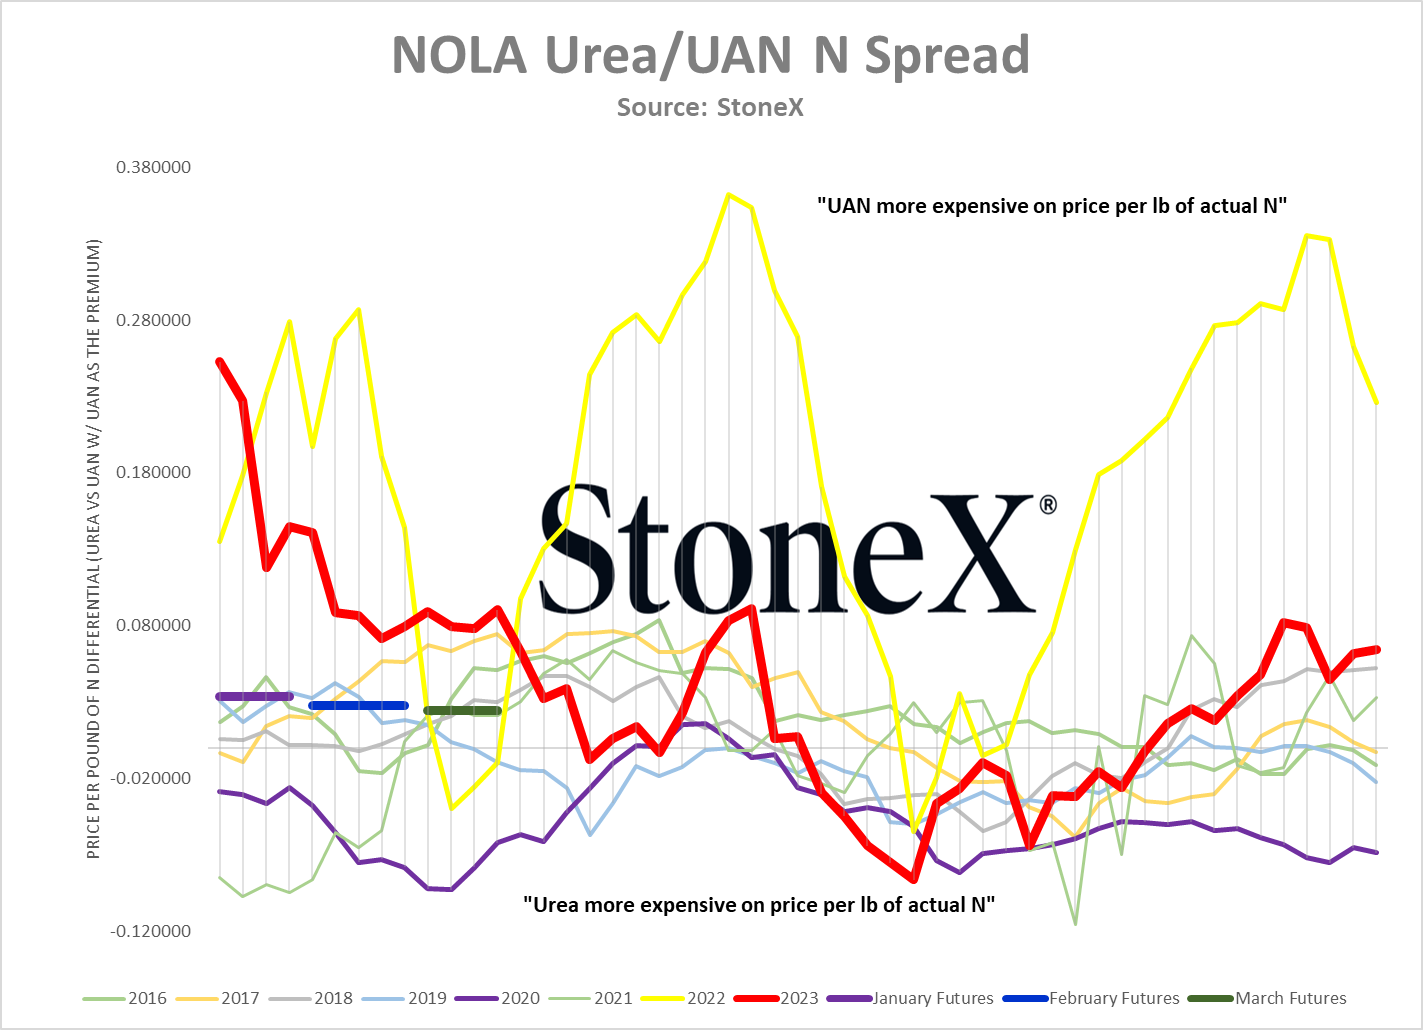
The North American UAN market/S&D is completely separate from the urea market/S&D. Both products can and have traded independently from each other. However, over the years, they trend with each other. If one gets out of line vs the other, demand has its say and it corrects.
NOLA UAN is ending the year a bit on the high side when compared against NOLA urea on a price per pound of actual N. That could have UAN suppliers/manufacturers spooked and discussing if a price correction is in order. Last year is still VERY fresh in the mind of the supplier. As we closed in on the end of 2022, we spent a lot of time talking about how out of line UAN was in comparison and how a demand reckoning was coming. Many brushed it off...and ultimately paid the price as farmers across N.A. switched to save significant money. That situation has cause the supply side to make sure UAN stays MUCH closer in line with urea.
This does not mean switching will happen or a price correction is coming. UAN inland values typically trade at a narrower basis to NOLA than other fertilizers, meaning inland prices are "cheap" in comparison. Also, urea logistics are struggling and higher priced. That means that the inland differential is in better shape than NOLA.
Still, if you have the option between the two, make sure to continue talking to your retailer and make the best decision for your farm.
NOLA/New Orleans, Louisiana
Number 2 global importer in 2022
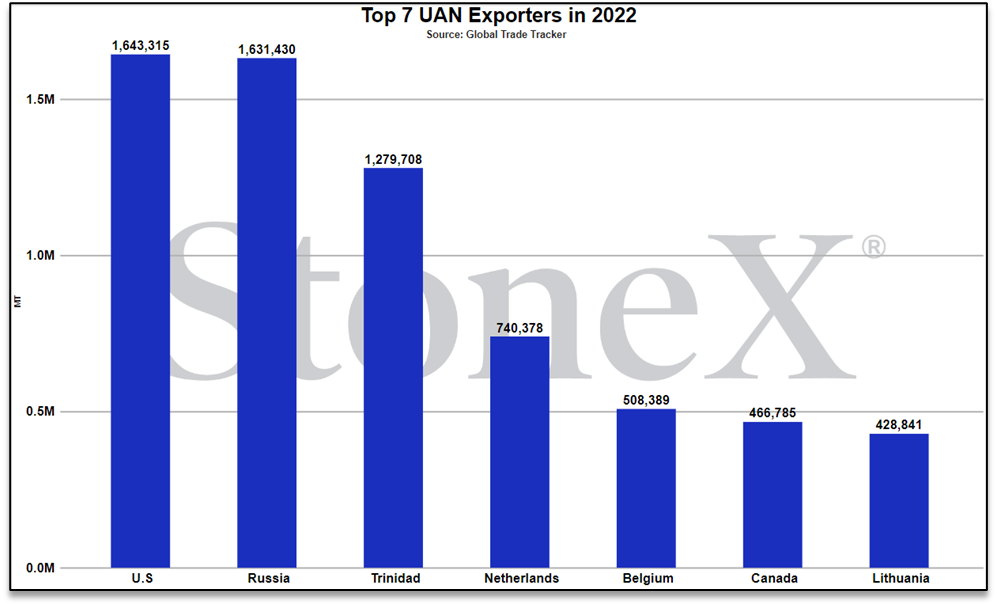
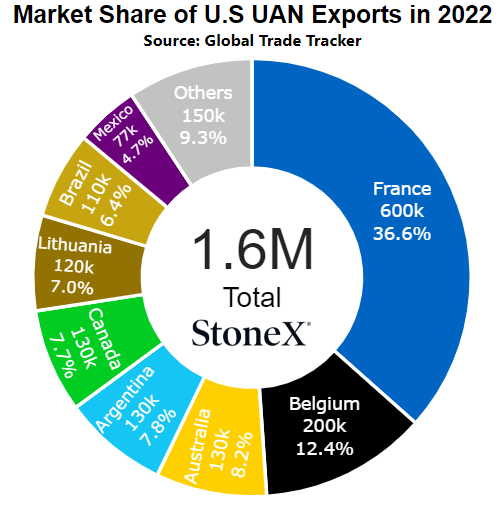
Number 1 global exporter in 2022
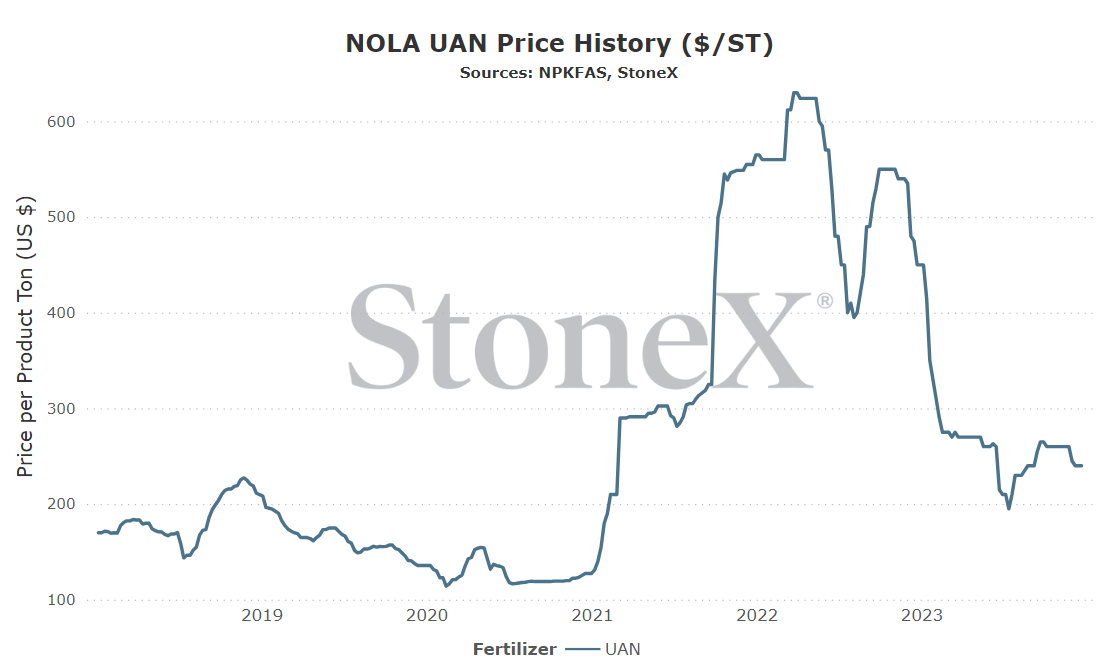
Price Comparisons
Vs 30 days ago - -8% or approximately $20 lower
Vs 90 days ago - -9% or approximately $25 lower
Vs 6 months ago - +12% or approximately $25 higher
Vs 1 year ago - -47% or approximately $210 lower
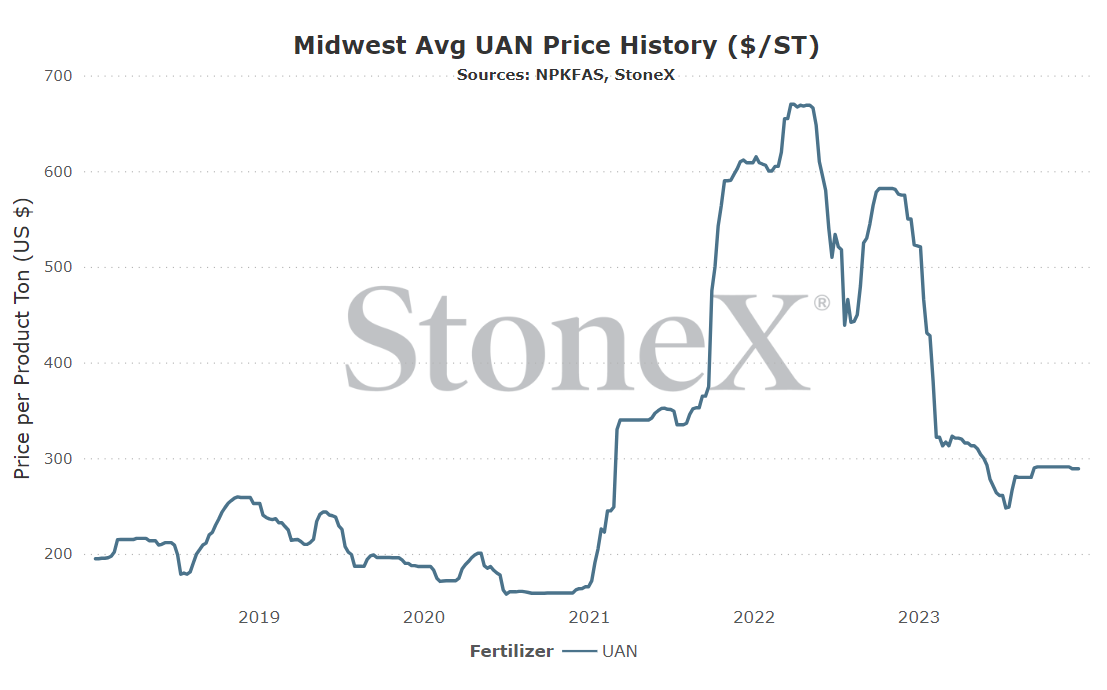
U.S. Midwest Average
Vs 30 days ago - -1% or approximately $2 lower
Vs 90 days ago - -1% or approximately $2 lower
Vs 6 months ago - +9% or approximately $25 higher
Vs 1 year ago - -45% or approximately $234 lower
Black Sea (Russia)
Number 2 global exporter in 2022
Price comparisons
Vs 30 days ago - -8% or approximately $16 lower
Vs 90 days ago - +5% or approximately $9 higher
Vs 6 months ago - +46% or approximately $56 higher
Vs 1 year ago - -59% or approximately $262 lower
- North American inventories are still snug – N.A. started this fertilizer year (July 1) very low on inventories following a better than expected spring run. Production issues limited anticipated supplies. Every ton imported is nearly met ton for ton with an export. Add all of these together with a continued expectation of 90+M acres of corn in 2024 (plenty of N demand) and you get a market that isn't terribly long product.
- U.S. exports continue to find a home in Europe – some continue to point to imports from Russia, stating that the imports should help supplies be more than plentiful. Now, the imports are coming fairly well (almost three quarters of a million tons July thru October), but exports are flowing just as well. Unfortunately, the import/export situation is nearly balanced. We are not gaining any ground.
- Urea bullishness could lead to UAN bullishness – as always, while urea/UAN/NH3 can and sometimes do work on their own S&D's, ultimately they all have to trend together or risk gaining too much or losing too much demand. If we suddenly start to see bullishness in the urea market as some are expected, UAN will be poised to do the same.
- Russian imports continue to arrive in the U.S. – as mentioned above, Russia continues to send a lot of UAN to the U.S. (around three quarters of a million tons July thru October) which does help build supplies for N.A. It also doesn't help the global outlook that Russian FOB (at origin) values are very low as they bear the brunt of the inefficient market. Unless N.A. values start to rise, Russia will continue to make the world appear bearish.
- European natural gas values falling could restart production – do we think restart announcements in Europe is imminent? Absolutely not. However, as Dutch TTF values continue to fall, the chance continues to rise. In fact, a pop in global nitrogen values could be all that is missing. As Dutch values have fallen, so too have nitrogen values. If inputs continue to drop and outputs suddenly increase, we may be to restart announcements before we know it.
- Urea bearishness could lead to UAN bearishness – if urea is bullish, so too should UAN. The opposite also holds true. There are plenty out there that think urea remains under pressure. If that is the case, UAN is going to struggle as the market sees little to no reason to step forward. The longer that happens, the more nervous the manufacturing/supply side of the equation gets...and the easier it is to justify dropping pricing.
We believe that only looking at the flat price of either grains or fertilizer can be misleading:
-
Only selling grain can hurt you if fertilizer prices rise substantially
-
Only buying fertilizer can hurt you if grain prices fall
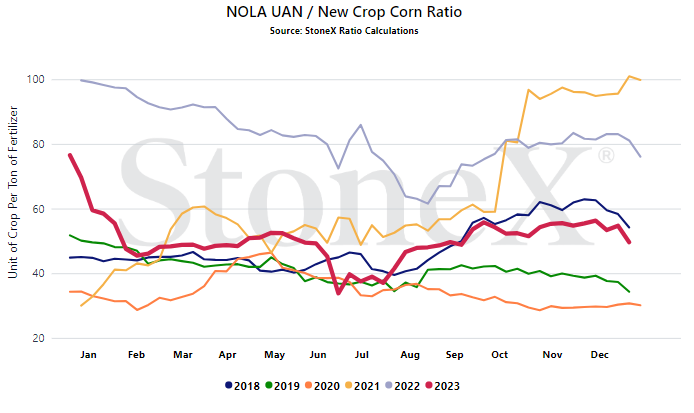
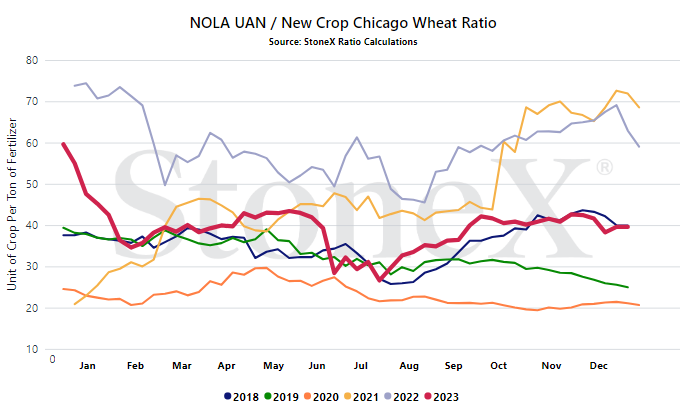
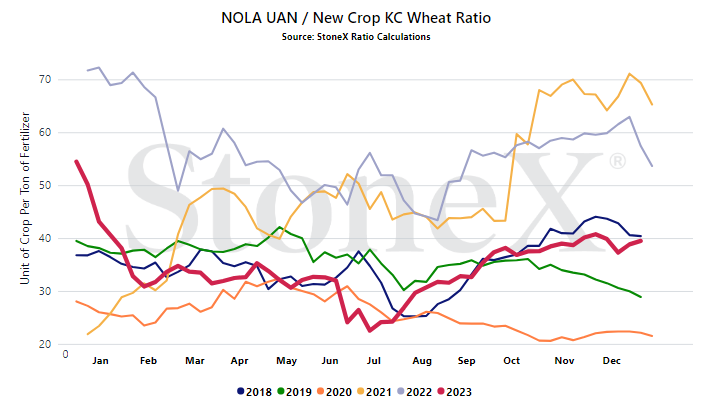
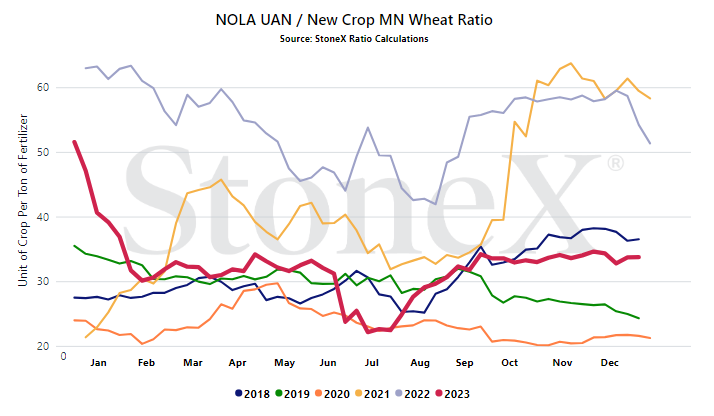
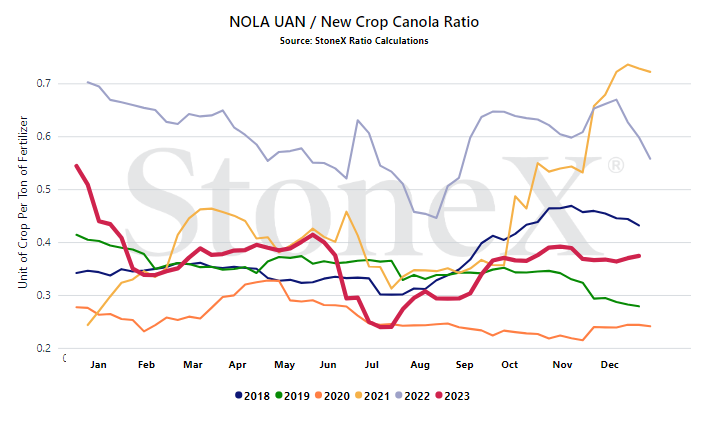
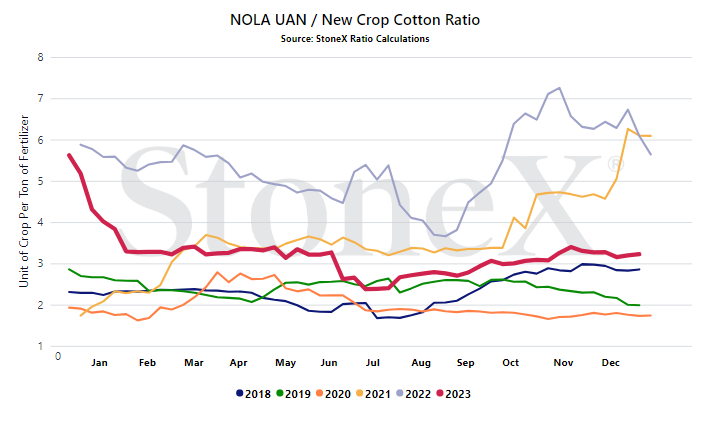
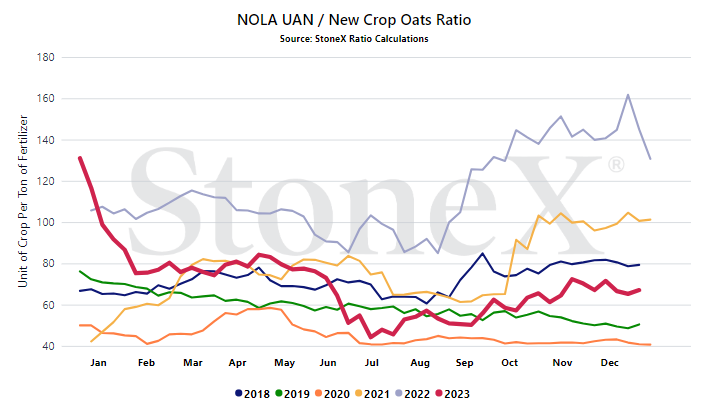
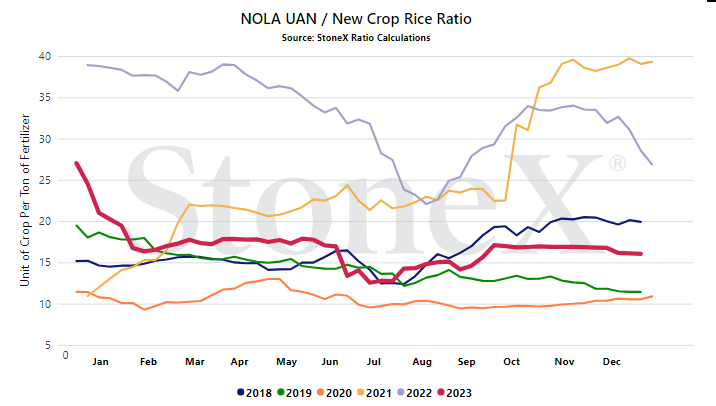
We look at the ratio "value" to get a better indication of where we are or how many bushels of X does it take to pay for 1 ton of fertilizer.
Would you rather:
-
Spend 100 bushels to pay for 1 ton of UAN
-
Spend 60 bushels to pay for 1 ton of UAN
When we compare the current ratio value against recent years, we start to see if we are high or low.
YOUR VALUES WILL LOOK DIFFERENT
This graph looks at the NOLA UAN price vs the flat grain price. There are no logistics on either product. Your location will look different due to fertilizer logistical costs, grain basis, etc.
- European production rates - as long as part of Europe's production remains offline, that removes a decent chunk of supply from the market while also adding a decent chunk of demand as the region looks to replace production that was lost. However, the opposite also holds true. It could create a pretty strong shift in market sentiment so needs to be watched.
- Canadian/Australian governments reversing decisions on Russia - in fact, we could/should add Europe as a whole to the mix. If we suddenly see government back off of earlier restrictions on Russia fertilizer, which is very possible, we could see the tides turn. Russia would suddenly see their FOB origin prices rally as they become more efficient. N.A. values likely become weak with U.S. manufacturers losing that export option (though likely Russian imports slow as well, helping to soften the blow). Europe/Canada/Australia likely sees values lower as they gain back normally efficient supply routes. Politics can change the game...
- Urea markets - as N.A. urea values were under siege (i.e. lower pricing), UAN eventually had to succumb to the pressure to make sure it didn't lose demand like last winter. The opposite can and likely would hold true if urea started to rally. The UAN market is its own beast, but it is closely paired with urea.
StoneX Ratio Calculation
The ratio calculation is derived from Bloomberg historical grains values as well as fertilizer values from StoneX, NPKFAS, and Argus.
The calculation is simply dividing the fertilizer price by each grain price.
All data was sourced from StoneX unless otherwise noted.
This material should be construed as market commentary, merely observing economic, political and/or market conditions, and not intended to refer to any particular trading strategy, promotional element or quality of service provided by the FCM Division of StoneX Financial Inc. (“SFI”), StoneX Financial (Canada) Inc. (“SFFC”) or StoneX Markets LLC (“SXM”). SFI, SFFC and SXM are not responsible for any redistribution of this material by third parties, or any trading decisions taken by persons not intended to view this material. Information contained herein was obtained from sources believed to be reliable, but is not guaranteed as to its accuracy. Contact designated personnel from SFI, SFFC or SXM for specific trading advice to meet your trading preferences. These materials represent the opinions and viewpoints of the author, and do not necessarily reflect the viewpoints and trading strategies employed by SFI, SFFC or SXM. The FCM Division of StoneX Financial Inc., a subsidiary of StoneX Group Inc., is a member of the National Futures Association (“NFA”) and registered with the U.S. Commodity Futures Trading Commission (“CFTC”) as a futures commission merchant and commodity trading advisor. StoneX Financial (Canada) Inc. is currently registered as a Futures Commission Merchant or equivalent in all provinces of Canada and is a member of the Investment Industry Regulatory Organization of Canada.




