July Seasonality Key Points
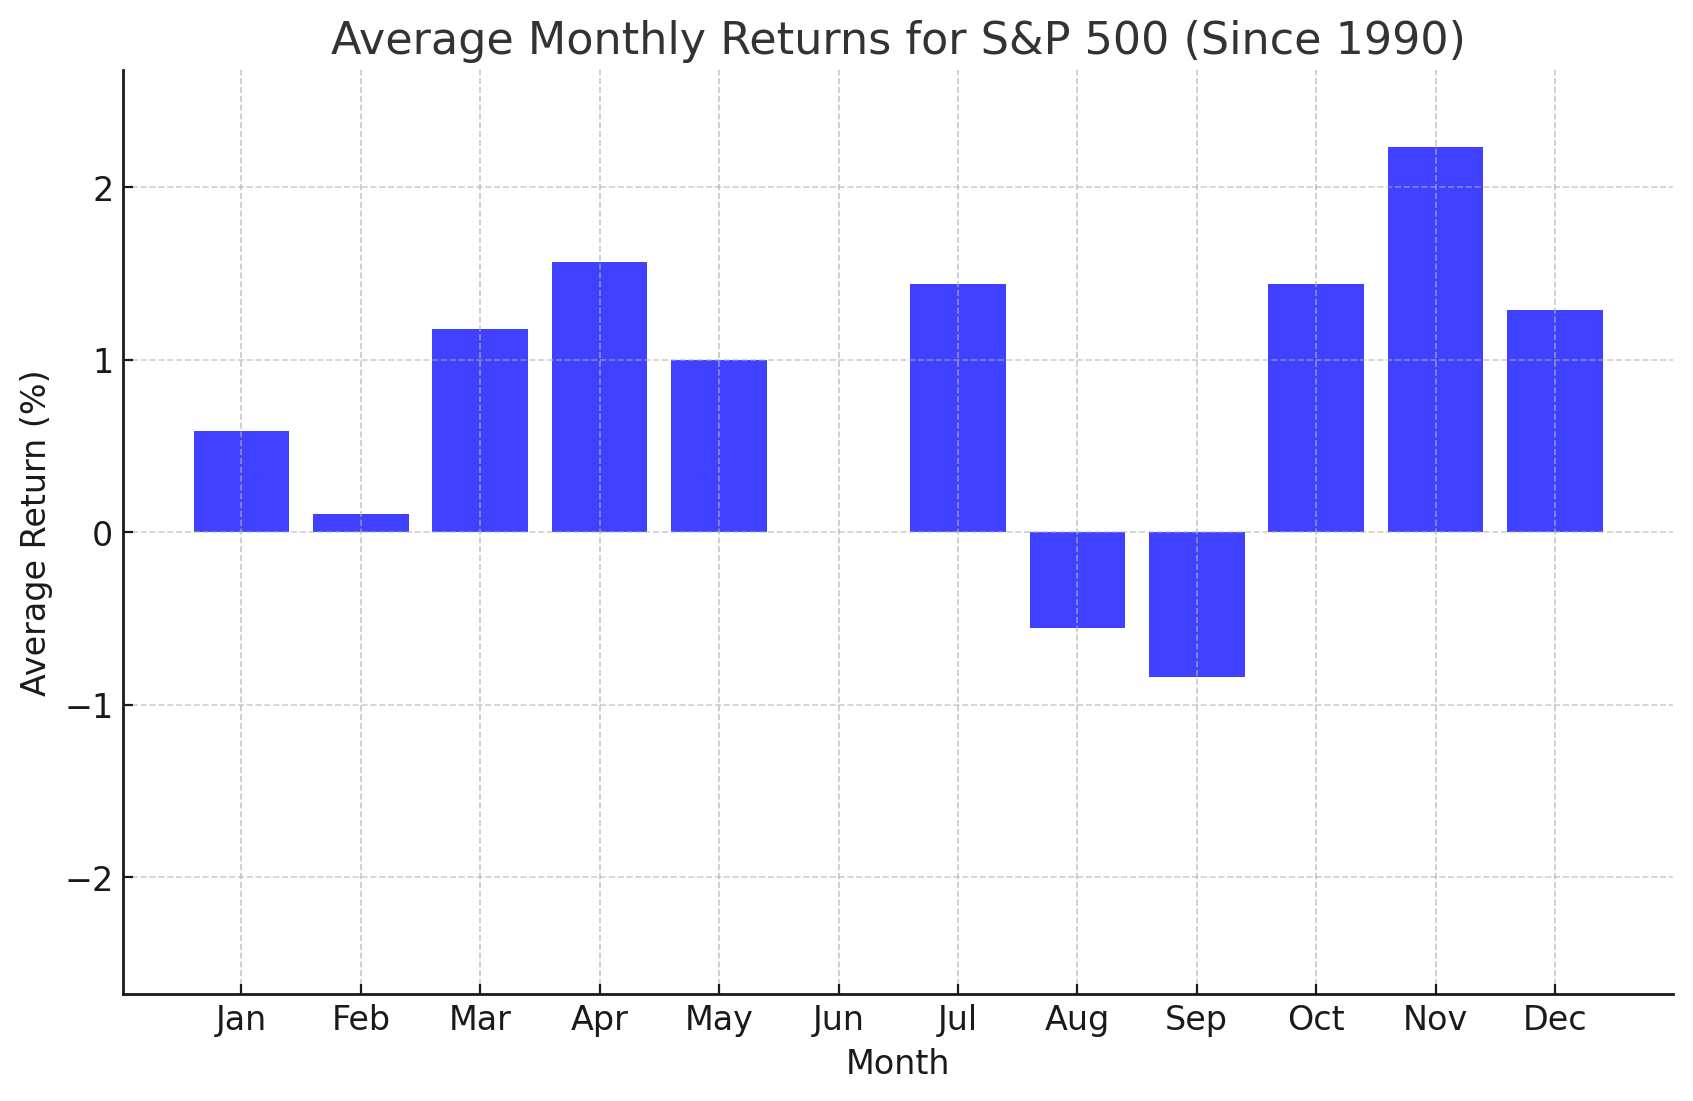
- Historically, July has been a positive month for US stocks, with the broad S&P 500 index sporting an average (price-only) return of +1.4% over the last 35 years.
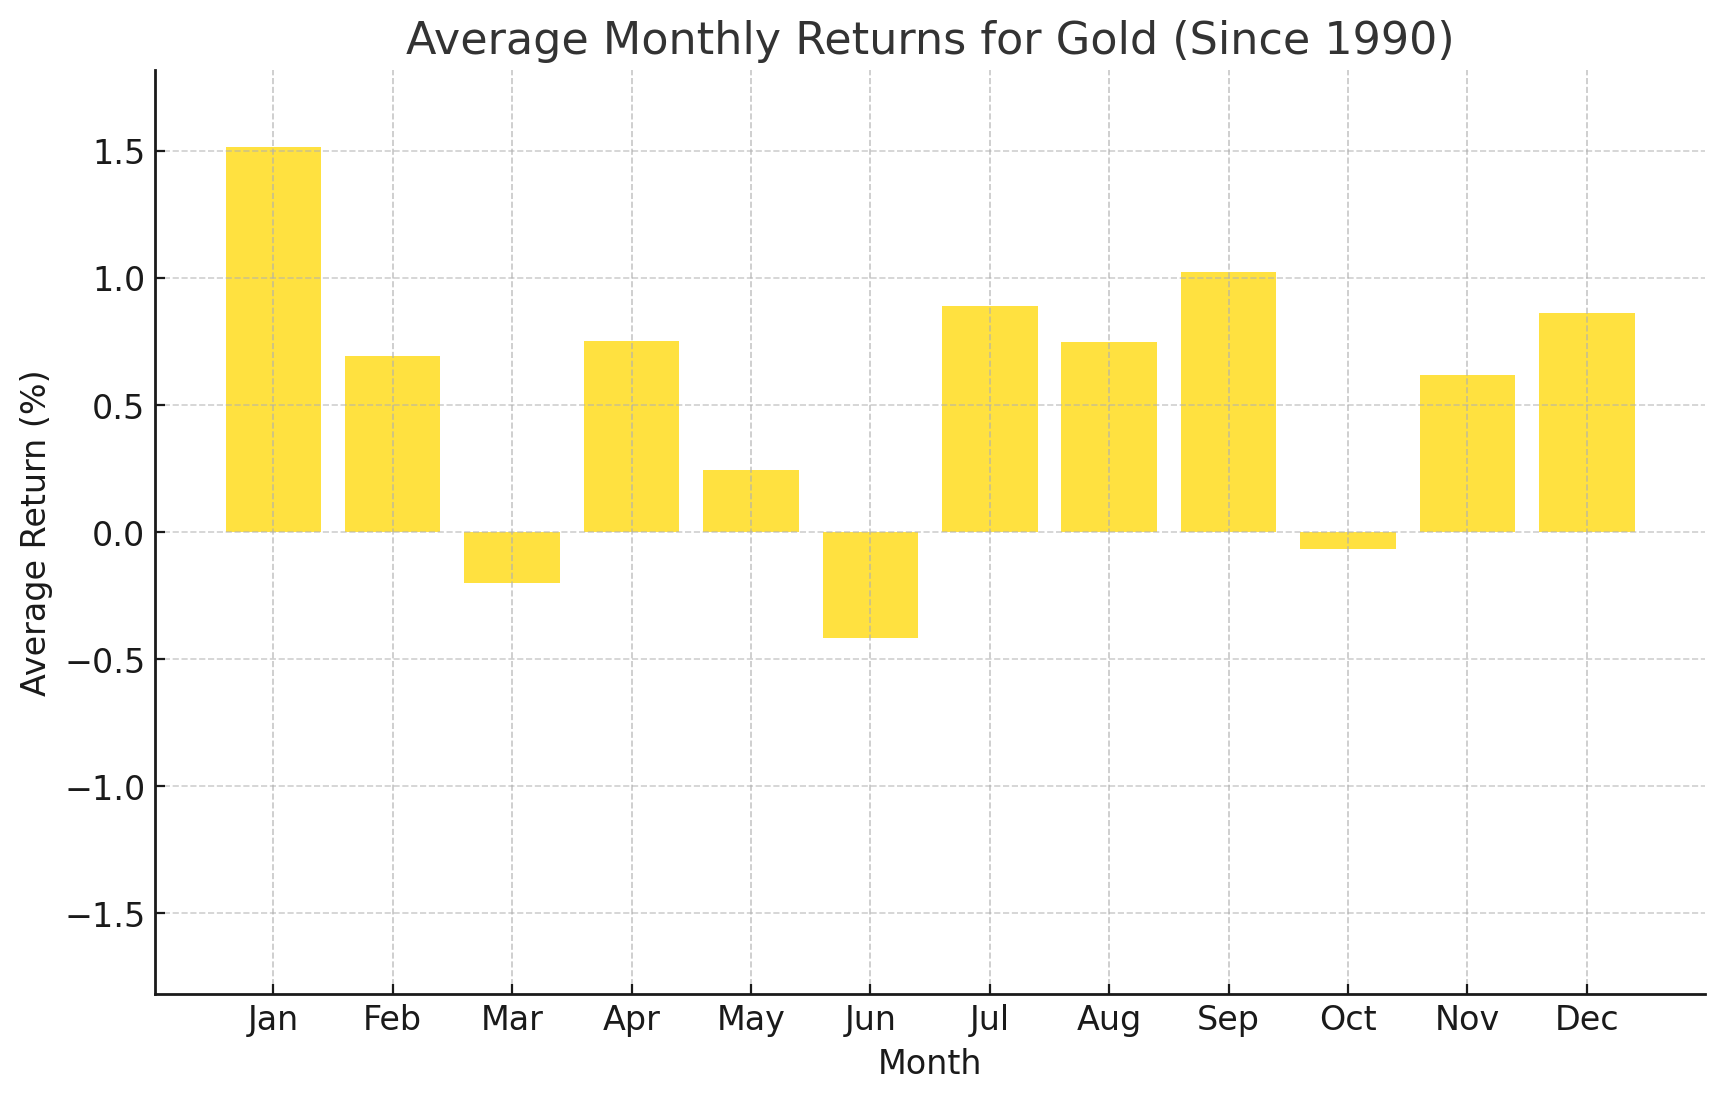
- July has historically been a strong month for gold performance, with an average gain of +0.9% going back to 1990.
- After a -20% drop in June, Oil prices could remain under pressure in July as long as the fragile ceasefire between the US and Iran holds.
The beginning of a new month marks a good opportunity to review the seasonal patterns that have influenced the markets since 1990.
As always, these seasonal tendencies are just historical averages, and any individual month or year may vary from the historic average, so it’s important to complement these seasonal leans with alternative forms of analysis to create a long-term successful trading strategy. In other words, past performance is not necessarily indicative of future results.
S&P 500 Seasonality – S&P 500 (Price-Only) Chart
 Source: TradingView, StoneX. Please note that past performance is not necessarily indicative of future results.
Historically, July has been one of the most bullish months US stocks, with the broad S&P 500 index sporting an average (price-only) return of 1.4% over the last 35 years. The S&P 500 is coming off a mixed month with the index falling -4% only to rally back and close down only slightly. This move is exactly the “small pullback or consolidation” that we had highlighted as a healthy development for the uptrend last month, and with the stock market rally broadening out in recent months, a resumption to the topside looks more likely than not.
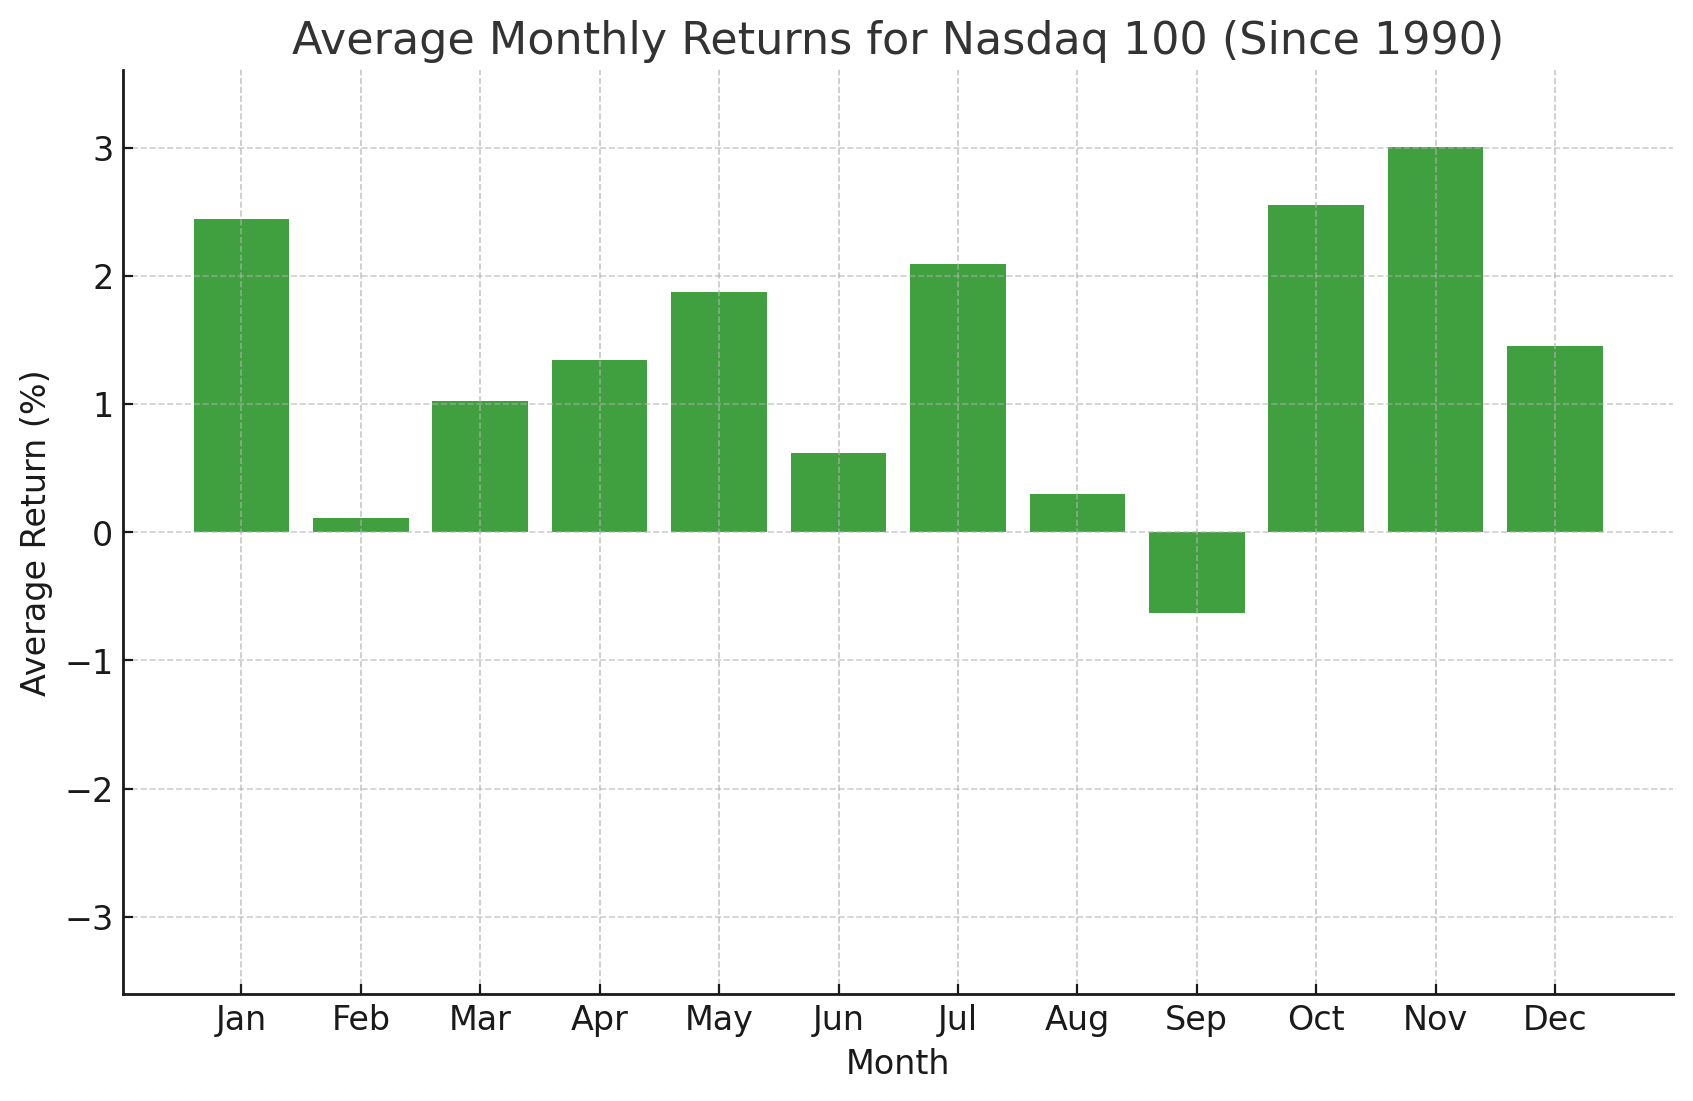
Nasdaq 100 Seasonality – NDX (Price-Only) Chart
Source: TradingView, StoneX. Please note that past performance is not necessarily indicative of future results.
Looking at the above chart, the Nasdaq 100 has historically seen strong performance in July as well, to the tune of a +2.1% average gain since 1990. Like the S&P 500, the Nasdaq 100 recovered from an intra-month swoon in June to close near unchanged, though the pullbacks in previous market leaders like Microsoft (-32% from its highs) and Meta Platforms (-29%) is a potential reason for concern in the tech-heavy index. With AI-related capital expenditures now eating up all of the “hyperscalers” cash flow, these companies are far less compelling investments than they’ve been for most of the last decade, and that could weigh on the broader Nasdaq 100 as we head through the second half of the year.
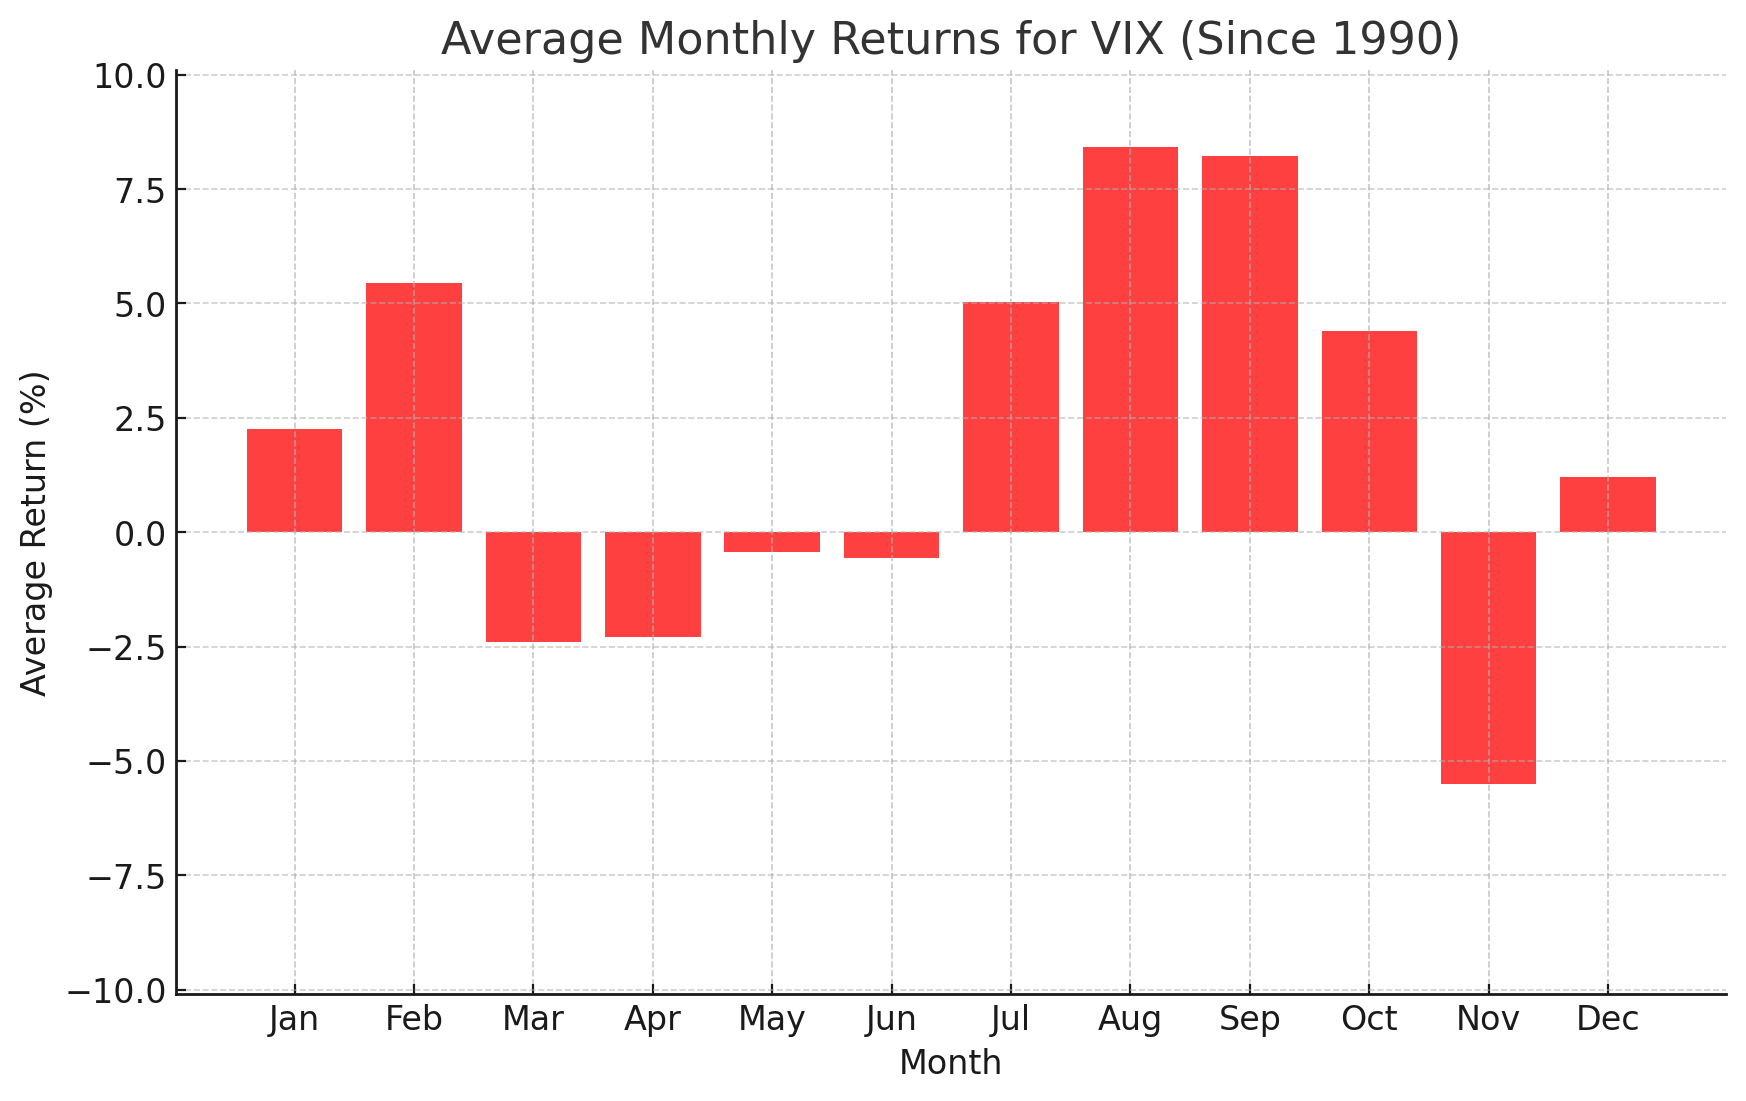
Volatility Index Seasonality – VIX Chart
Source: TradingView, StoneX. Please note that past performance is not necessarily indicative of future results.
July has historically been a month where stock market volatility rises, with the VIX index rising by an average of +5% since 1990. In a mirror image of the stock indices, the VIX above 23 in June only to reverse back down and close near unchanged in the 16s by the end of the month. With the hostilities in the Middle East seemingly behind us, the focus now shifts to Q2 earnings season, with many mega-cap companies facing a high bar to impress analysts after years of strong performance.
Gold Seasonality – XAU/USD Chart
Source: TradingView, StoneX. Please note that past performance is not necessarily indicative of future results.
Turning our attention to commodities, July has historically been a strong month for gold performance, with an average gain of +0.9% going back to 1990. Gold fell another -11% in June as expectations for higher interest rates around the globe weighed on the precious metal, extending the selloff from the early 2026 highs to -28%. After the big run higher throughout 2024 and 2025, traders are torn between considering it more of a “risk asset” that rallies along with rising sentiment or its more traditional “safe haven” role, and until a dominant framework emerges, gold may continue to struggle.
WTI Crude Oil Seasonality – WTI Chart
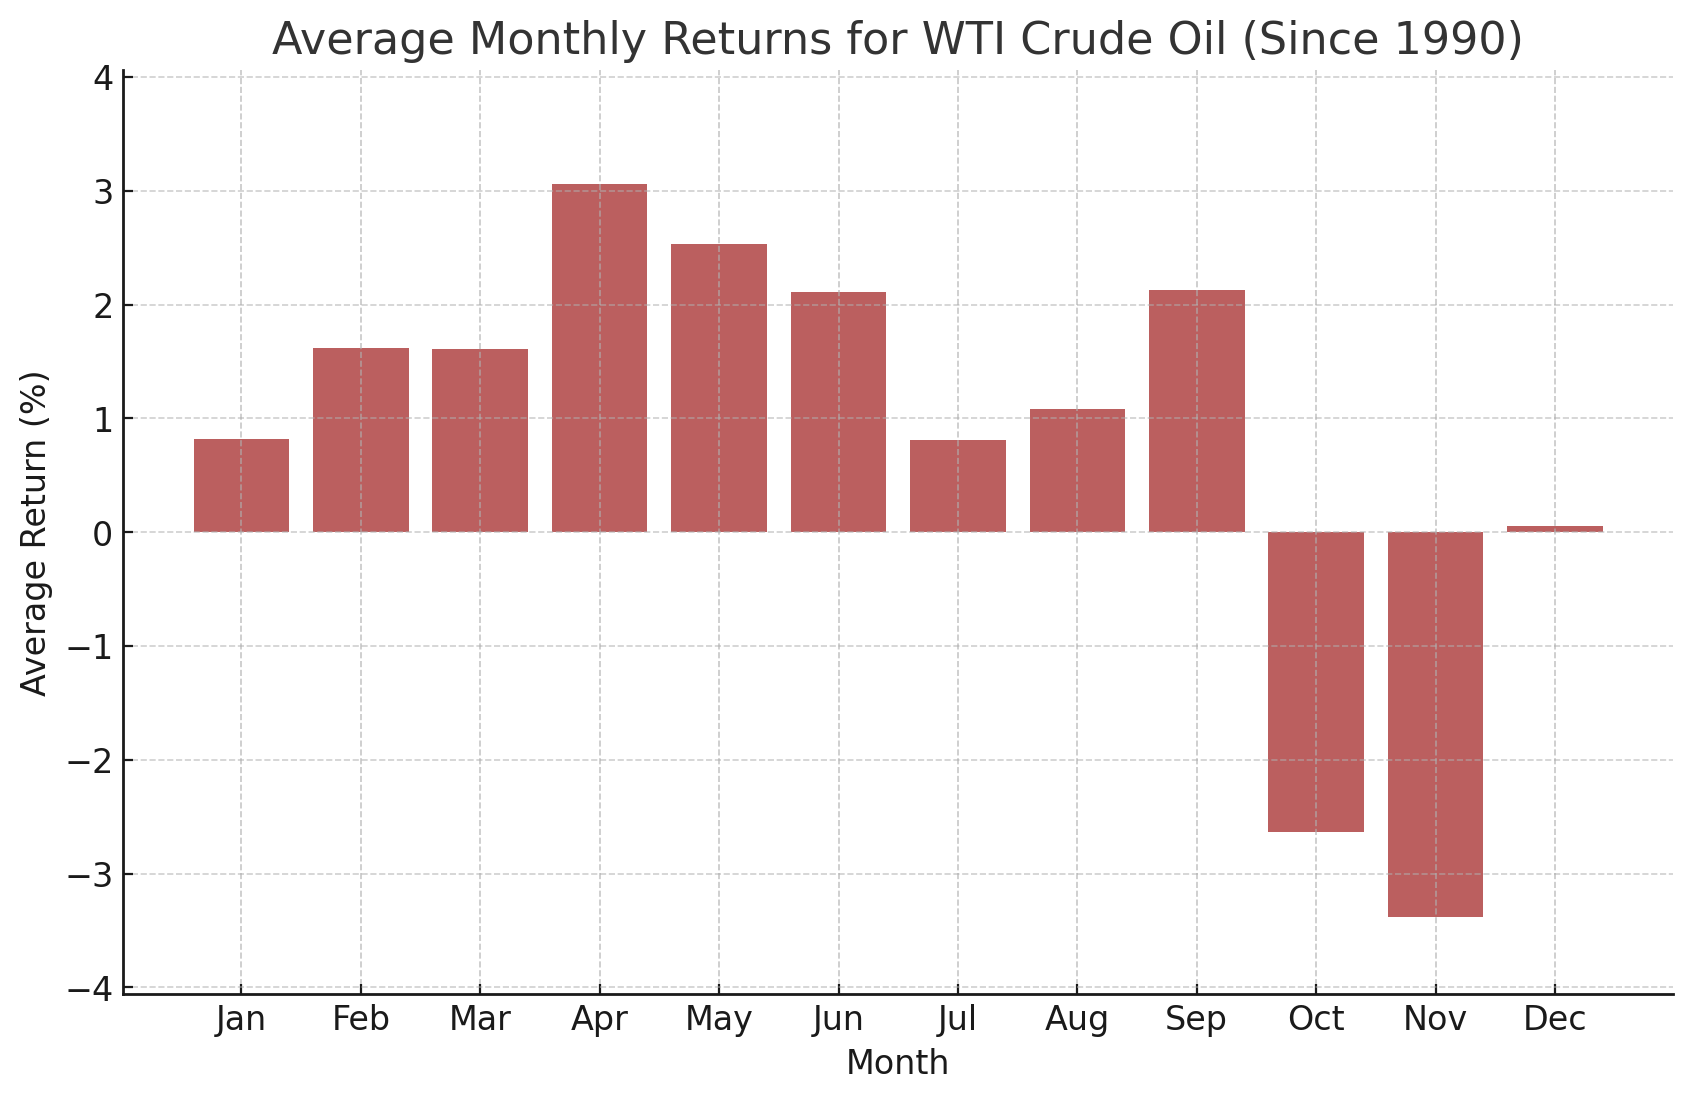
Source: TradingView, StoneX. Please note that past performance is not necessarily indicative of future results.
Last but not least, WTI Crude Oil has historically seen positive performance in July, with an average gain of +0.8% over the last 35 years. Oil was again highly volatile in June, ultimately falling -20% on the month on the reopening of the Strait of Hormuz. As occasional outbreaks of military action between the US and Iran (and Israel and Lebanon) show, the ceasefire remains somewhat fragile, but markets remain content to give peace the benefit of the doubt, and until that changes, oil prices may remain under pressure as supply returns to the market.
As always, we want to close this article by reminding readers that seasonal tendencies are not gospel so it’s important to complement this analysis with an examination of the current fundamental and technical backdrops for the major markets and the global economy.
-- Written by Matt Weller, Global Head of Research
Check out Matt’s Daily Market Update videos on YouTube and be sure to follow Matt on Twitter: @MWellerFX