

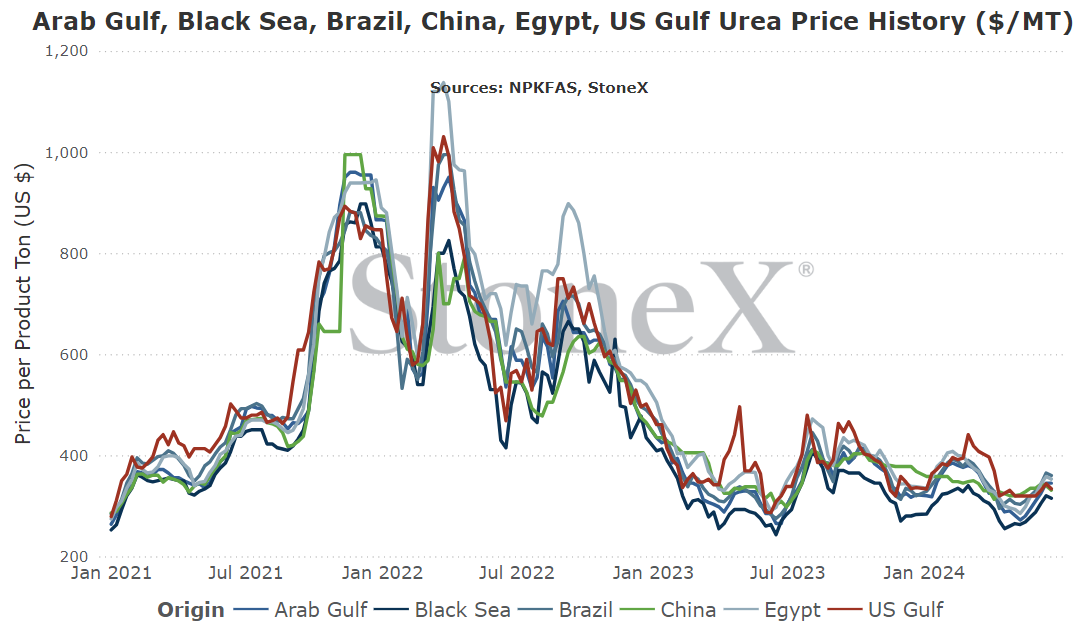
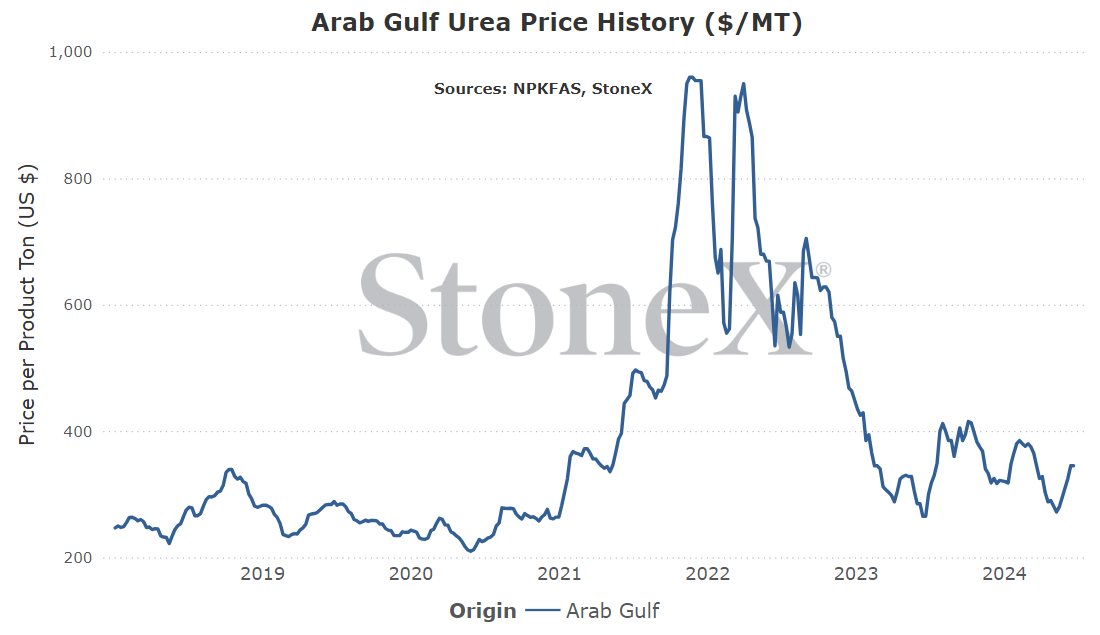
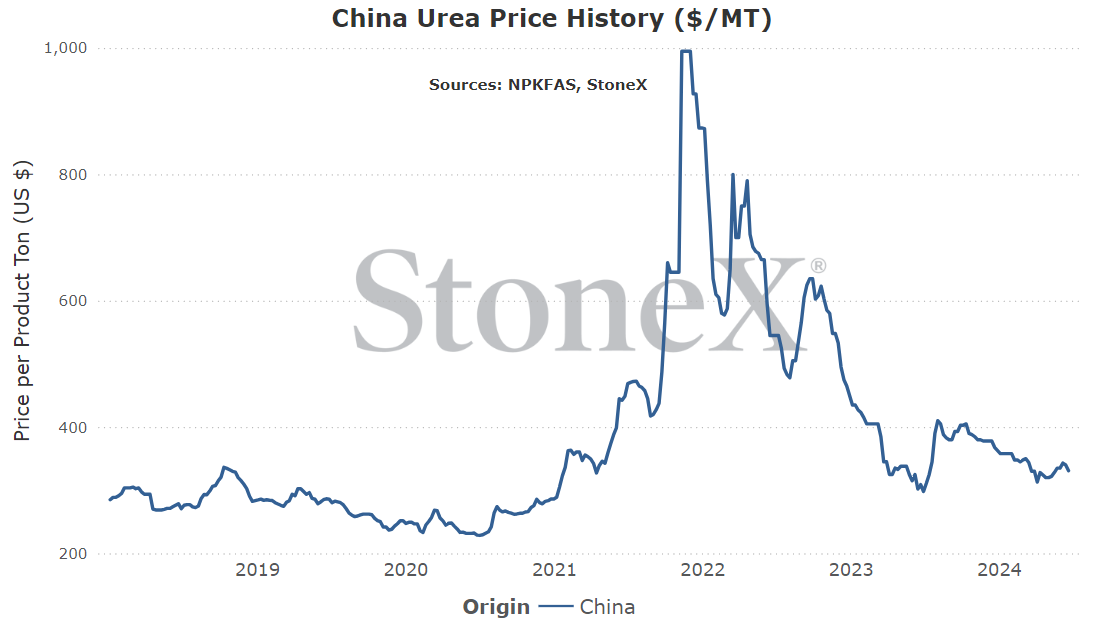
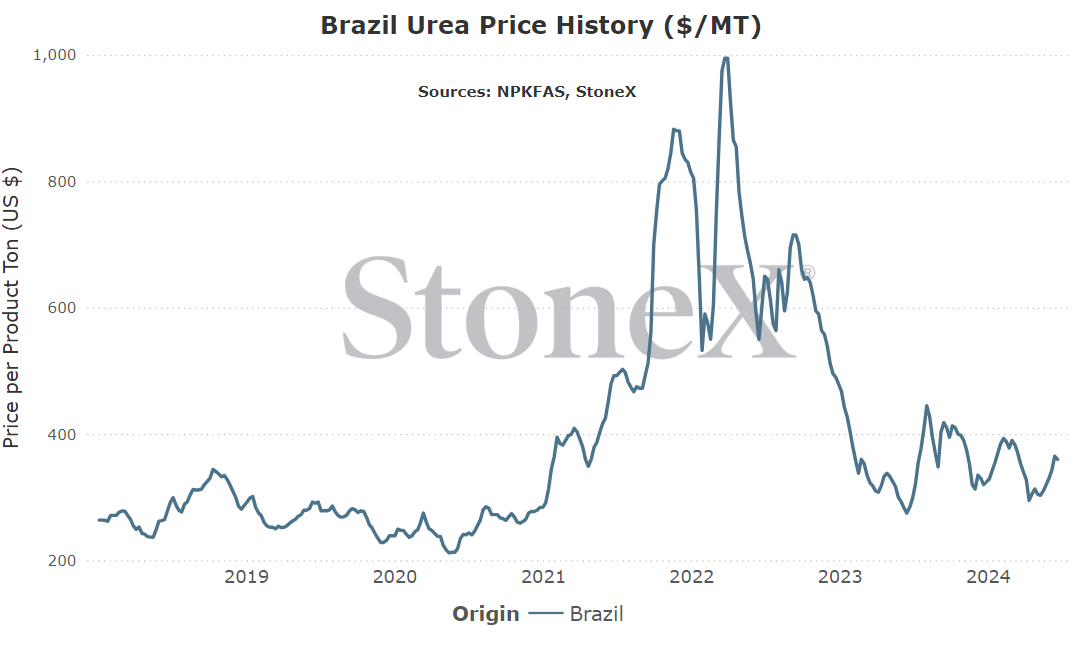
The intention of the below graphs are not to use to say "my price should be X based on this graph". These prices are derived from an FOB price point average. The intent is to show major global price movement trends. Your values will likely have significant basis difference (similar to your local grain price being different than the traded market price).
This graph is labeled as MT in USD currency.
- Offers are due July 8
- Shipment period thru August 27
While no statement of tons being desired has been made by IPL (Indian group handling the purchase), some in the market have assumed between 1 - 1.5MMT. That would be a large block of tons that would help to mop up excess length in the world and perhaps help stabilize values from falling.
But I have my concerns.
For starters, it sounds as though domestic Indian urea stockpiles are healthy. If true, that likely means they do not have to buy. Sure, if values were to come in very aggressively, they could see it as a discount and lock up a lot to prepare for their next run. However, if the market is bold/high on their price offers, you could see them lower the volume or walk away.
Second, the global market has been strong which likely means traders/distributors are long. India presents a solid opportunity to clear long positions. If you have been holding tonnage for a while, you likely have a lot of profit in it. Easier to cut the price to make sure you get to sell in that scenario.
Third, that is a long shipment window. That kind of tells me they are not desperate for product right now. It heightens the chance that they walk away.
Fourth, and the biggest thing for me, is how they played the last tender. If you remember, they initially told the world they had secured over 700K tons. However, by Monday morning, they had slashed that total by almost half. It sent the global urea market reeling. I had put out a tweet about it and it blew up with folks from India praising the government for making another step to being self reliant on urea by 2025. It was a huge political movement. We could see that again.
Ultimately, we have to wait and see how the cards fall. We will not know the story until every detail has been figured out. We have learned the hard way that you do not celebrate too early. Just when it looks like it is done, something can come from right field.
Until then, we wait.
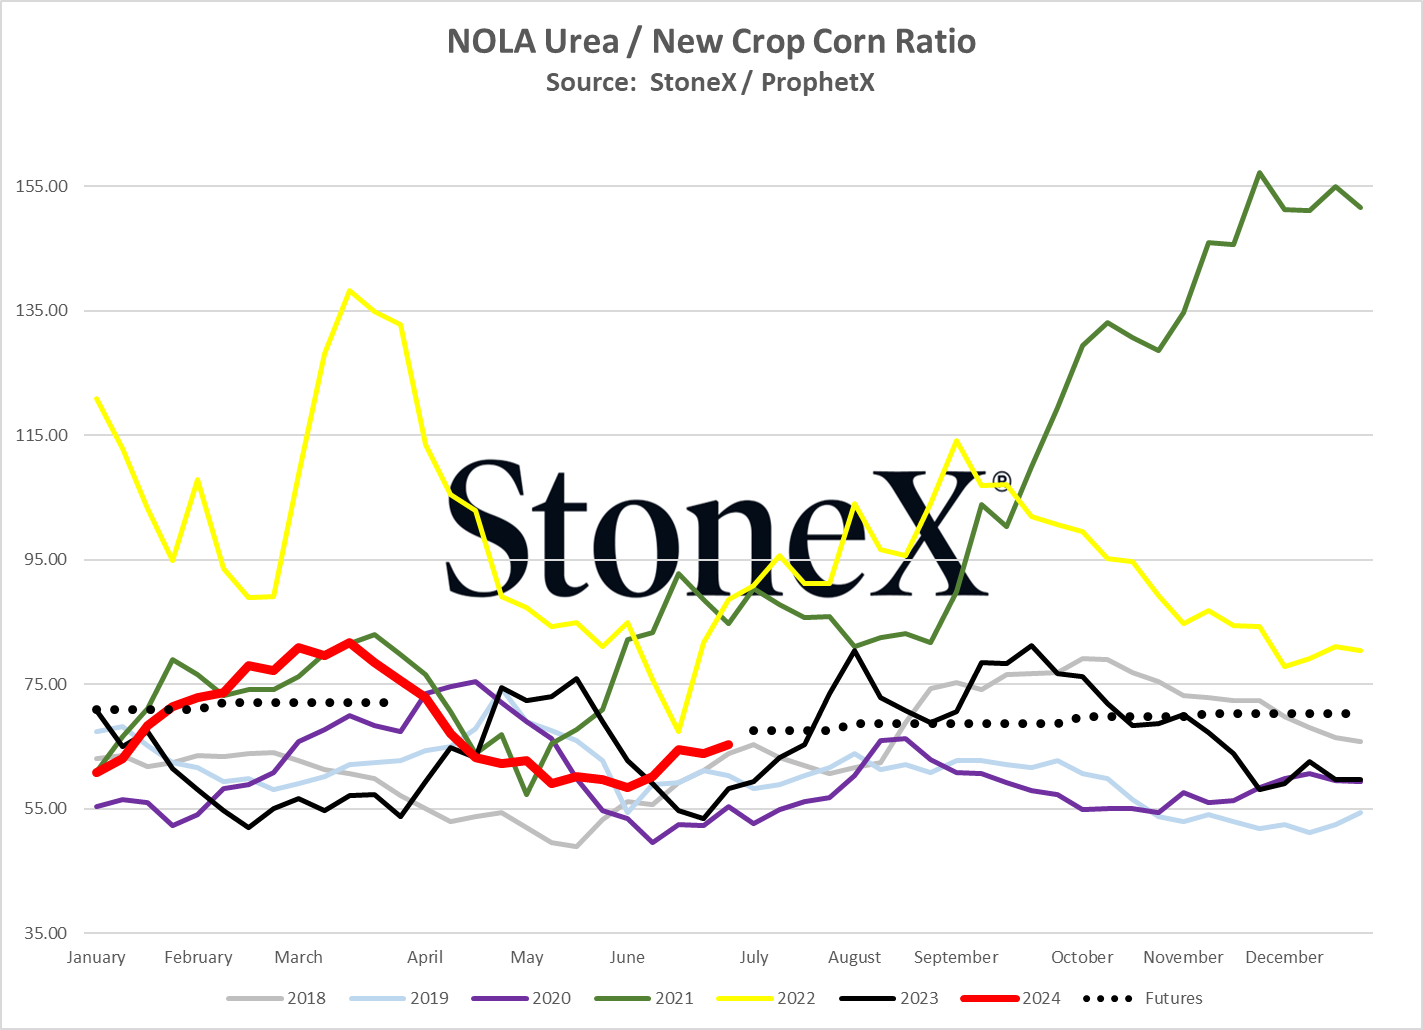
As of this writing:
- NOLA urea barge - $290
- December 2025 corn - $4.58
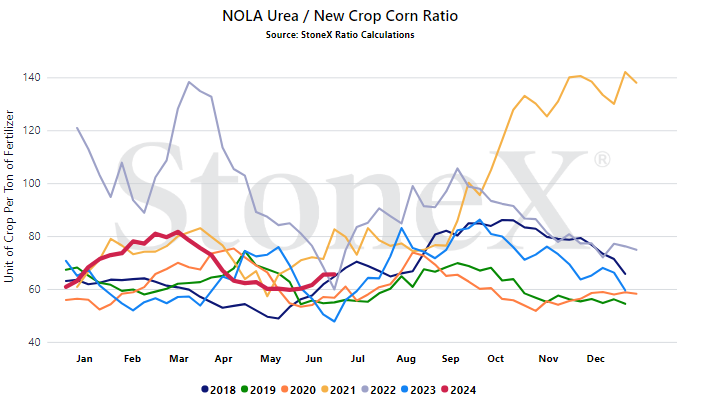
- Current ratio - 63
While that isn't the best relationship that has been seen in recent years, it is far from the worst and continues to show that urea is trying to stay "right priced".
Something that may be worth pointing out. This is less a "I told you so" and more a learning opportunity but back in June, one heck of a value popped up. NOLA urea barge values had dipped into the $270's while corn values had held in at the $4.90's. While the corn price was disappointing vs what we have been enjoying the last few years, it was still solid vs the fertilizer input. The result is that the ratio dipped to 55, a historically aggressive/cheap value. Even though corn looked higher and urea looked lower going forward, it was an opportunity...that turned out to be short lived.
One, if we see this opportunity pop up, we should give it a lot of consideration.
Two, these values need to be ran locally. As I always try to remind, I am looking at this from a 50K foot view. For you, the numbers around you are the ones that truly matter. It is not a difficult chart to run. To get the value:
Price of fertilizer / Price of grain = ratio
If you have a retailer who isn't doing this, would like to but is struggling, let us know.
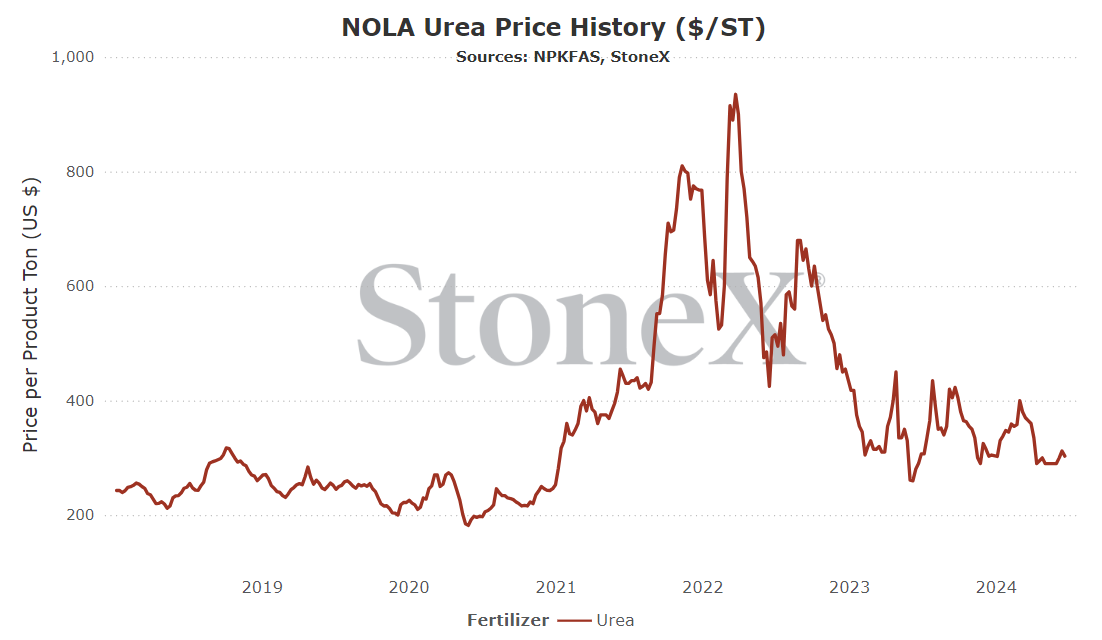
NOLA/New Orleans, Louisiana
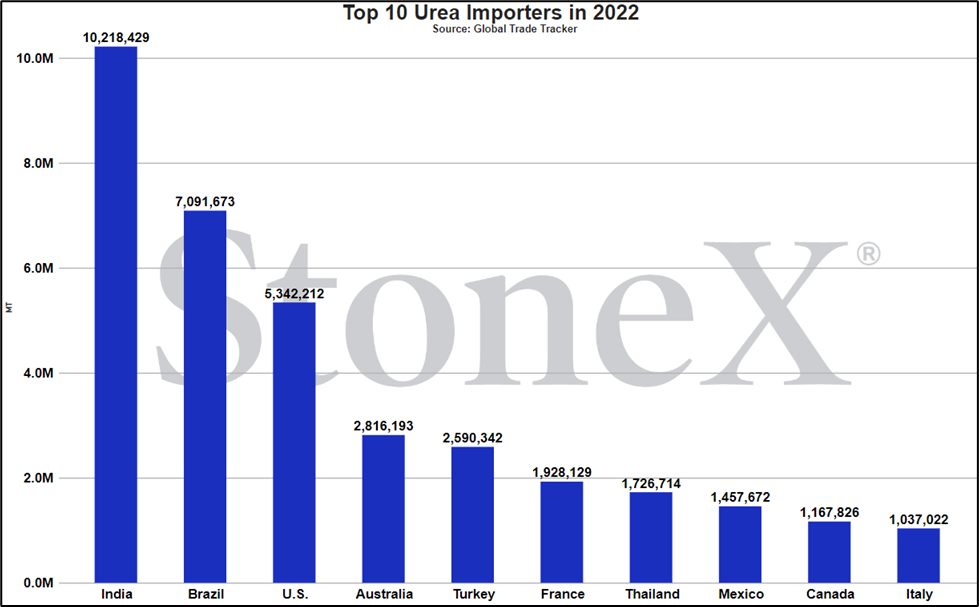
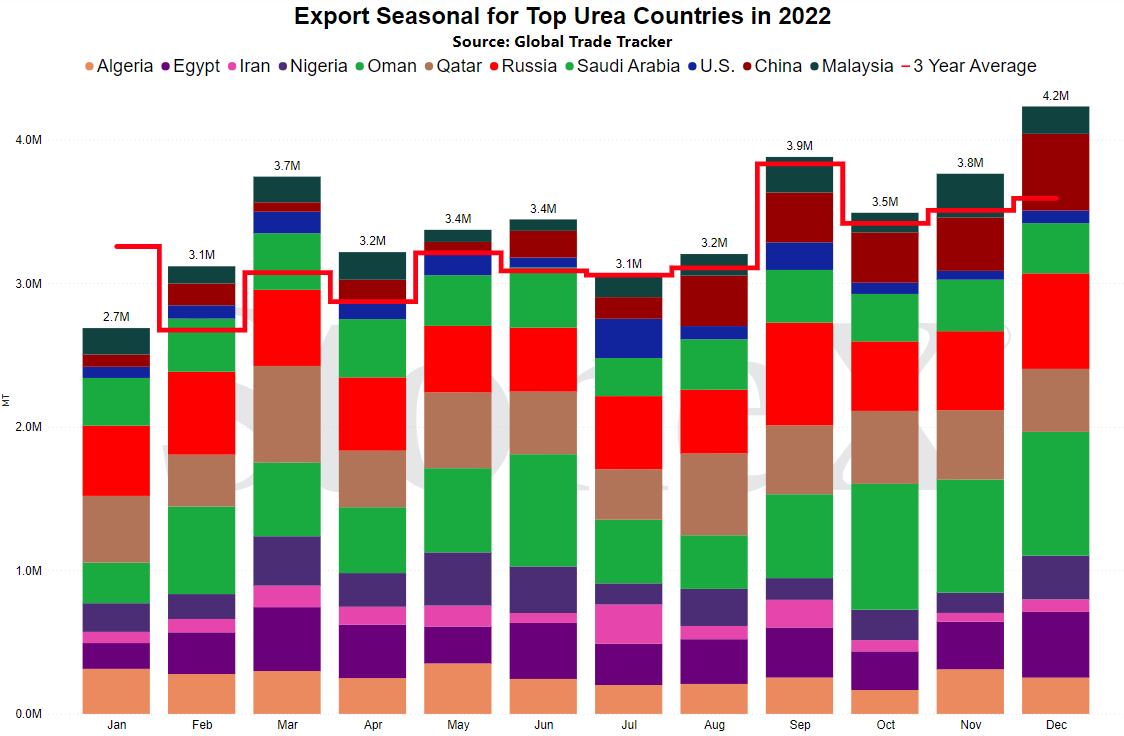
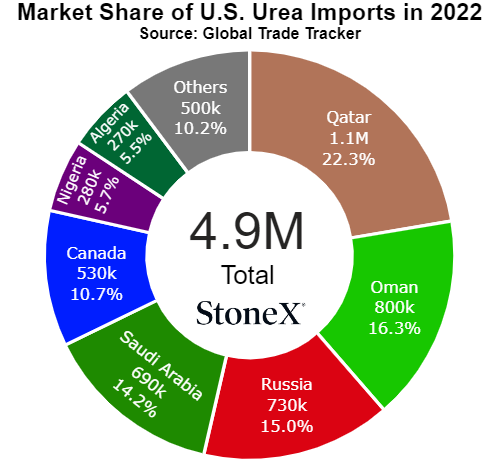
Number 3 global importer in 2022
Price comparisons
Vs 30 days ago - 4% or approximately $13 higher
Vs 90 days ago - -17% or approximately $62 lower
Vs 6 months ago - -1% or approximately $2 lower
Vs 1 year ago - 4% or approximately $13 higher
U.S. Midwest Average
Vs 30 days ago - unchanged vs last month
Vs 90 days ago - -22% or approximately $104 lower
Vs 6 months ago - 3% or approximately $10 higher
Vs 1 year ago - -21% or approximately $97 lower
U.S. Southern Plains Average
Vs 30 days ago - -1% or approximately $5 lower
Vs 90 days ago - -27% or approximately $130 lower
Vs 6 months ago - 1% or approximately $3 higher
Vs 1 year ago - -25% or approximately $120 lower
U.S. Northern Plains Average
Vs 30 days ago - unchanged vs last month
Vs 90 days ago - -19% or approximately $90 lower
Vs 6 months ago - unchanged vs 6 months earlier
Vs 1 year ago - -15% or approximately $69 lower
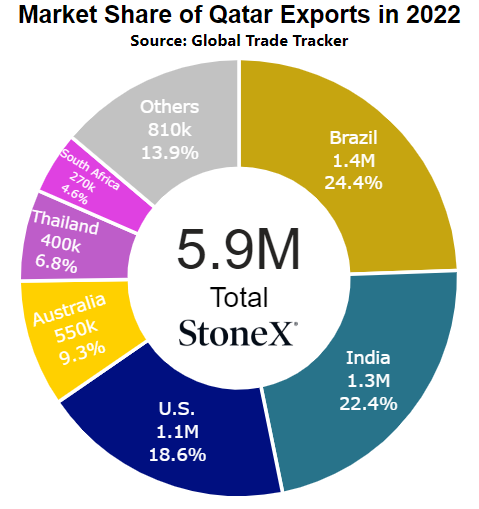
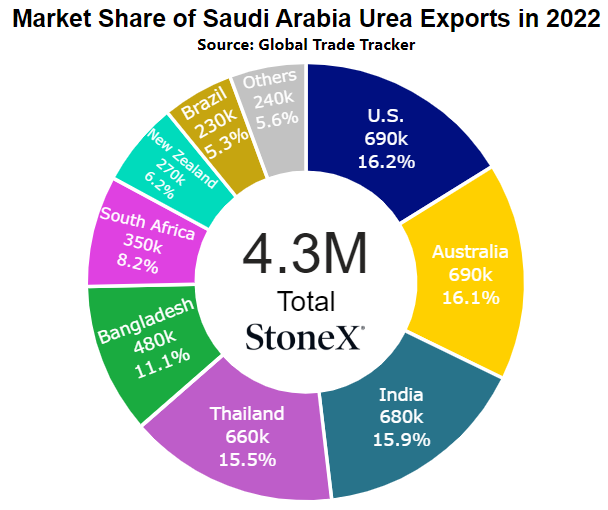
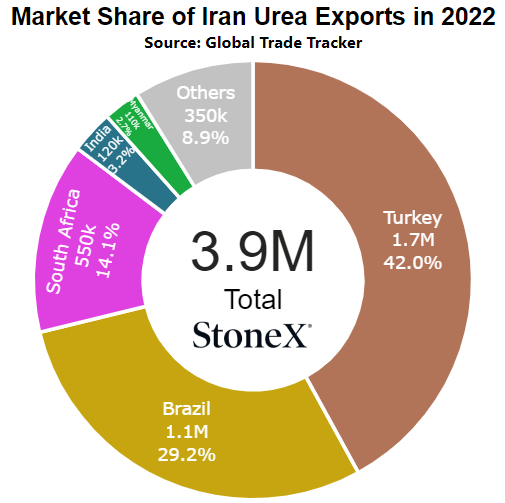
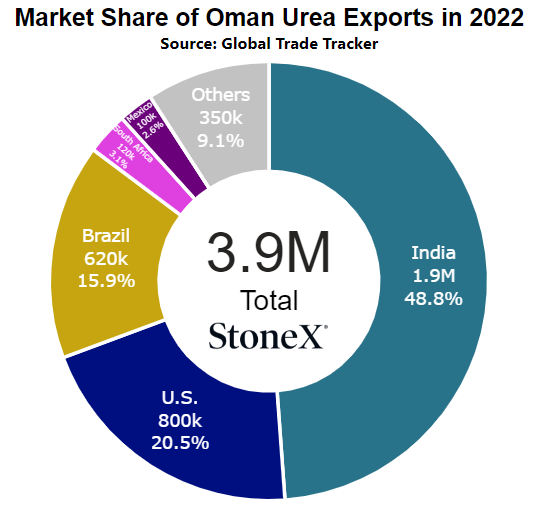
Middle East
Number 1 exporter (as a region, not as individual nations)
Vs 30 days ago - 15% or approximately $45 higher
Vs 90 days ago - -1% or approximately $5 lower
Vs 6 months ago - 6% or approximately $18 higher
Vs 1 year ago - 28% or approximately $75 higher
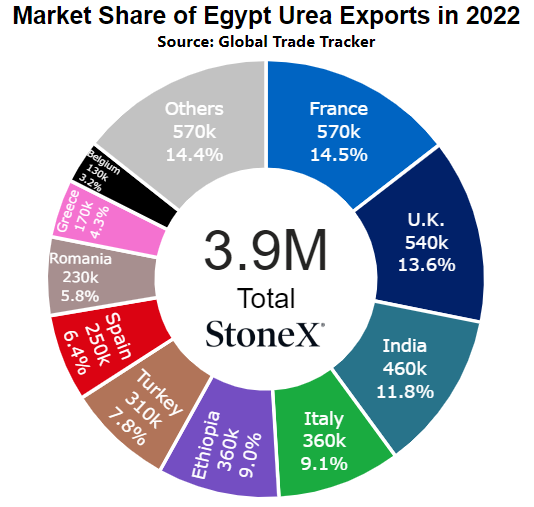
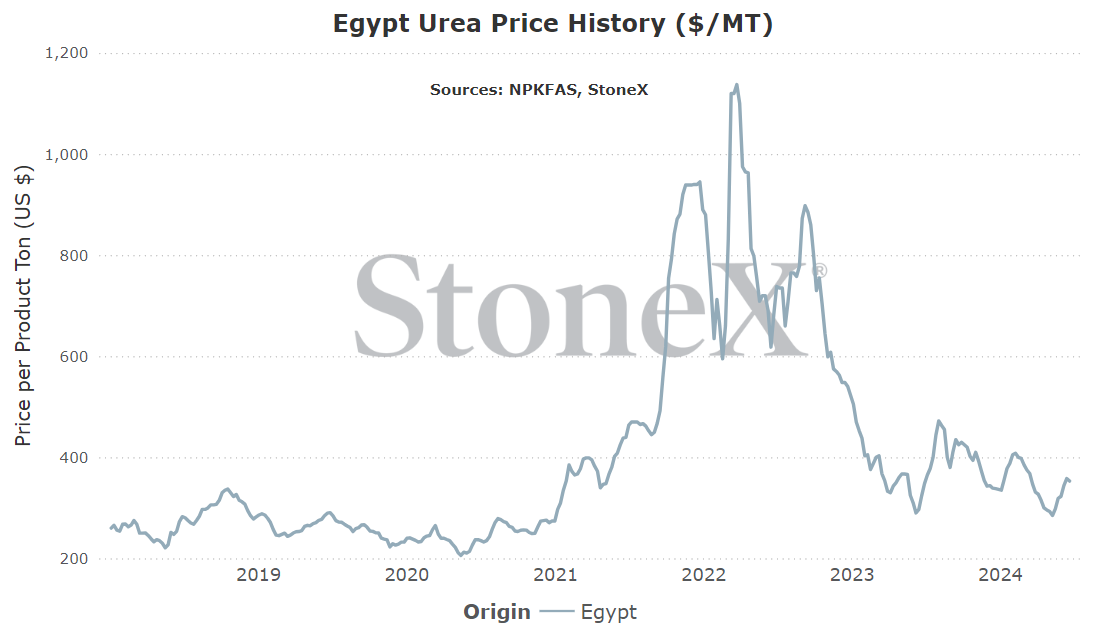
Egypt
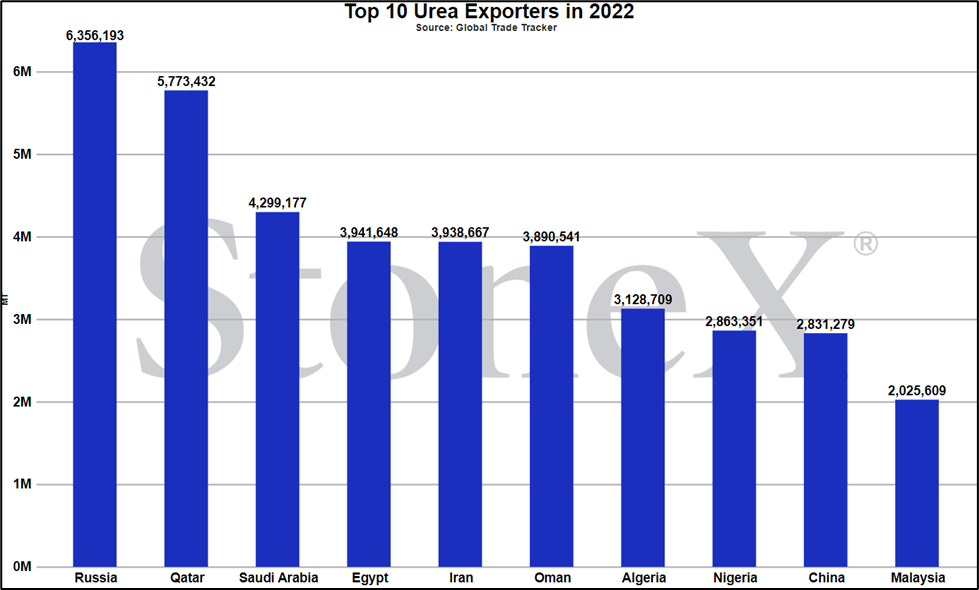
Number 4 global exporter in 2022
Price comparisons
Vs 30 days ago - 11% or approximately $34 higher
Vs 90 days ago - 2% or approximately $6 higher
Vs 6 months ago - 4% or approximately $15 higher
Vs 1 year ago - 9% or approximately $29 higher
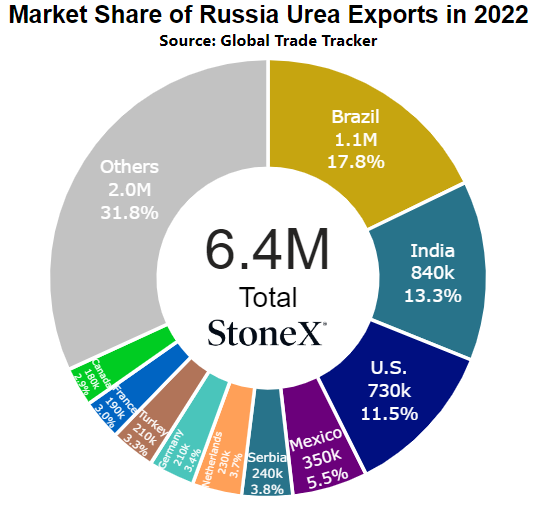
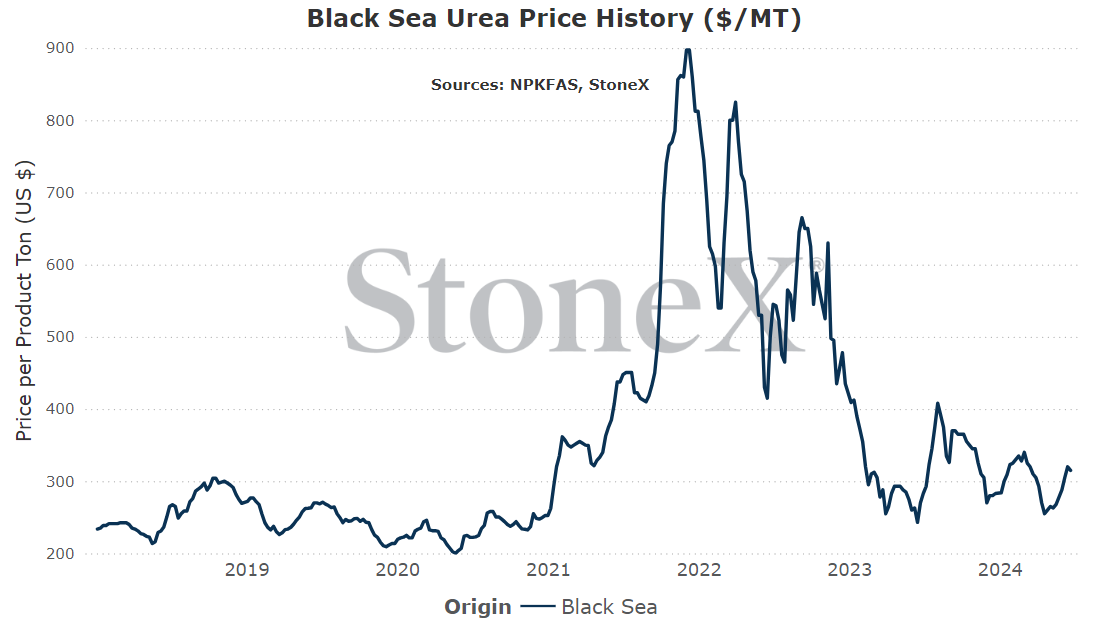
Black Sea
Number 1 global exporter in 2022
Price comparisons
Vs 30 days ago - 14% or approximately $38 higher
Vs 90 days ago - 2% or approximately $5 higher
Vs 6 months ago - 12% or approximately $33 higher
Vs 1 year ago - 17% or approximately $45 higher
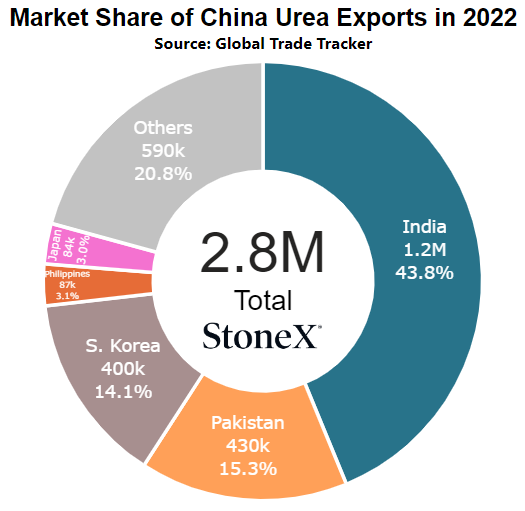
China
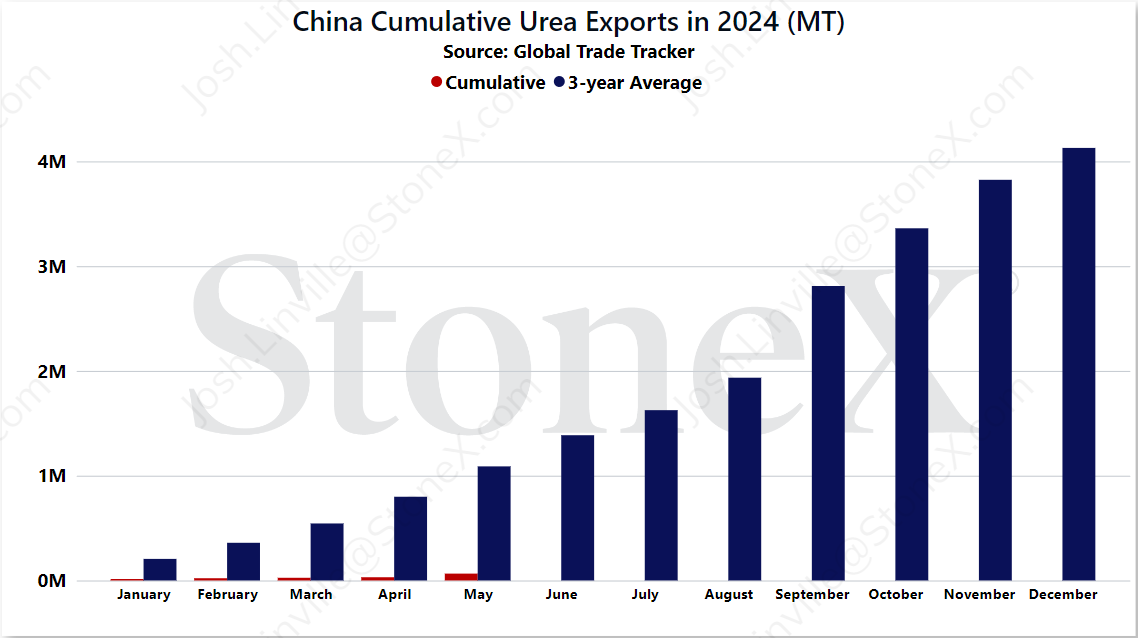
Number 9 global exporter in 2022
Price comparisons
Vs 30 days ago - -1% or approximately $4 lower
Vs 90 days ago - unchanged vs 3-months earlier
Vs 6 months ago - -10% or approximately $37 lower
Vs 1 year ago - 7% or approximately $22 higher
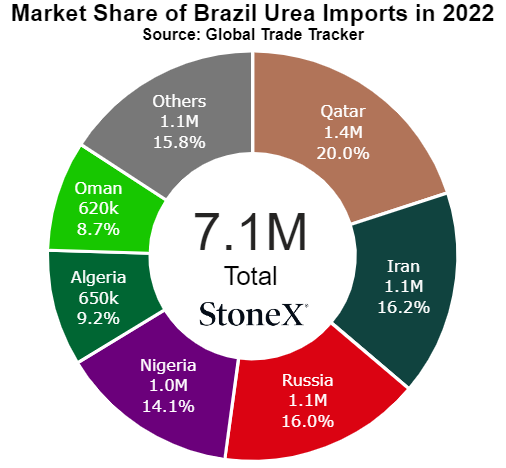
Brazil
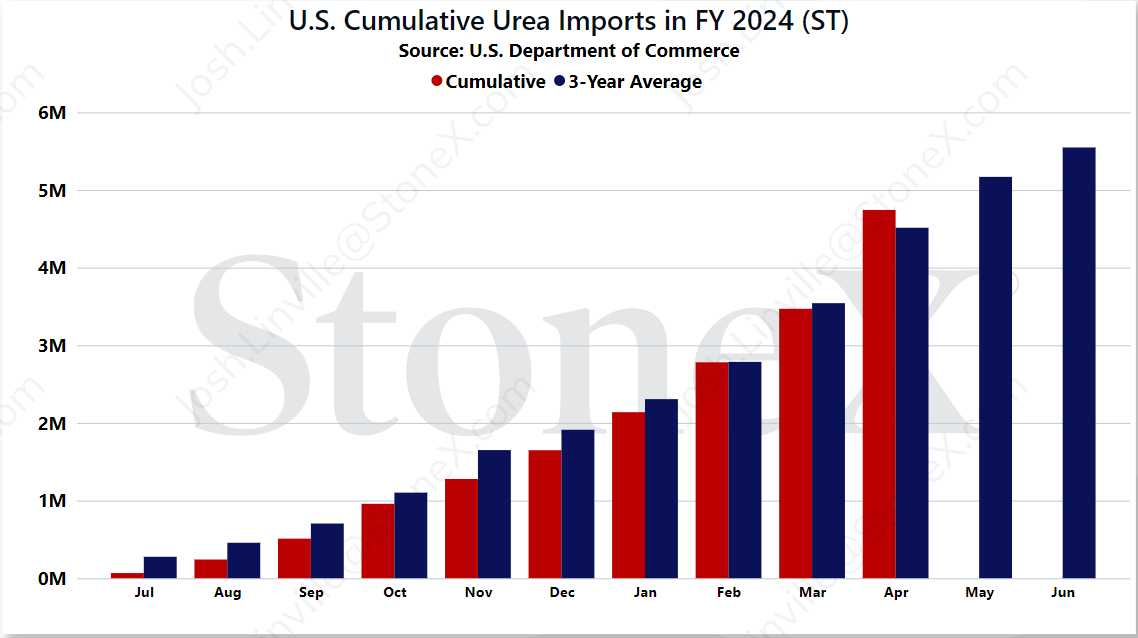
Number 2 global importer in 2022
Price comparisons
Vs 30 days ago - 13% or approximately $40 higher
Vs 90 days ago - 2% or approximately $8 higher
Vs 6 months ago - 13% or approximately $40 higher
Vs 1 year ago - 27% or approximately $77 higher
- Continued supply issues (export and/or production) - there are plenty of supply issues around the world. Egypt/Brazil/Europe/China all have either reduced or completely shut off production and/or exports. This doesn't take into account global production that needs to go offline for repairs. If the issue list continues to grow, it means the supply tonnage continues to shrink.
- India buys a lot more than expected - if the market surprises us and gets very aggressive on pricing and in turn, other offers relent and drop their price, then India could shock the market and buy more than expected. Maybe not a huge chance, but a chance.
- Ramp up in global tensions - Russia remains in Ukraine. China continues to ramp up tensions regarding Taiwan. Separate, each nation represents a decent portion of global urea. Combined, it is a very big number. Hopefully this is a story that doesn't need to be told, but it does need to be watched for.
- Values have gotten to high, runs off demand - demand started to step forward because the value was there. Since then, urea values have jumped and grain has fallen. Just as quick as buyers appeared, they disappeared again. If sellers want to sell, they know what needs done.
- Egypt/China return - Egypt continues to struggle with their gas supplies, but it looks like that should be fixed sooner than later and production resumes. China is a bit more murky on their approach but we continue to hope/believe they will return. If both return to the market, it should help lower price ideas.
- Return of Europe/Brazil production - notice I didn't lump Europe and Brazil with Egypt/China? I think there is a better chance of Egypt/China coming back. Europe and Brazil seem very low probability today. However, if either one or both shocks us and returns, it should cause the market to reel more than the other two returning.
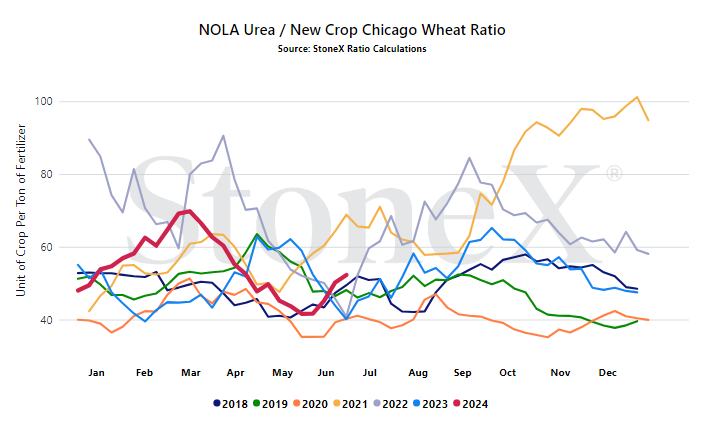
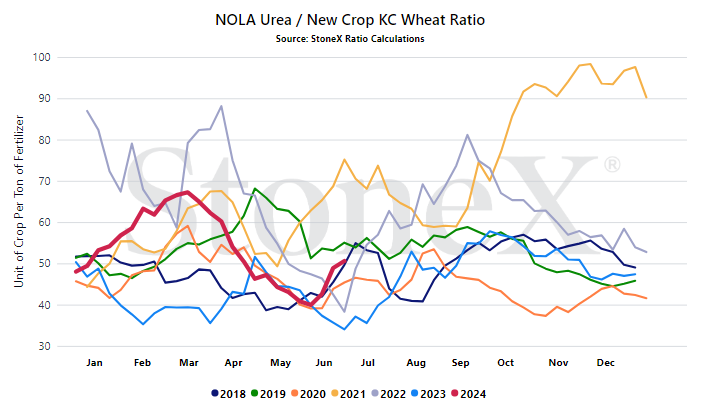
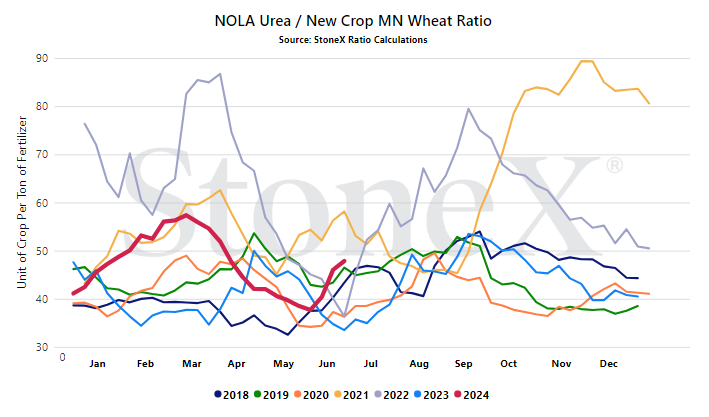
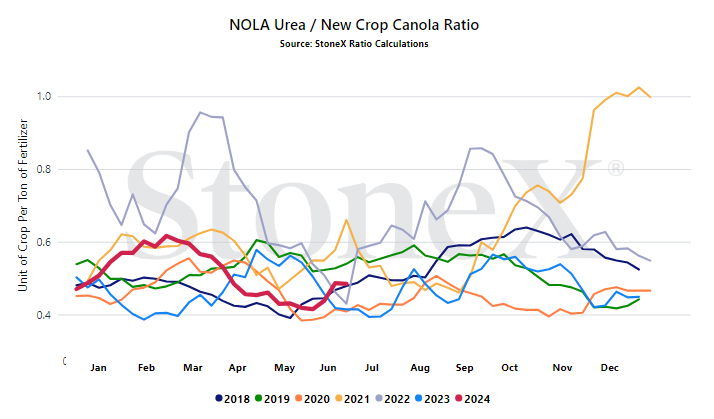
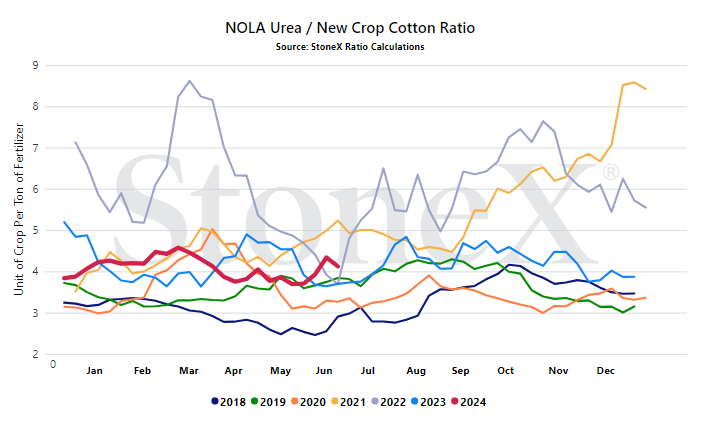
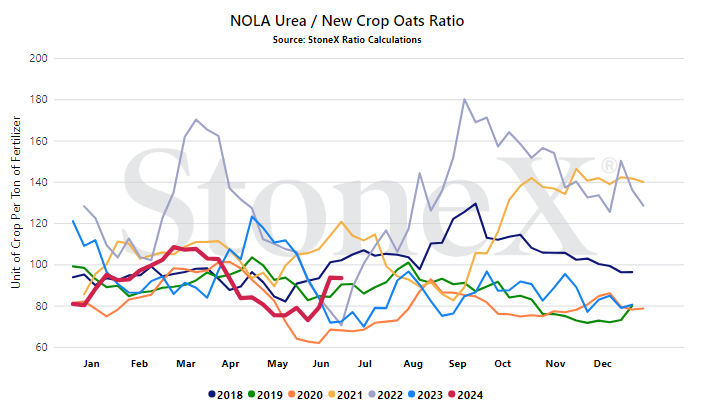
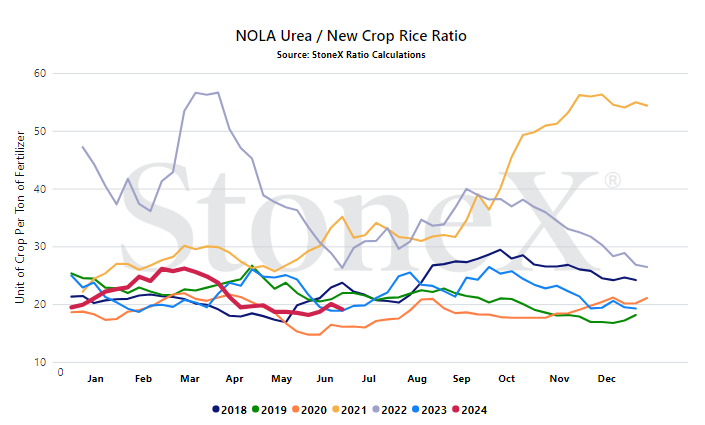
We believe that only looking at the flat price of either grains or fertilizer can be misleading:
- Only selling grain can hurt you if fertilizer prices rise substantially
- Only buying fertilizer can hurt you if grain prices fall
We look at the ratio "value" to get a better indication of where we are or how many bushels of X does it take to pay for 1 ton of fertilizer.
Would you rather:
- Spend 135 bushels to pay for 1 ton of urea
- Spend 55 bushels to pay for 1 ton of urea
When we compare the current ratio value against recent years, we start to see if we are high or low.
YOUR VALUES WILL LOOK DIFFERENT
This graph looks at the NOLA urea price vs the flat grain price. There are no logistics on either product. Your location will look different due to fertilizer logistical costs, grain basis, etc.
- Egyptian production and Chinese exports - these are my top two watch points...and I couldn't decide on one or the other, so I combined them. Egypt did a lot of the work in rallying global price ideas so how they proceed needs to be tracked. If production continues to suffer, will global values continue to rise? How about Chinese exports. If/when they return, it should be like a wet blanket on the fire that has been urea.
- India tender results - I continue to believe that India has a lot more chance to disappoint global bulls rather than bears (which means it will be the most bullish thing in history, but I digress...). Prices around the world have rallied a lot in recent weeks. If India disappoints, we could see a lot of those gains wiped out.
- How NOLA reacts vs the world - if we start this new fertilizer year flush with urea (like I think we are), it will be fun to watch how NOLA operates vs the world. How much of a discount will it be? Will we see heavy exports from time to time? Will it last until next spring?
StoneX Ratio Calculation
The ratio calculation is derived from Bloomberg historical grains values as well as fertilizer values from StoneX, NPKFAS, and Argus.
The calculation is simply dividing the fertilizer price by each grain price.
All data was sourced from StoneX unless otherwise noted.




