

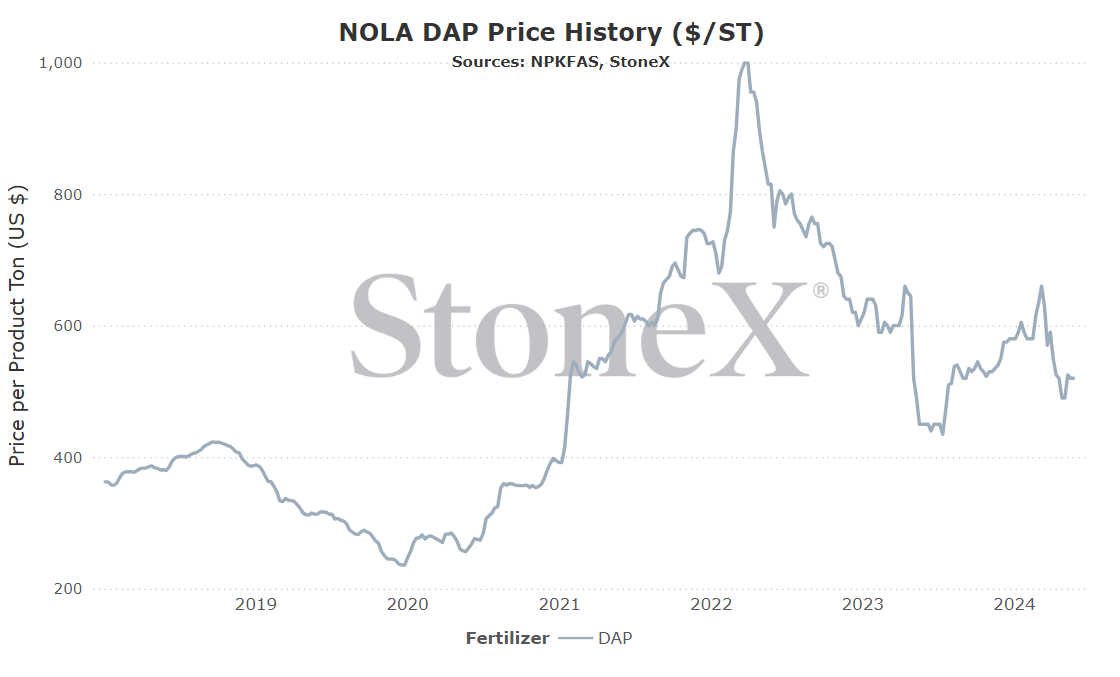
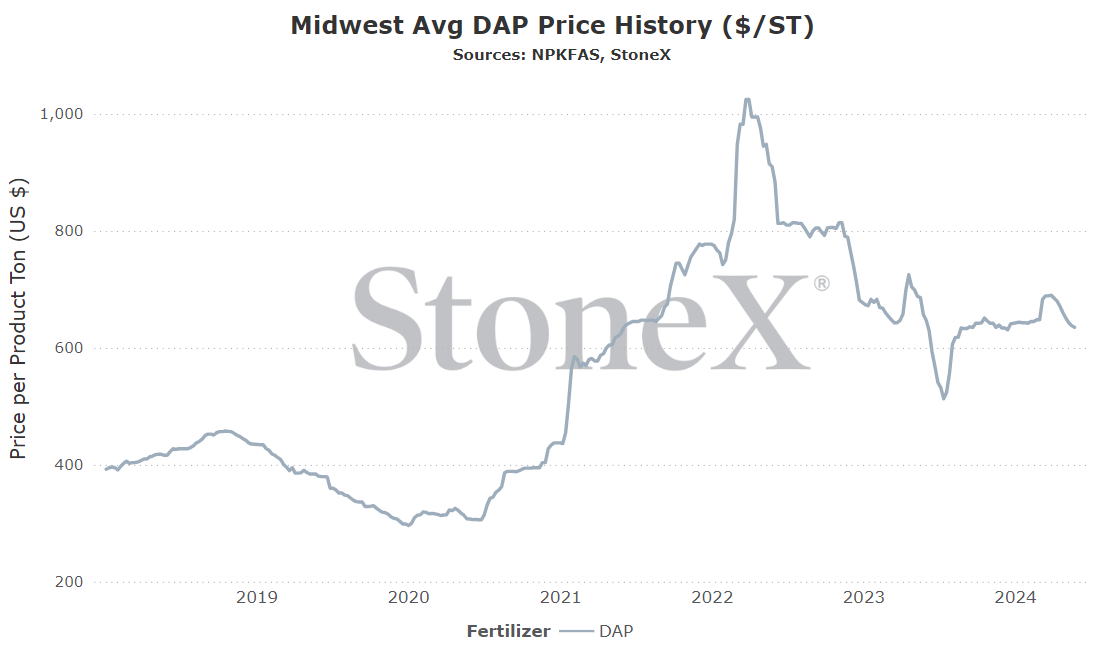
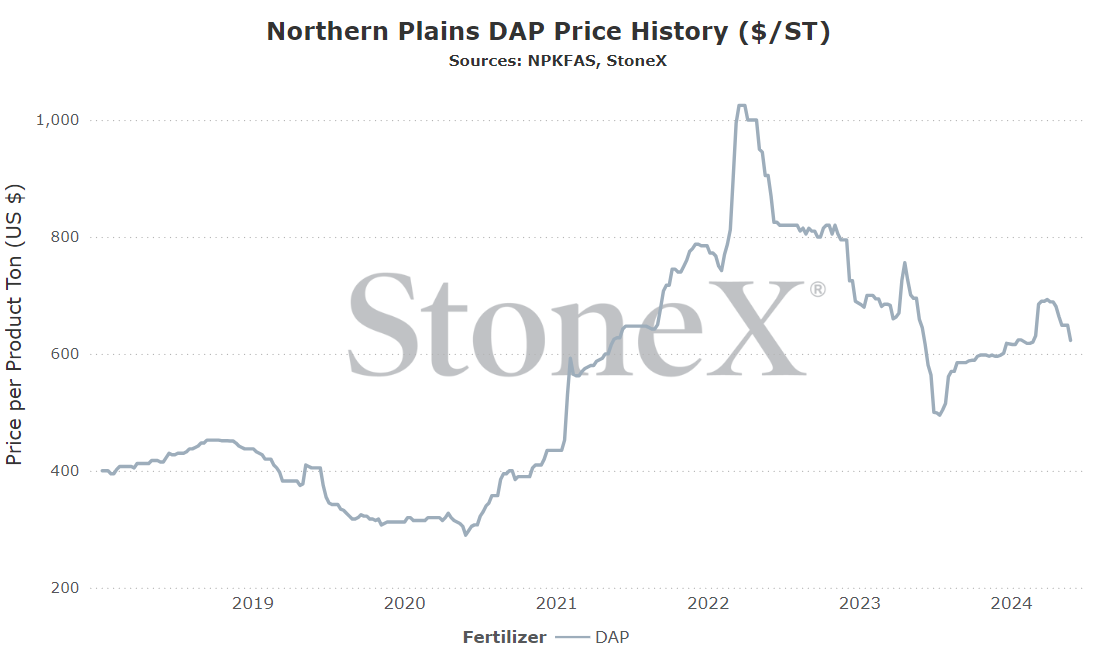
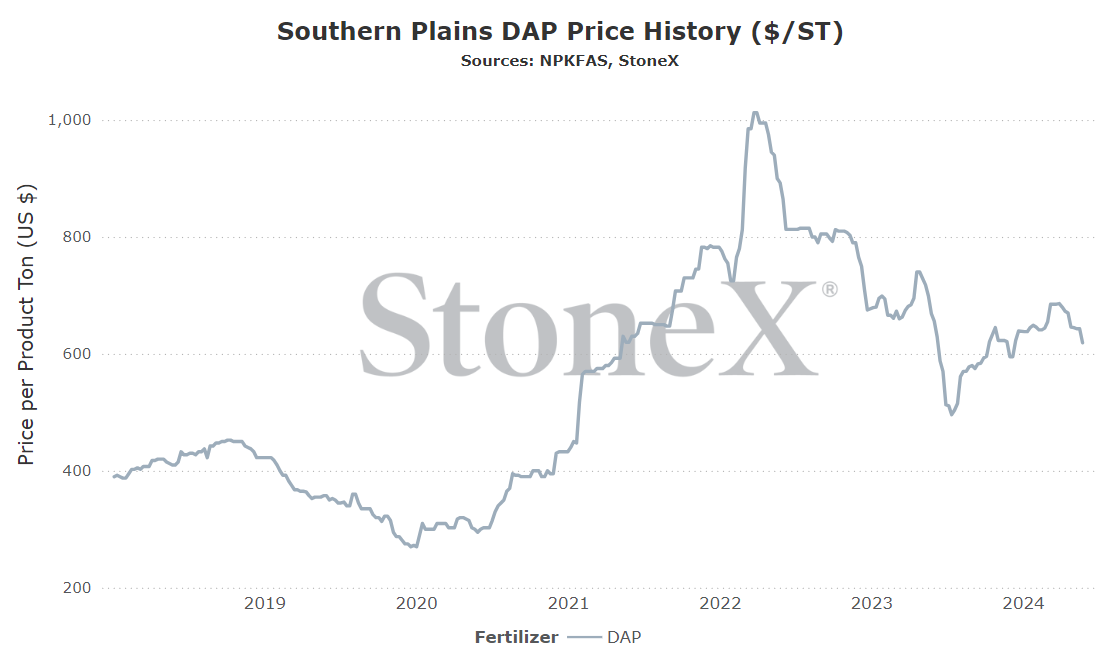
I will say this now and will say it going forward to eternity: these are the flat price graphs for each individual location. Your price where you are is going to be different. There are logistics. There is the cost of storage/interest/insurance/etc. These graphs should not be taken as "it shows the price at $700, why isn't my price $700". These graphs should be used to give an appreciation for price movements.
All values are in metric tons and USD currency.
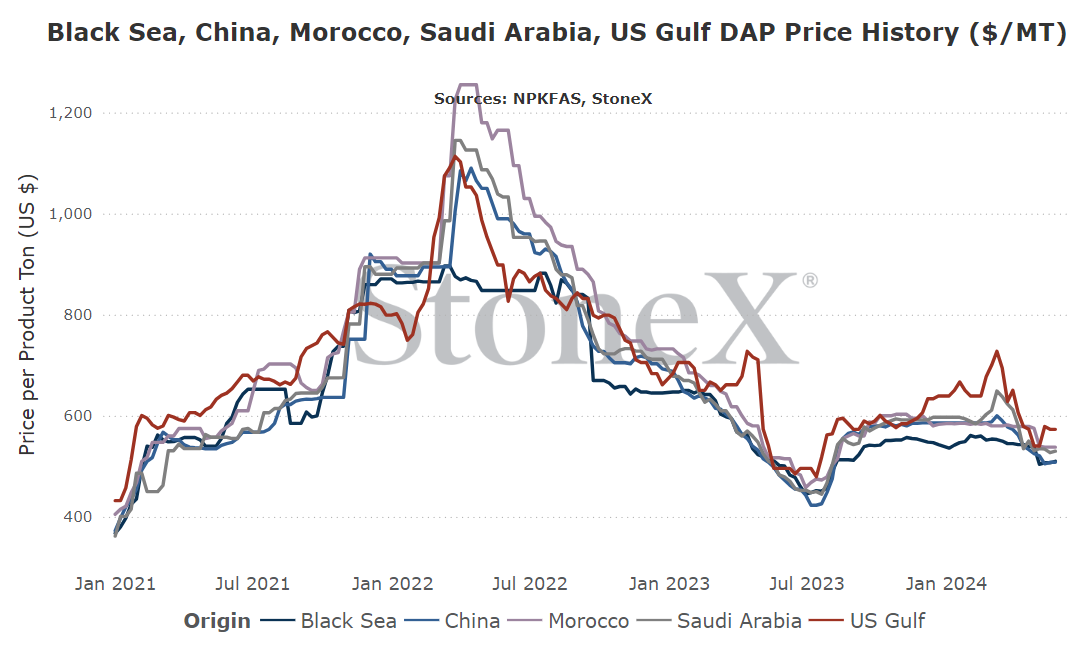
Global
From my vantage point, it appears that global supplies should be improving.
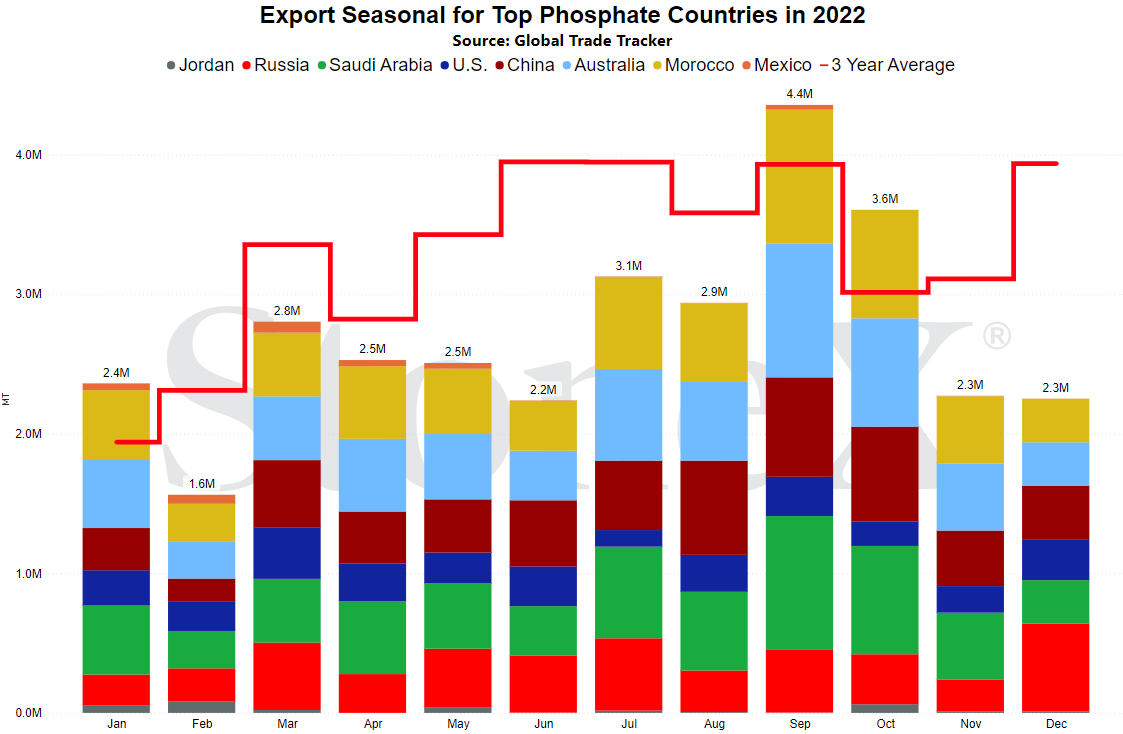
- China appears to be resuming exports
- Morocco is having no issues that we know of
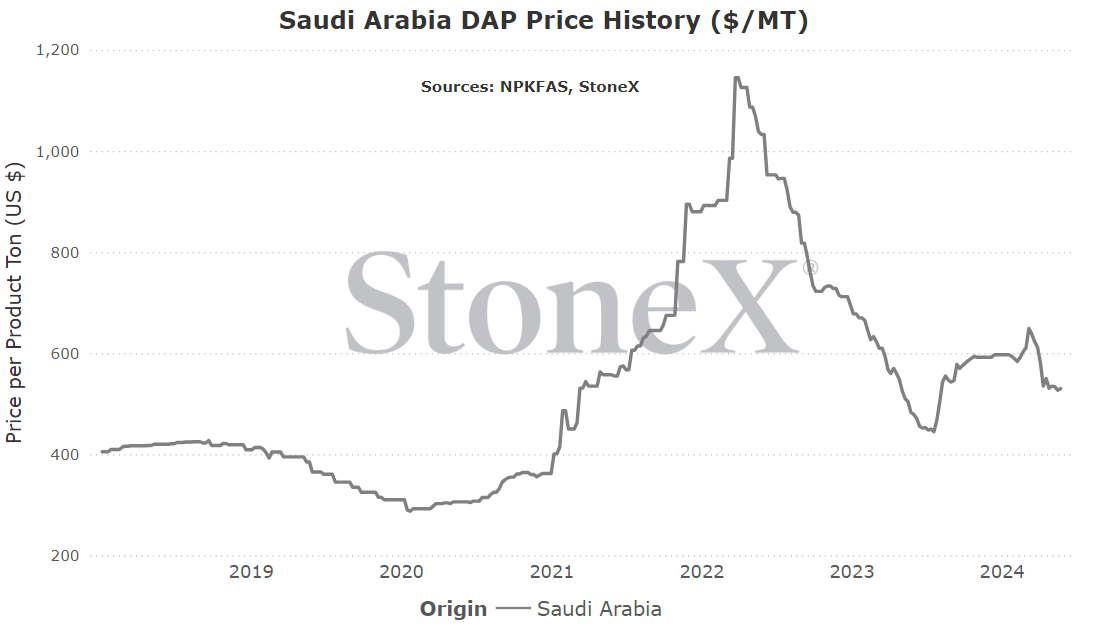
- Saudi Arabia is having no issues that we know of
- Russia is actually beating their 3-year average on exports
- U.S. has seen production suffer the last couple quarters but it appears to be improving
If current supplies are improving and current values are still high vs grains, I see this as a sign that values should continue to correct lower.
North America
Why even read this piece? If the global outlook is bearish, so to should N.A...right?
Not necessarily, unfortunately.
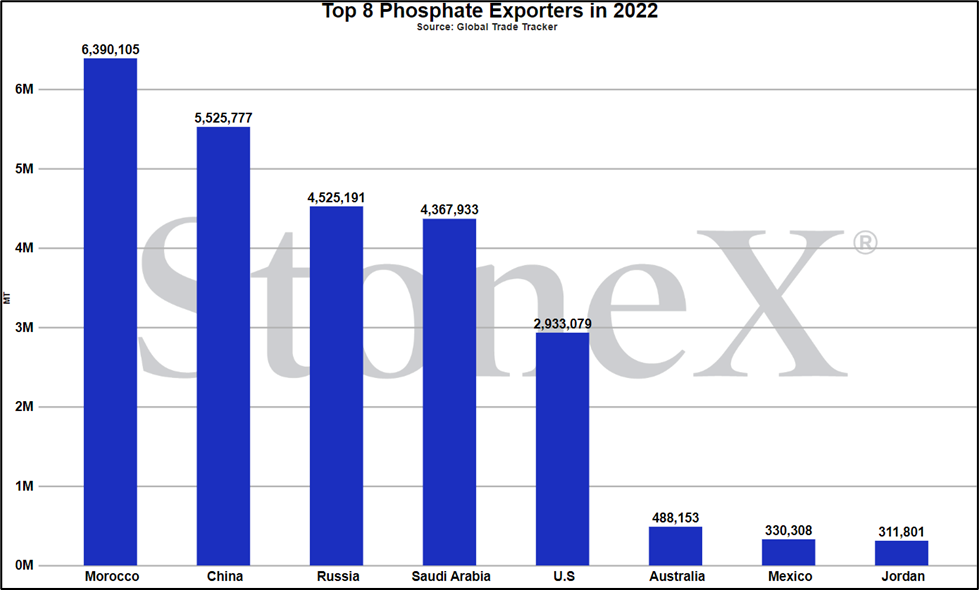
- China is the largest exporters...but cannot come to the U.S. due to duties.
- Morocco is number two...but the U.S. Department of Commerce just moved their rate higher
- Saudi Arabia is number three...no issues but there is a link to N.A. manufacturers
- Russia is number four...but like Morocco, duty rates were moved higher
- U.S. is number five...and manufacturers like higher prices/profits
Ultimately, N.A. is in a rough spot for supplies. Inventories will be low going into FY 25 (fertilizer year) meaning plenty of fill space. 3 of the 5 largest exporters will struggle to come here. While November is still 5 months away, it is only 5 months away. Last, summer fill programs were released Friday (before Memorial Day weekend...) and there seems to be OK'ish uptake on it.
Short term, it looks like N.A. values will hold, if not push higher. However, I am concerned that if global values do continue lower, eventually N.A. will be pulled with it.
This is not an outlook I am happy and/or proud of...but it is my POV today.
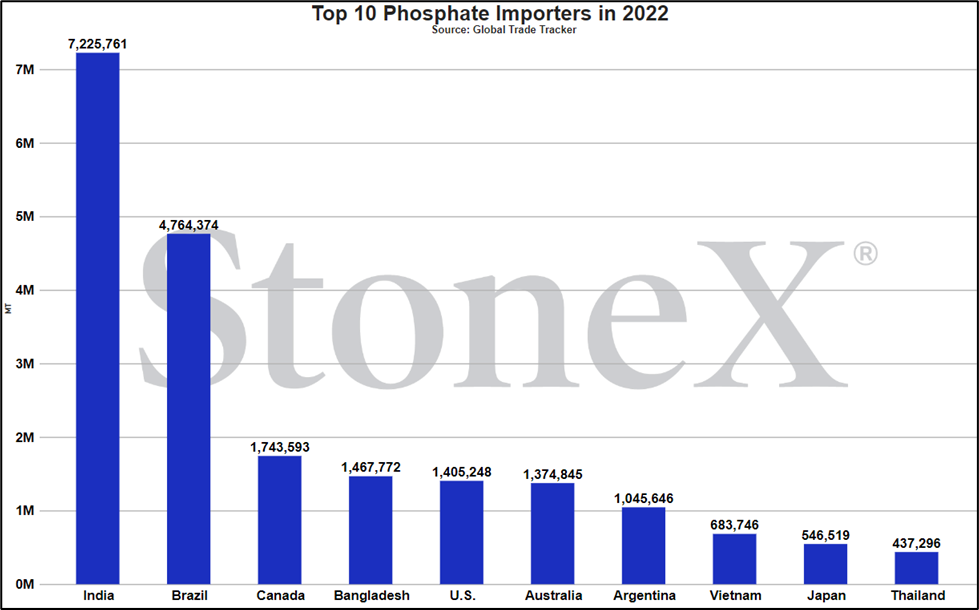
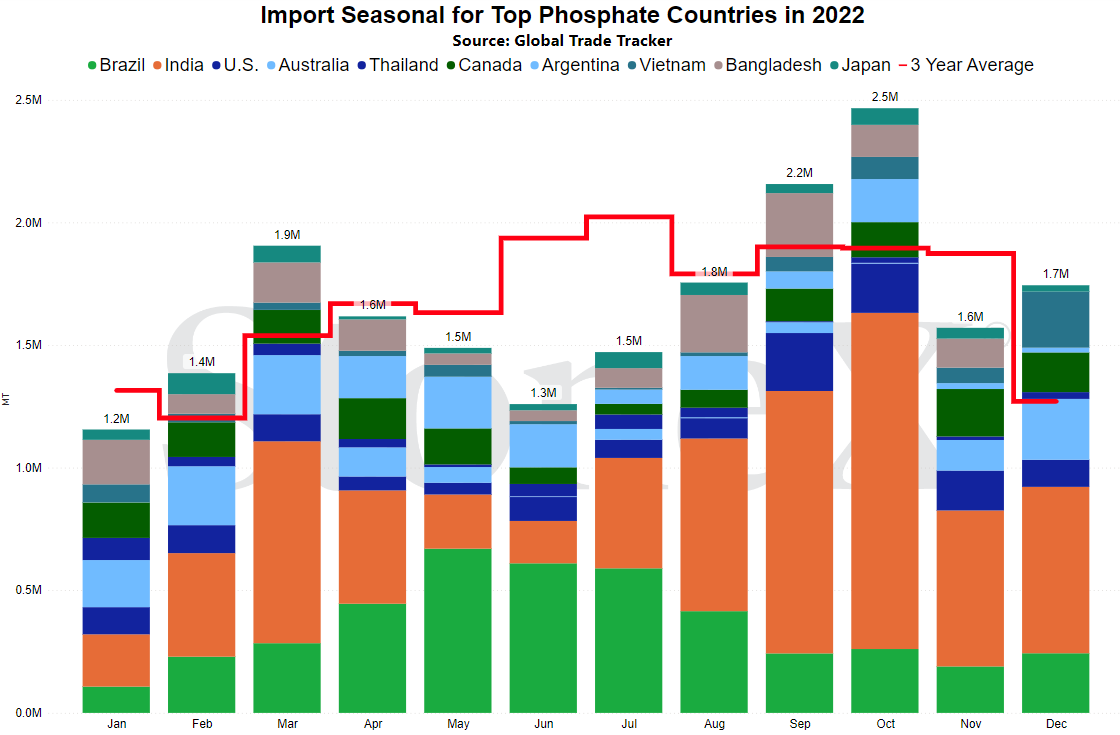
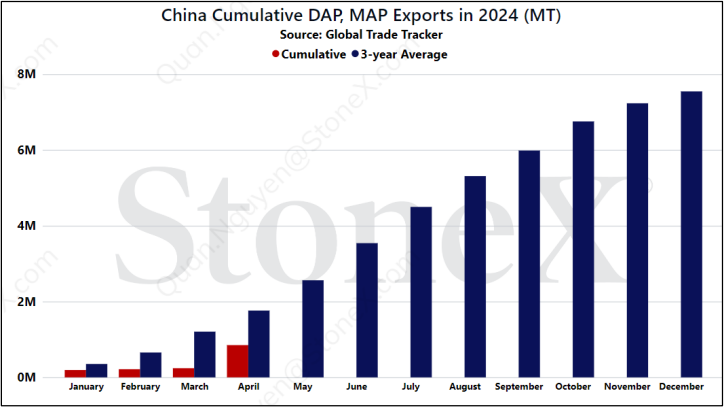
China phosphate exports improve in April...still far off normal pace
Bit of background before we dive into it.
Historically speaking, China has typically been the world's largest producer and exporter of DAP and MAP. However, during the lead up to the 2022 price spike for all fertilizers, the Chinese government started to intervene. Fearing global high prices and tight inventories, the government started to restrict exports in an effort to ensure lower values and better inventory supply for Chinese farmers. For the rest of the world, this was unfortunately somewhat successful. Now that global values and inventories have calmed down, many (myself included) believed that these restrictions would be removed and normal trade patters return. Unfortunately, that has not been the case. The government continues to play a role in determining what can and cannot happen...and that has global implications.
Fast forward to today. Unfortunately, the first quarter of the calendar year saw exports dragging far behind their 3-year average pace. Fear grew that they might become further secluded from the world which would cause global inventories to shrink and in turn, values to rally. Fortunately, April saw a surprising rebound.
Their cumulative yearly exports are only about half of where they should be, but April has served to provide hope. If this trend continues and China starts returning to normal rates, this will add uncertainty to global sellers which is great news for buyers.
U.S. Department of Commerce set to RAISE duty rates on Morocco/Russia
I've had to start/stop/start this section a couple different times because it gets me riled up each time I start typing about it.
Let's start with the backstory so everyone is up to date.
Back in the summer of 2020, global phosphate values were in the toilet (from the seller side). Prices were down significantly to the point where N.A. manufacturers were having to curtail production due to their losing money. In that scenario, they saw it as a better option to suspend production for a short amount of time than it was to continue producing tons with each representing a loss.
Ultimately, a manufacturer filed for a counter vailing duty rate against both Morocco and Russia. This case was eventually approved and rates placed against both countries phosphate imports. Very quickly, U.S. import flows changed. Since that time, there has been a lot of changes made. To keep from boring you the details, the most recent speculation was hope that the U.S. Department of Commerce would remove duties against at least Morocco due to recent issues in the market.
N.A. has experienced a lot of supply issues the last few seasons and has also seen NOLA DAP, which historically spends most of its time in the middle to low end of global origins, move to the world's high price more often than not. China had already had duties placed against them. Adding Morocco and Russia to the mix meant that 3 of the 5 largest global exporters were now effectively blocked. The U.S. represents 1 of the 5 largest and Saudi Arabia rounds it out but has no restrictions...which makes sense when you look at the ownership structure/partnership with the U.S. The fall off from number 5 to number 6 is huge and the fall to number 7 larger still. Basically, N.A. had been caught with very few options. That was where the hope sprang that Morocco would be allowed to return.
Ultimately, we found last month that they would not.
Not only did the Department of Commerce move the lowest duty Russian manufacturer higher, they move the Moroccan rate from 2% to 14%. If there was any glimmer of hope that their supply would return, that announcement killed it.
Now, this was a preliminary rate change. That means that more studies will need to be done before a final determination vote is held in November. There is a chance, albeit fairly small, that the November vote could be against but that will be far too late for the coming fall season.
In the end, N.A. phosphate market is now down to domestic production and imports from Saudi Arabia. This has put a lot of pressure on the retailers (and eventually farmers) to decide what they will do. Current global prices have been trending lower. Current phosphate values are not attractive when compared against grain prices. Interest rates being higher have created a very high month to month cost. Normally, those would all mean that buyers stay away...but when the market is as condensed as it is, it is hard to so no thank you.
N.A. phosphate summer fill programs announced
The biggest surprise of the last month has easily been that North American phosphate manufacturers rolled out their first round of summer fill...the Friday before the 3-day Memorial Day weekend.
This will be a tough one to swallow by retailers/farmers.
The program was rolled out at a $520 - $530 NOLA DAP equivalent.
Now, in comparison to recent years, that actually isn't too bad. NOLA DAP, at its height in early 2022, reached $1,000. So that means this program is about half of that. That is great, as long as you do not look at other fertilizer resets over the same period which fell much more than 50%.
Then, we need to look at it vs last year. This years price represents about 15 - 20% higher than last summers lows.
Still with me?
Last, we have to look at it in relation to grain prices because if grain prices are higher, at least that helps to offset the higher priced phosphate. Well, that is not the case today. Not to say that it cannot improve and I certainly hope that is the case but today that is not reality. When we look at today's comparison, it just is not attractive:
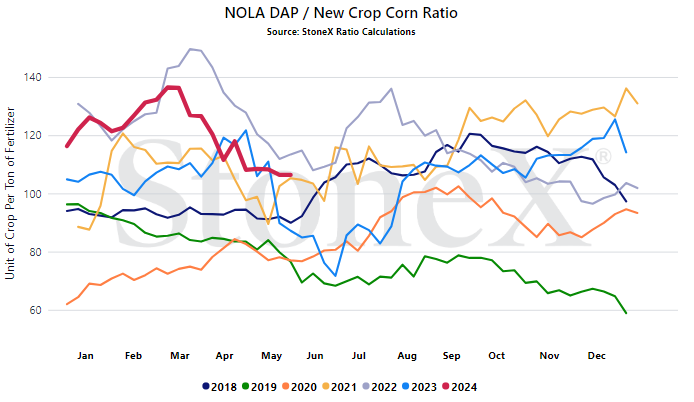
- NOLA DAP @ $525
- December 2025 corn @ $4.91
- Current ratio - 107
Take a quick peek at the graph below. 107 is on the higher end of recent years.
So the immediate reaction may be "heck with them. We will not buy it. We will just wait."
Trust me, I had the same thought.
Unfortunately (I've been using that word a lot this month), buyers are backed into a corner.
- Ending inventories should be relatively low after a huge fall/spring run
- 3 of the 5 largest global exporters are effectively blocked from coming
- N.A. has continued to see some production issues that are hopefully being resolved
When these programs make their way to the farm, do not be upset with your retailer. They do not set these prices and trust me when I say most of them would love nothing more than to be selling you phosphate at half the price.

NOLA/New Orleans, Louisiana DAP price comparison
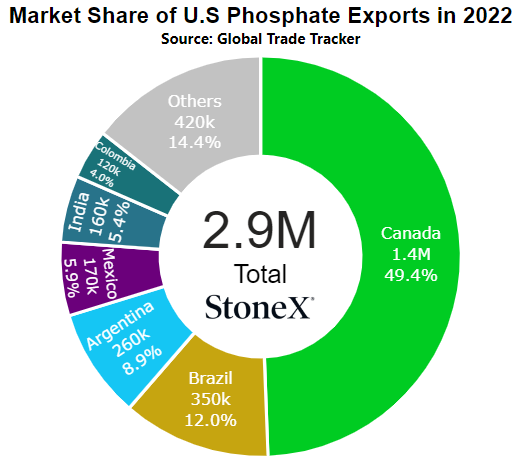
Number 5 global exporter in 2022
Price comparisons
Vs 30 days ago - +6% or approximately $30 higher
Vs 90 days ago --15% or approximately $95 lower
Vs 6 months ago - -4% or approximately $20 lower
Vs 1 year ago - +16% or approximately $70 higher
U.S. Midwest Average (using multiple points across Midwest) price comparison
Vs 30 days ago - -4% or approximately $25 lower
Vs 90 days ago - -2% or approximately $13 lower
Vs 6 months ago - -1% or approximately $4 lower
Vs 1 year ago - -3% or approximately $22 lower
U.S. Northern Plains Average price comparison
Vs 30 days ago - -6% or approximately $41 lower
Vs 90 days ago - unchanged vs 3 months earlier
Vs 6 months ago - +4% or approximately $26 higher
Vs 1 year ago - -6% or approximately $36 lower
U.S. Southern Plains Average price comparison
Vs 30 days ago - -4% or approximately $28 lower
Vs 90 days ago - -4% or approximately $25 lower
Vs 6 months ago - unchanged or approximately $3 lower
Vs 1 year ago - -7% or approximately $50 lower
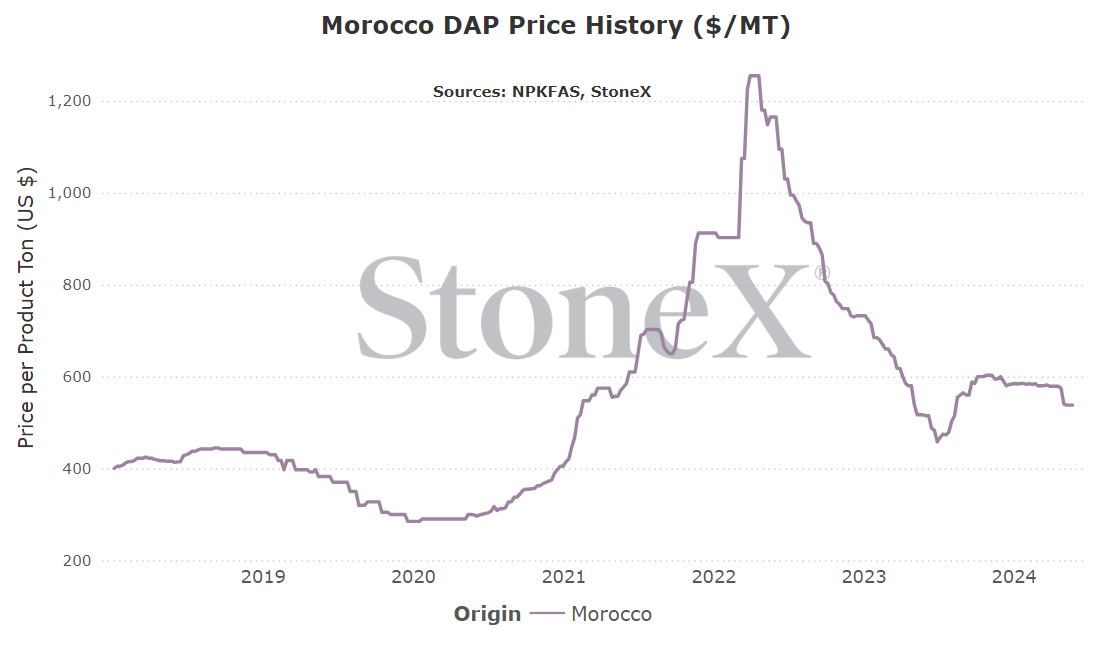
Morocco DAP price comparison
Number 1 global exporter in 2022
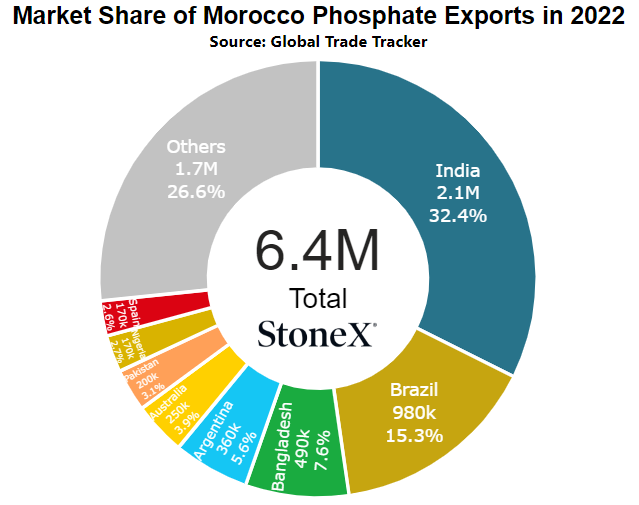
Price comparisons:
Vs 30 days ago - -7% or approximately $38 lower
Vs 90 days ago - -8% or approximately $48 lower
Vs 6 months ago - -10% or approximately $580 lower
Vs 1 year ago - +4% or approximately $21 higher
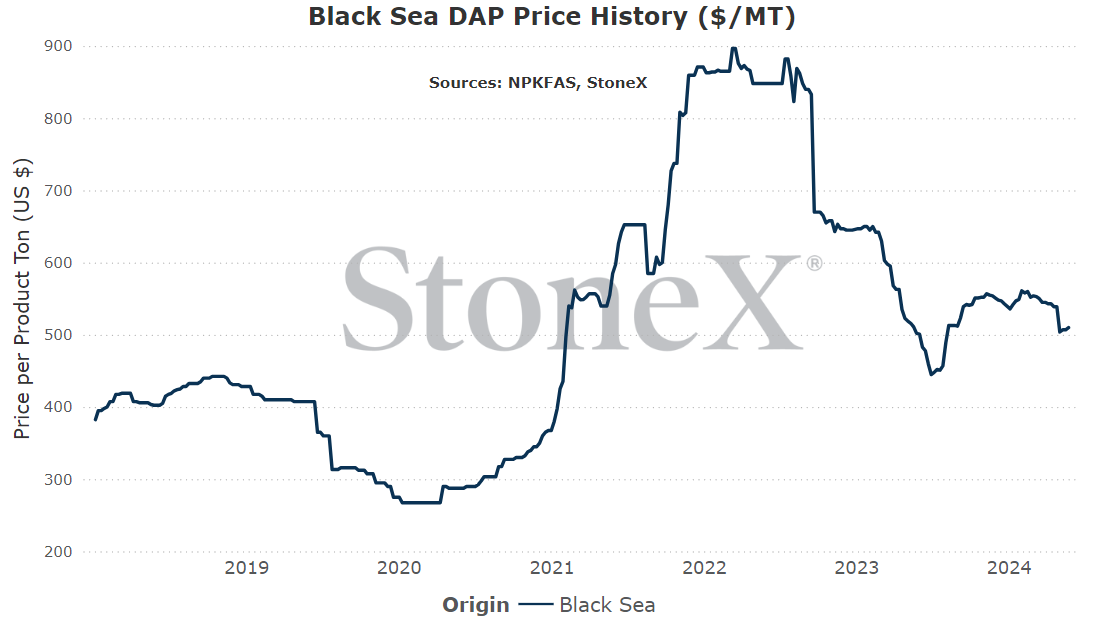
Black Sea DAP price comparison
Number 3 exporter of DAP/MAP in 2022
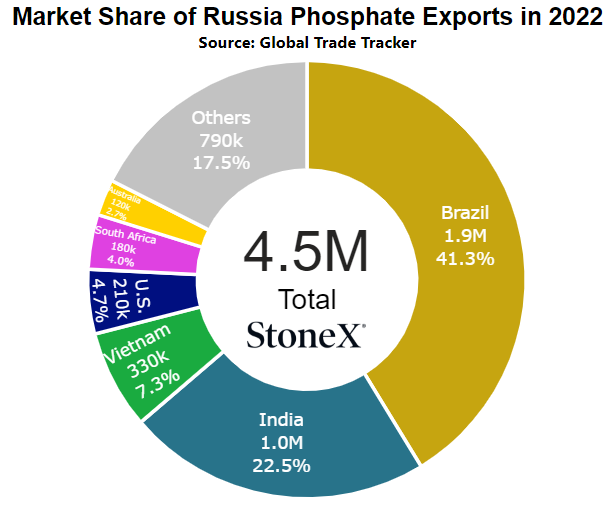
Price comparisons:
Vs 30 days ago - -5% or approximately $29 lower
Vs 90 days ago - -8% or approximately $42 lower
Vs 6 months ago - -8% or approximately $44 lower
Vs 1 year ago - +2% or approximately $9 higher
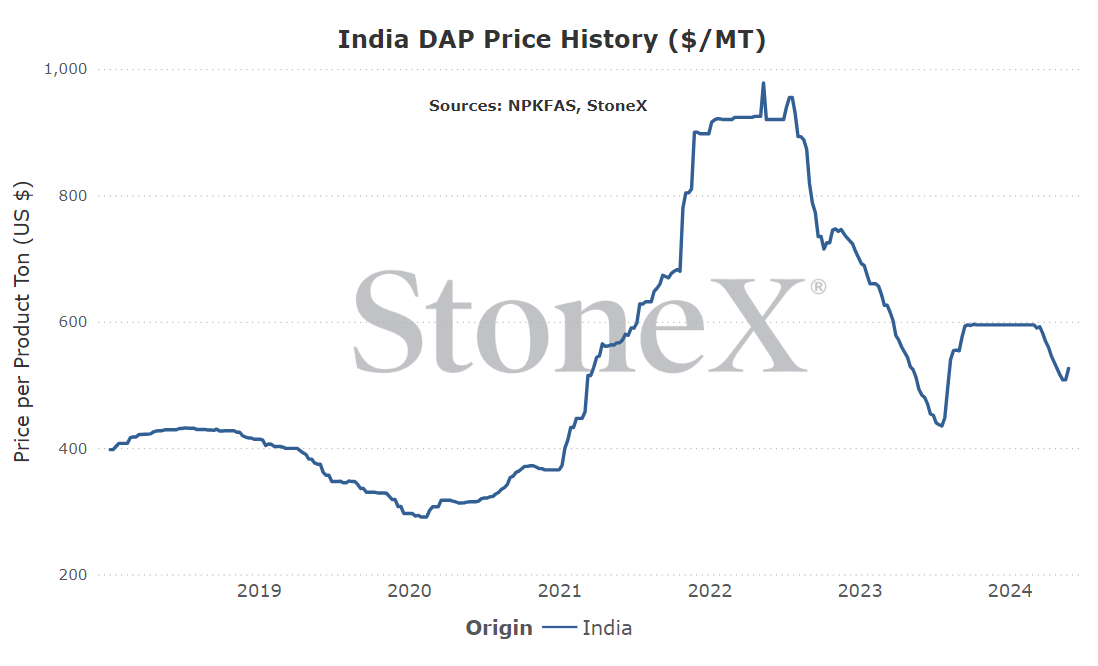
India DAP price comparison
Number 1 global importer in 2022
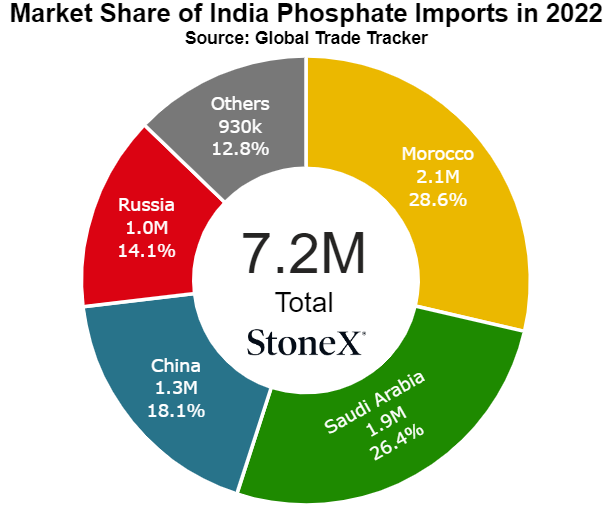
Price comparisons:
Vs 30 days ago - unchanged or approximately $1 higher
Vs 90 days ago - -12% or approximately $69 lower
Vs 6 months ago - -12% or approximately $69 lower
Vs 1 year ago - +7% or approximately $34 higher
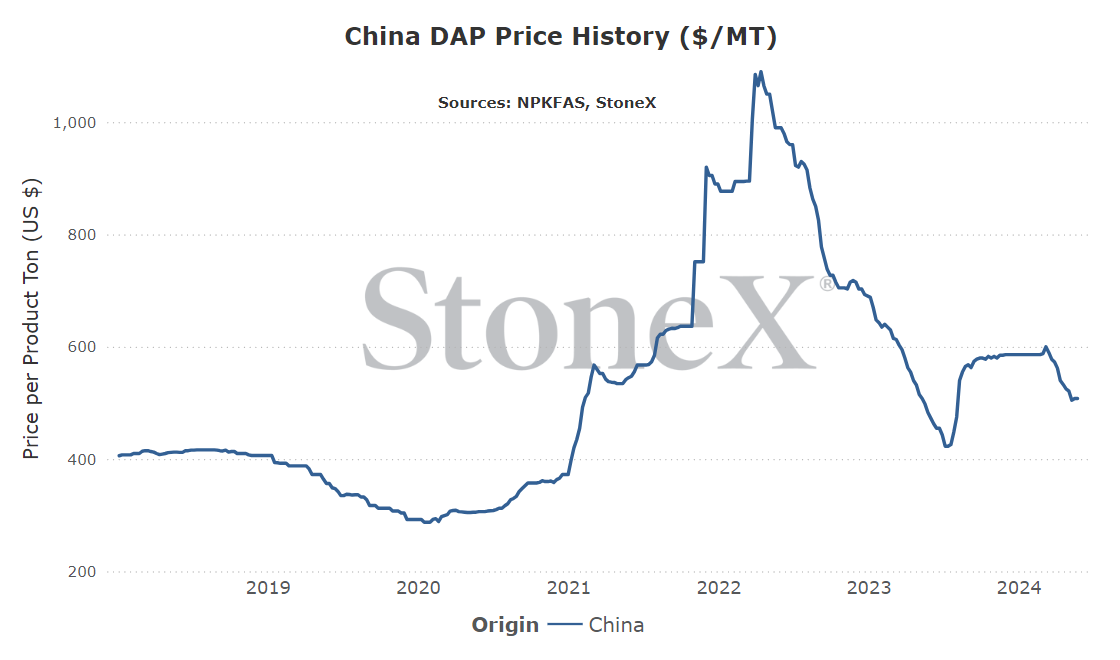
China DAP price comparison
Number 2 global exporter in 2022
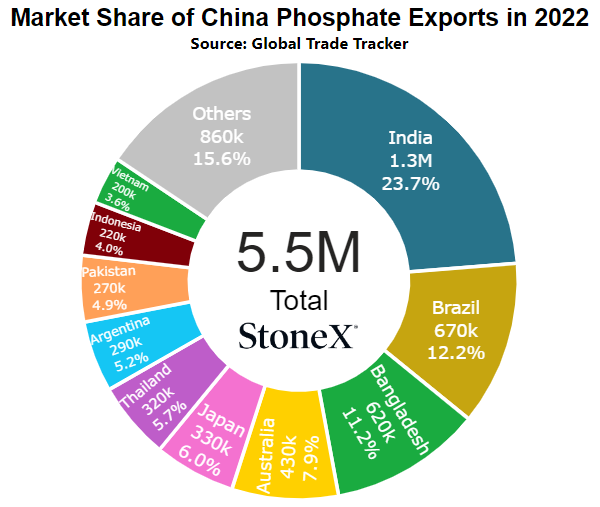
Price comparisons:
Vs 30 days ago - -3% or approximately $18 lower
Vs 90 days ago - -13% or approximately $79 lower
Vs 6 months ago - -13% or approximately $78 lower
Vs 1 year ago - +5% or approximately $25 higher
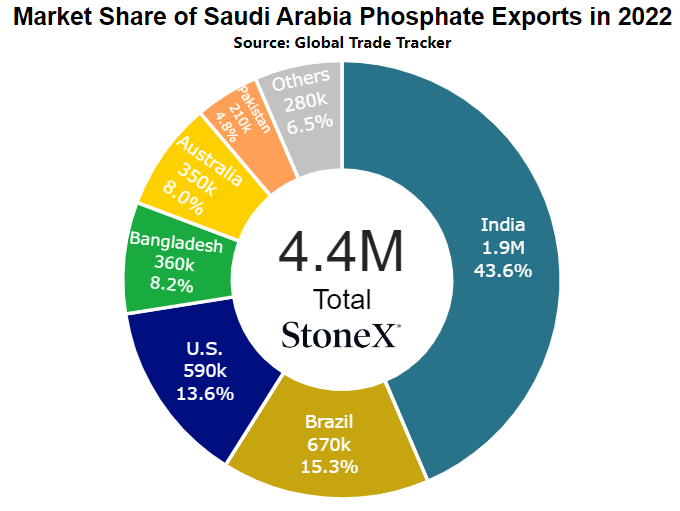
Saudi Arabia DAP price comparison
Number 4 global exporter in 2022
Price comparisons:
Vs 30 days ago - unchanged or approximately $1 lower
Vs 90 days ago - -12% or approximately $74 lower
Vs 6 months ago - -10% or approximately $62 lower
Vs 1 year ago - +10% or approximately $47 higher
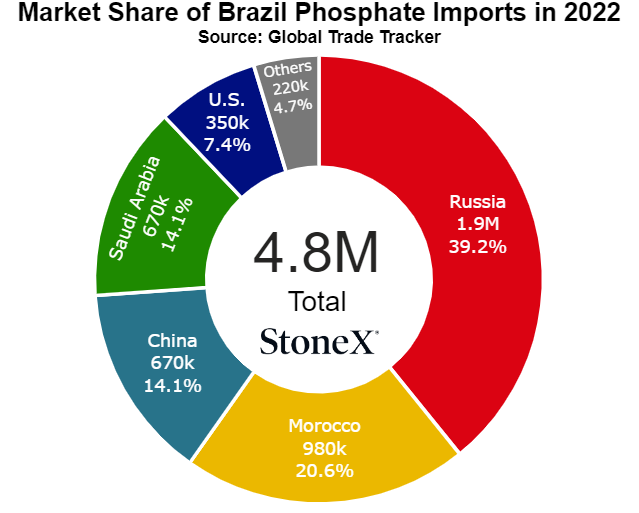
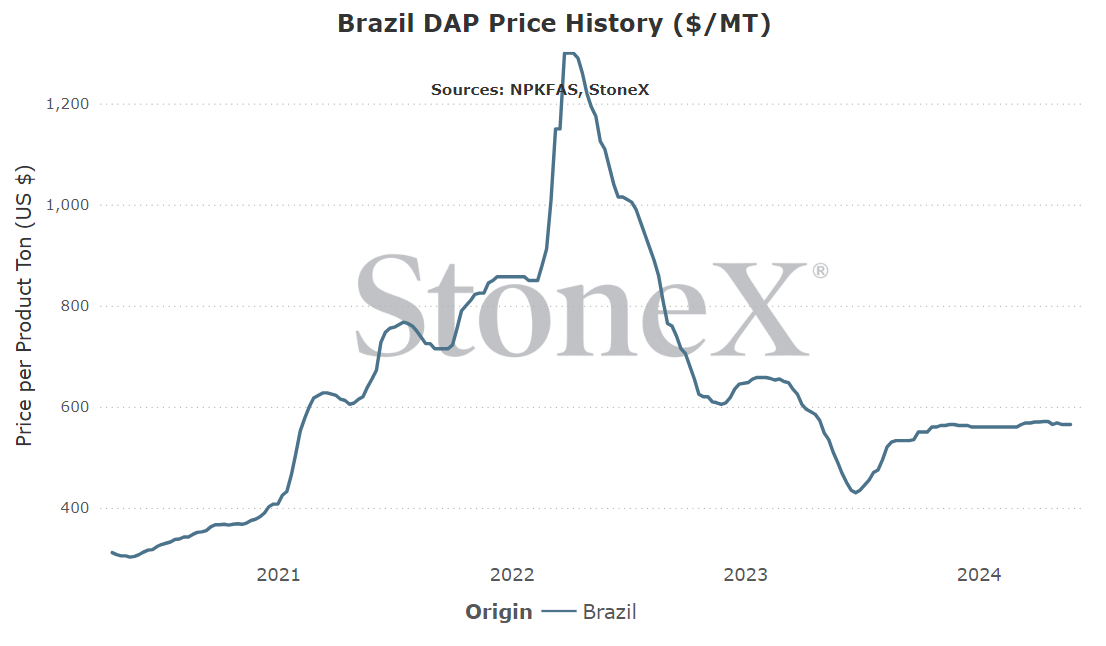
Brazil DAP price comparison
Number 2 global importer in 2022
Price comparisons
Vs 30 days ago - unchanged vs a month earlier
Vs 90 days ago - +1% or approximately $5 higher
Vs 6 months ago - unchanged vs 6 months earlier
Vs 1 year ago - +15% or approximately $75 higher
- N.A. buyers feel forced to purchase summer fill contracts – this is very real. There is a subset of buyers who need to start buying today just because of how big they are (cannot wait until October). There is a subset of buyers who will buy because of fear of missing out on what their neighbor will do. There is a subset of buyers who will buy because that is what they always do. Even though the price might be high already, there could be enough sales to make manufacturers happy for a decent chunk of the calendar.
- Chinese exports could slow again – unfortunately, we cannot depend on China for rationale approaches to the market. If we suddenly learned that the government stepped in to slow exports again, I would not be surprised at all. If they disappeared from the market again, this would give other manufacturers a lot more confidence in moving prices up.
- Phosphate is still high vs a lot of comparisons – there are a lot of ways to skin this one but they all result in the same: phosphate is high priced. There are a lot of things going for the manufacturer and stable to higher pricing. However, if enough buyers say no thank you, eventually a day will come when they need to find buyers...with a price.
- If China continues to ramp up exports – while I'm not counting on this, I'm certainly watching for this. If we continue to see Chinese exports ramp up, that will add much needed supply on the world scale. It also brings back aggressive buyers that the rest of the world manufacturers tend to fear. China staying in the market would be a very good thing for global buyers.
We believe that only looking at the flat price of either grains or fertilizer can be misleading:
-
Only selling grain can hurt you if fertilizer prices rise substantially
-
Only buying fertilizer can hurt you if grain prices fall
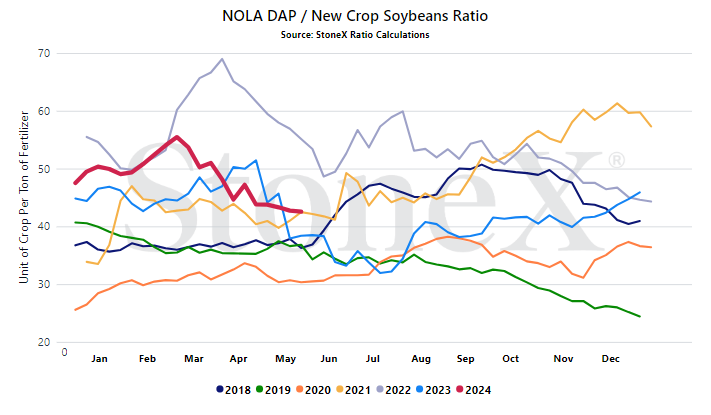
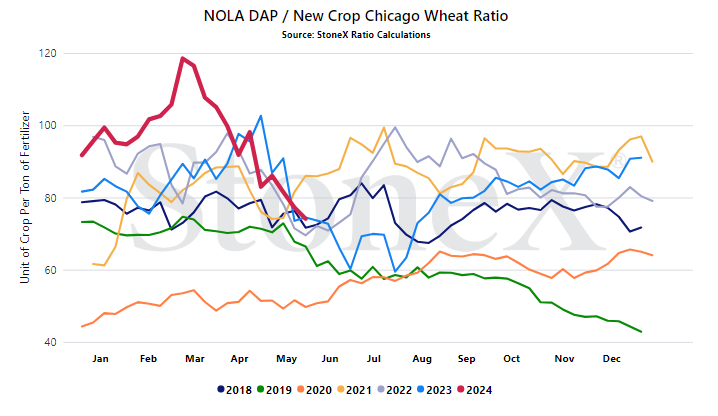
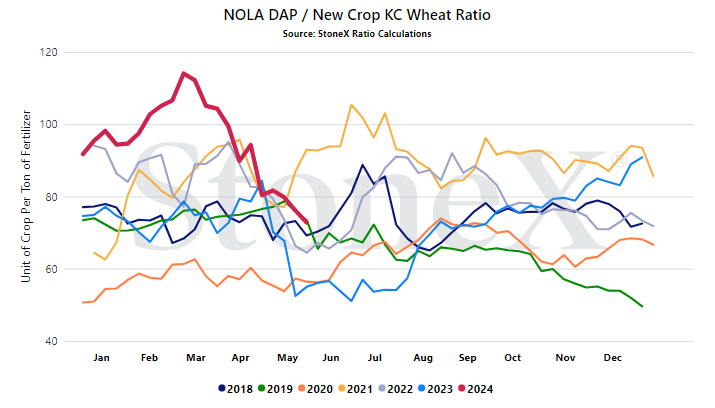
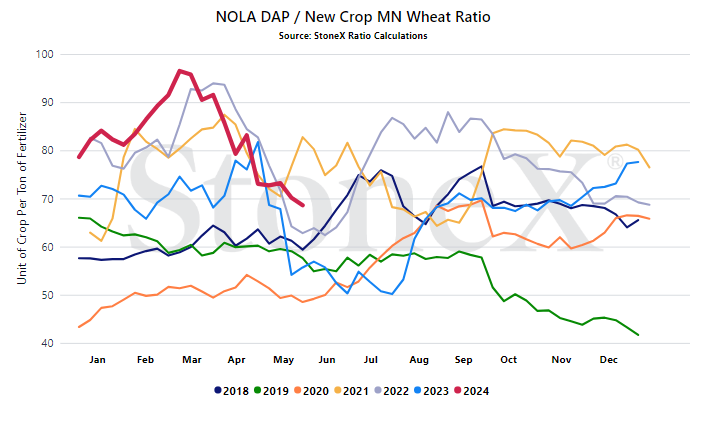
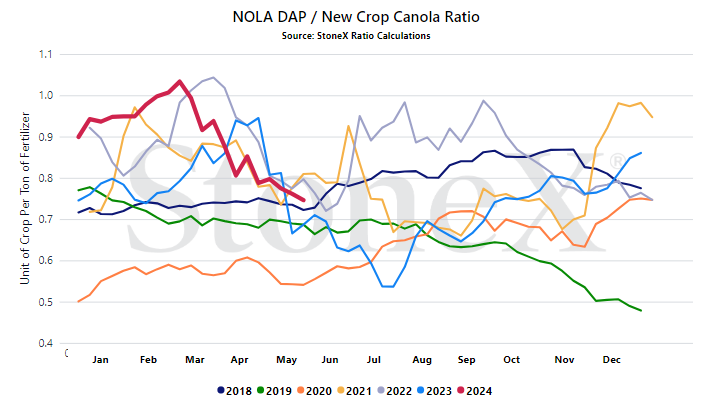
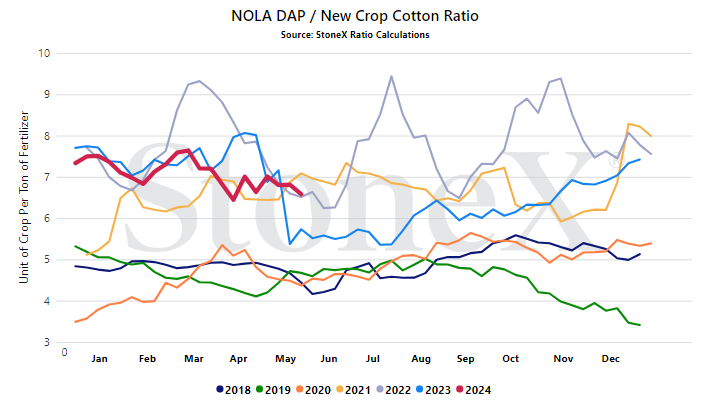
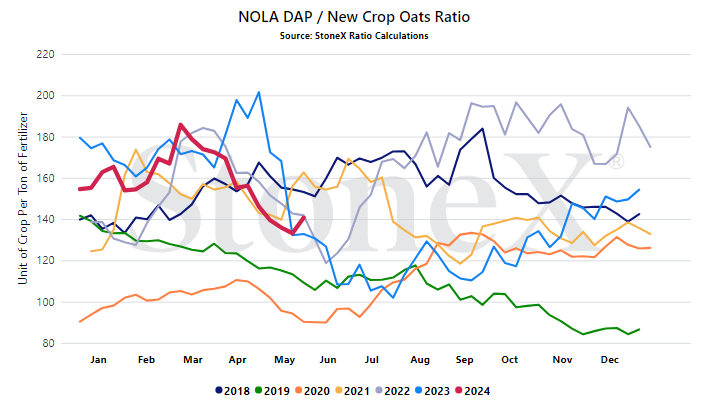
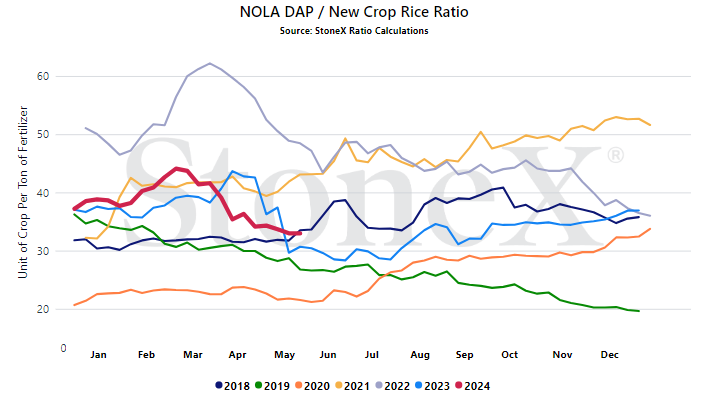
We look at the ratio "value" to get a better indication of where we are or how many bushels of X does it take to pay for 1 ton of fertilizer.
Would you rather:
-
Spend 150 bushels to pay for 1 ton of DAP
-
Spend 80 bushels to pay for 1 ton of DAP
When we compare the current ratio value against recent years, we start to see if we are high or low.
YOUR VALUES MAY LOOK DIFFERENT
This graph looks at the NOLA DAP price vs the flat grain price. There are no logistics on either product. Your location will look different due to fertilizer logistical costs, grain basis, etc.
- Chinese export programs - unlike urea, it looks like China is pressing ahead with phosphate exports. This is fantastic news for world buyers...assuming they do not change their minds. Again, that is the unfortunate part of the world being so reliant on China for phosphate. The government can completely change the scope of the world market with a single decision that has nothing to do with the fundamentals of the marketplace.
- Markets reaction to N.A. summer fill programs - Friday (before Memorial Day) saw the first round of phosphate summer fill programs be released. The price ended up being around 15 - 20% higher than last summers low's...and grain prices certainly are not higher this year vs last. Manufacturers will already have a solid "sales book" on just from their own empty storage. Then to help them out, it sounds like at least a couple distributors stepped in for some sizeable blocks. Now, the retailer/farmer sector is going to be challenged. As you can see in the ratio graphs above, there is nothing exciting about these values. They are in the middle to high region vs historical values. The sell side would be comfortable even if the program was largely a flop. However, it could send a shiver if the market largely stood up and said no. Unfortunately, no real word on how good/bad it has been received so far.
- Global supplies - I continue to think that globally, the supply outlook has improved vs this time last year. Morocco/Saudi Arabia are both doing "ok". China started rough but is rapidly improving. Russia has been beating their 3-year average. U.S. has had some production issues but again, are rapidly improving. Hopefully we will see this trend continue and get back to "normal"...which will hopefully bring with it normal pricing.
StoneX Ratio Calculation
The ratio calculation is derived from Bloomberg historical grains values as well as fertilizer values from StoneX, NPKFAS, and Argus.
The calculation is simply dividing the fertilizer price by each grain price.
All data was sourced from StoneX unless otherwise noted.




