

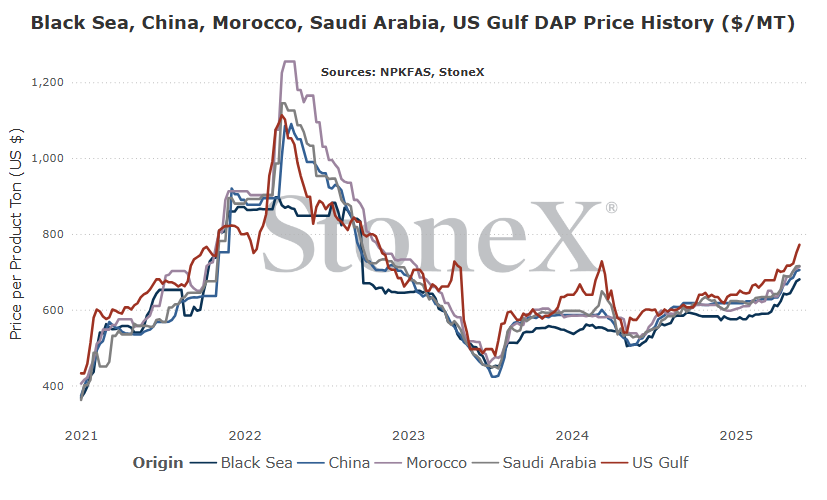
Prices are already sky high. I couldn't possibly think that they are going any higher.
Think again.
While we are still waiting for the final report from China regarding their phosphate export program, everything is pointing to a very disappointing 4M ton allowance. To put that into perspective, they are normally in the 9 - 10M tons range and hit 6.6M tons in 2024. 4M is so far below that...
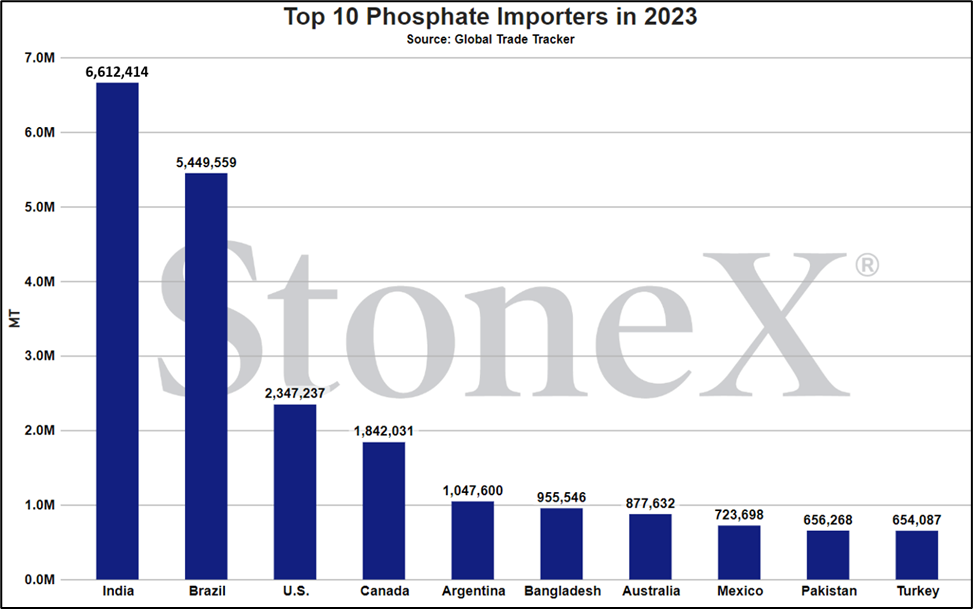
Then there is demand. India just doesn't stop. They keep hoovering up tons like it is going out of style. Of course, global manufacturers are going to take advantage.
Until there is a change either from Chinese exports improving more than we currently think (4M tons) or India's buying patterns slow substantially, likely that prices continue steady to higher.

China's export program taking shape, and it isn't good for buyers
One of the things that I have been considering over the last month is "what is normal now"? In my mind, the period from 2016 thru 2020 is normal. Global fertilizer exports were sufficient. Values were at attractive levels for the farmer. Things flowed freely. There was little to no fear of product tightness or overvaluation.
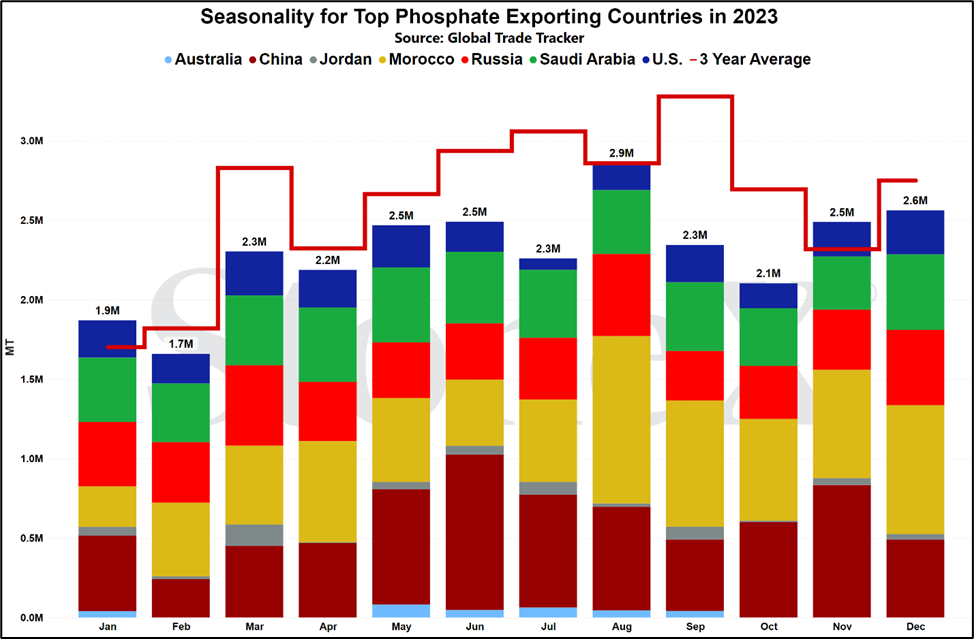
This was especially true for phosphate. The world was led by Chinese export flows. When we look at the years surrounding 2019 for Chinese DAP/MAP exports:
- 2019 - 8.8M tons exported
- 2020 - 8.3M tons exported
- 2021 - 10M tons exported
Phosphate supplies were flush.
...then later 2021 happened. Russia started to make threats about its intention to invade Ukraine which is obviously followed thru with. This, along with rising grain values, caused a run on purchases that coincided with global fears that we would lose Russian exports. Inventories got snug and prices rallied hard. The result was that some countries started to scale back their exports flows.
China was very much a part of that:
- 2022 - 5.6M tons exported
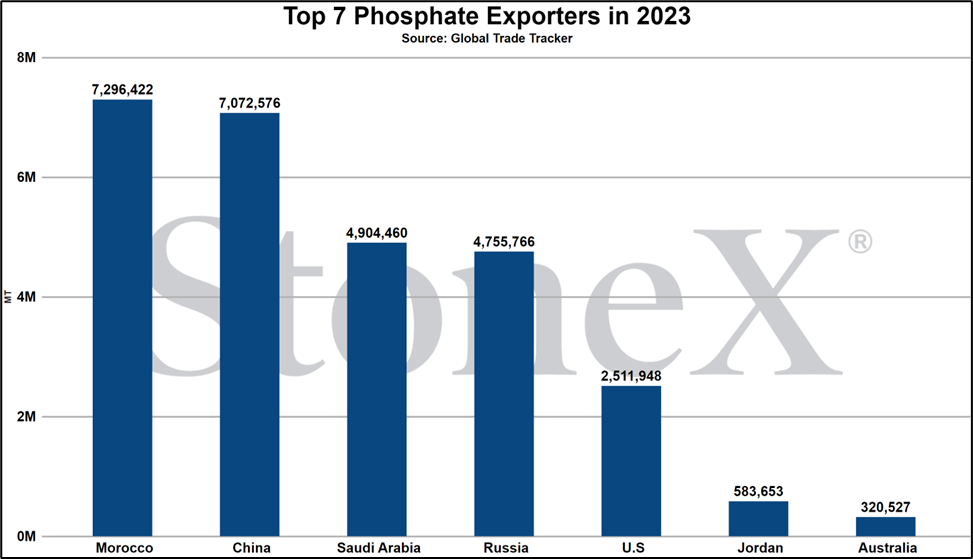
- 2023 - 7.1M tons exported
- 2024 - 6.6M tons exported
2025 has not started well. January thru April cumulative exports have only reached 155K tons. That is not a typo. I checked that number multiple times. Only 155K tons for a country that was exporting 8 - 10M tons a year not long ago.
So, back to the question: what is normal today?
While Chinese exports have been down the last 3 years, the average has been around 6 - 6.5M tons. Well short of what they had been doing, but the market had been coming to terms.
Unfortunately, intel from the last months is pointing to the world needing to prepare for even less exports.
While many details from the Chinese government regarding their phosphate export program have been released (dates, destination allowances, governments ability to shut down exports at any time), the most important piece has yet to be said: tons to be exported. However, it appears that the market believes this number is going to fall far short of market hopes and only be around 4M tons.
Today, I presume the 4M ton estimate is true that is going to be bad news for buyers. The longer China stays out of the marketplace, the more supportive of prices it remains. While there are plenty of projects in the pipe, these projects will take time (think years, not months). Now, we could certainly see a situation where the Chinese surprise us and boost their export numbers...but I'm not holding my breath. The government originally lowered exports in an attempt to boost domestic supplies and lower domestic values. This program worked like a charm for urea and appears to be taking that lesson and applying it to phosphate.
Things can and will always change. If China suddenly returns, it would likely usher in a very strong bear market but for now, they are absent and values remain supported.
India continues on its buying hot streak
I still maintain that the lack of Chinese exports is the cause of high global pricing. Losing the world's largest supplier in a market largely controlled by 5 countries has that effect. However, if no one was buying around the world, it would be hard for prices to rally. If there is no buying, there is no proof of appreciation.
This is where India comes in...
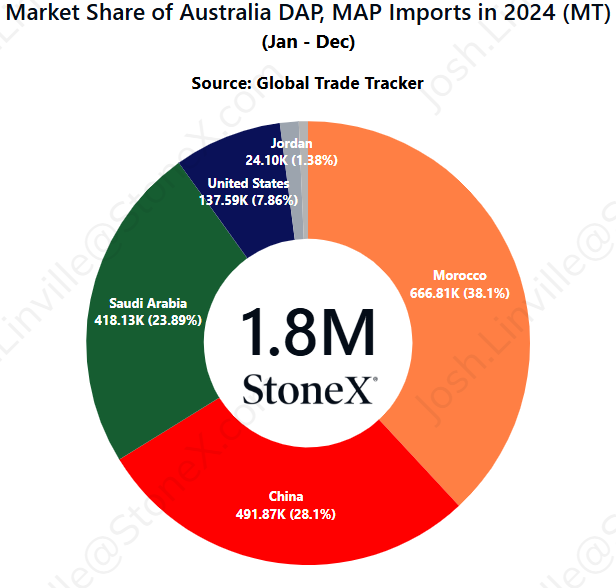
Quick backstory on why India is buying like they are. Summer of last year, the Indian government started to take an odd approach to phosphate. The way India works is that farmers do not see global price movements. Their phosphate price is set by the government and it does not change. However, as we all know, global prices do change. In order to keep imports flowing, the government sets subsidy programs that helps to bridge the gap between global pricing and domestic farmer pricing.
Over the last several years, this program has gotten EXPENSIVE.
"Why hasn't the government just went ahead and raised the farmer pricing?"
Well, India is a democracy. In fact, given their population size, you could say they are the largest democracy in the world. Of that working population, a quick google search (no, I didn't know this off the top of my head!) reveals that approximately 46% of this group is tied to agriculture in one way or another. If you are a politician, you like your position and want to continue getting reelected. Keeping fertilizer prices low is a solid way to lock up nearly half the voters...
Eventually, the subsidy cost becomes a strain on the government. That brings us to last summer. Global phosphate values were falling on the belief that Chinese exports were getting better. India made the decision to lower their subsidy rate in an effort to force global sellers to drop their price to sell India which would save them money. It started to work...until it didn't. Suddenly, Chinese exports started to get restricted again and global values started to rise.
Then India started to get behind on stockpiles.
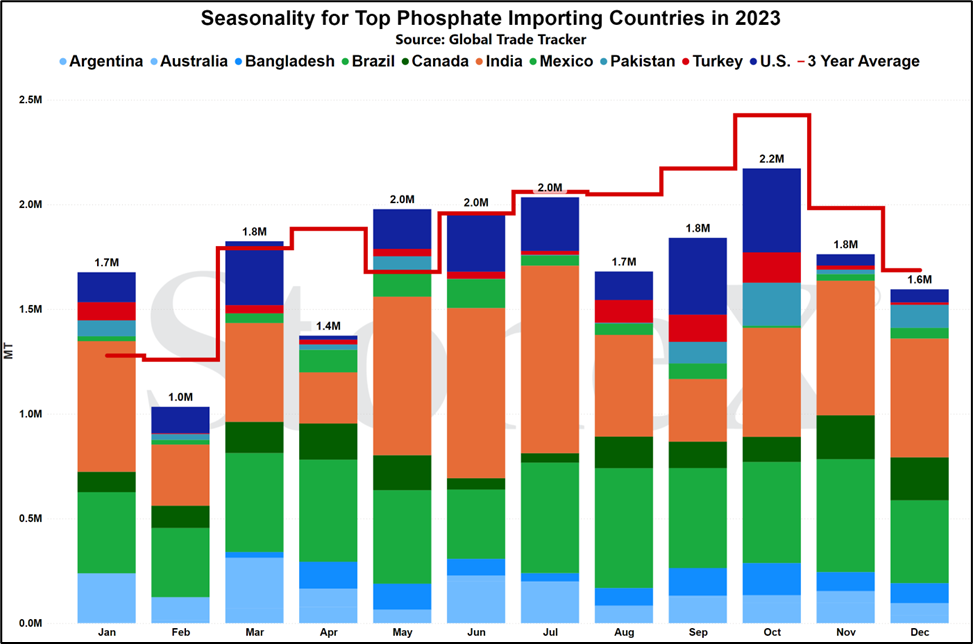
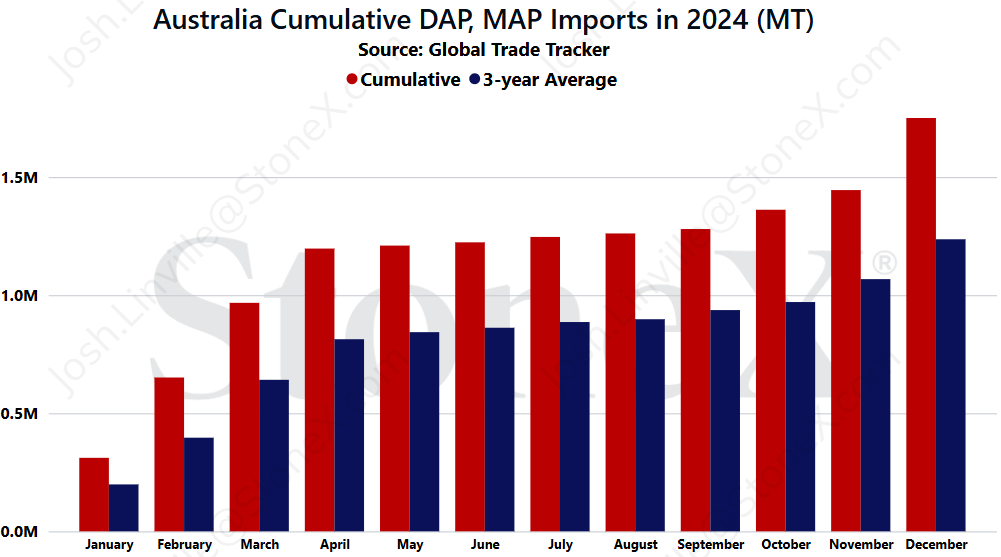
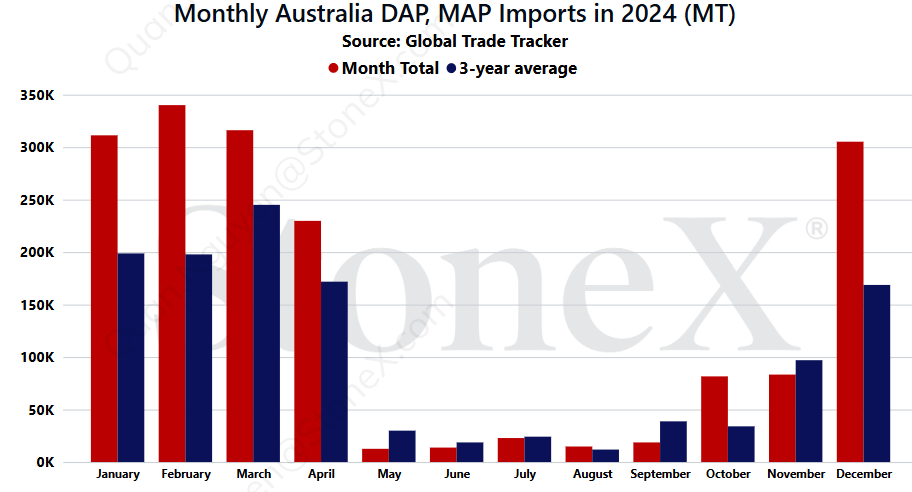
That was nearly a year ago and to a certain extent, that is where we still are. India has been a very common and frequent buyer which has been helping show/prove to other manufacturers/sellers that phosphate values are holding/rising. Yes, the lack of Chinese exports is causing the high price, but India's buying patterns continue to prove it to the market.
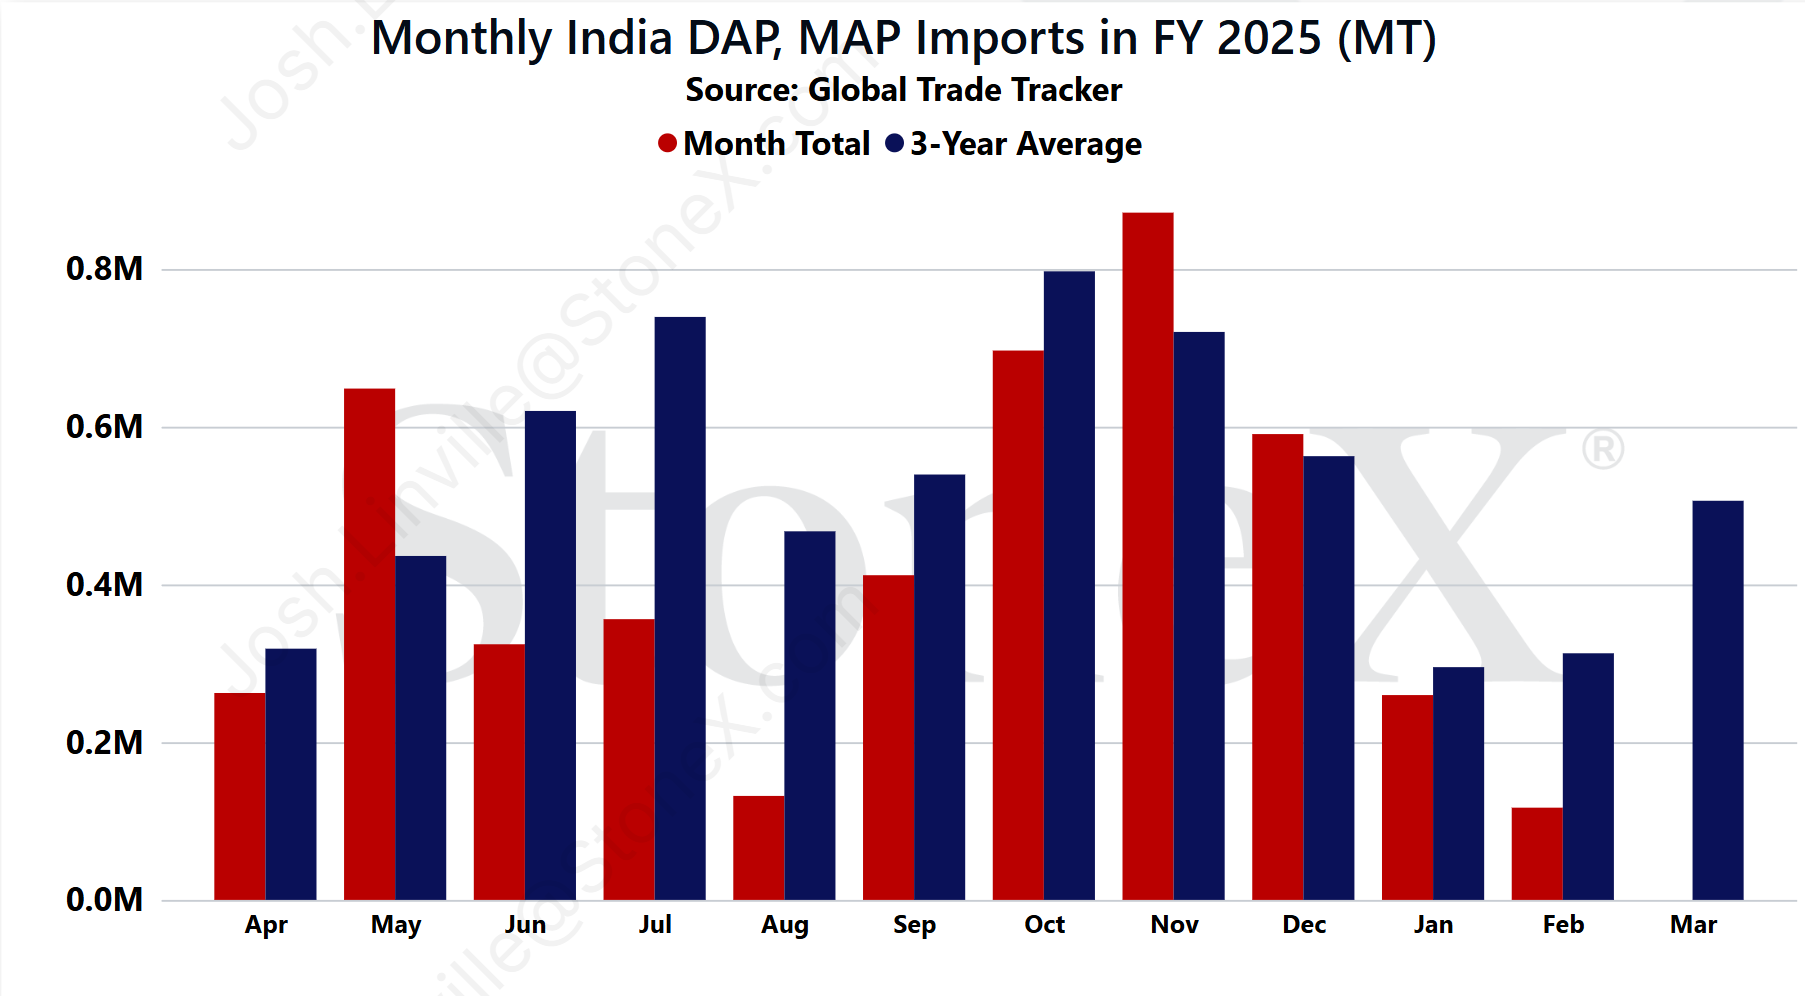
Unfortunately for those hoping that India will catch up and slow their pace, it doesn't look likely. Take a peek at the graph below. The 3-year average shows that their biggest import months are just in front of us. That does not guarantee anything but with them still appearing to rebuild stockpiles and monsoon starting early for them (good monsoon = solid fertilizer demand), hard to see their buying pace slowing.
Europe moves to further block Russian fertilizer, likely to hurt phosphate values
As the Russian invasion of Ukraine continues to drag on, tensions across Europe have been rising. The fear appears to be that Europe thinks if Russia takes Ukraine, they will not stop there. As a result, Europe is looking to put more economic pressure on Russia...in the form of blocking Russian fertilizer flows.
This will likely hurt European farmers.
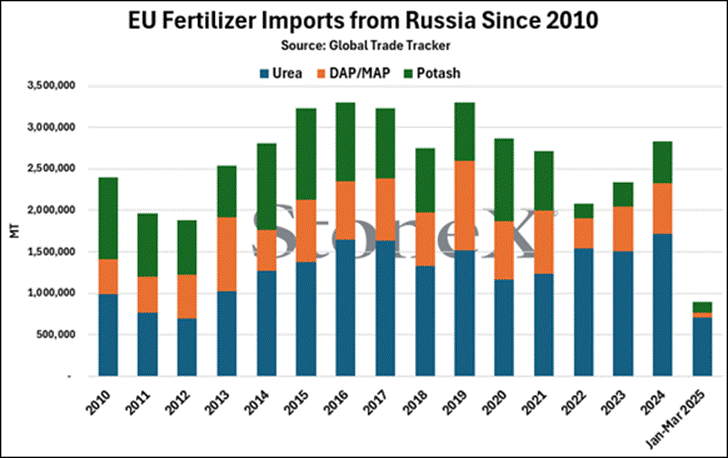
As the graph below shows, there are millions of tons of urea, phosphate, and potash that flow from Russia into the EU. These are normal and efficient trade flows which helps farmers in the space find the best price possible.
Politicians view tariffs as a win for their country. By imposing a penalty on another country, they force that country to pay them money to participate in their economy. On the surface, they are right. Any tons that flow will have to see the check cut...but at least some of that check will be paid by funds received by European farmers who are forced to pay a higher price to get their supplies.
For phosphate, Russia still has plenty of sell options around the world, especially when considering how tight the marketplace currently is. Without China at normal rates, their buyers look to other sources like Russia. It shouldn't be a problem for them to find sales destinations.
So, ultimately, this move doesn't likely hurt Russia like the EU thinks that it will. If Russia was solely dependent on EU demand, it would be a different story but that is not the world we live in today. Today, this move is very likely to hurt EU farmers...
Phosphate demand questioned as phosphate rises to 2nd worst value ever vs grains
This piece might look out of place for the Australian newsletter, but I thought it should be included. This article gives a great view of how much global farmers are struggling with global phosphate values. This is not a singular country situation. This is a stress situation shared by farmers around the world (assuming they see global replacement values).
What will N.A. phosphate demand look like for the 2nd half of 2025?
That is the biggest question in my mind, and it is a question that I think will be answered differently based on where the farmer resides.
For starters, let's look at where we are.
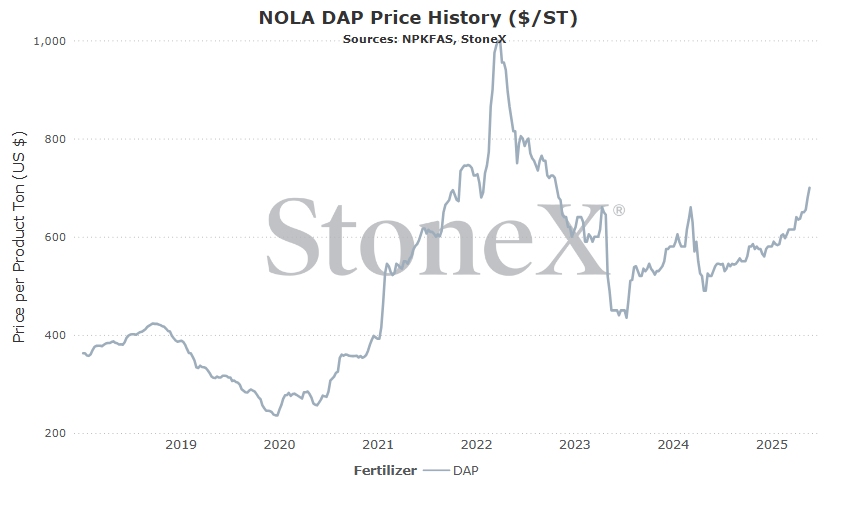
- Most recent NOLA DAP barge traded $700
- December 2026 corn sits at $4.60 (I'm rounding up)
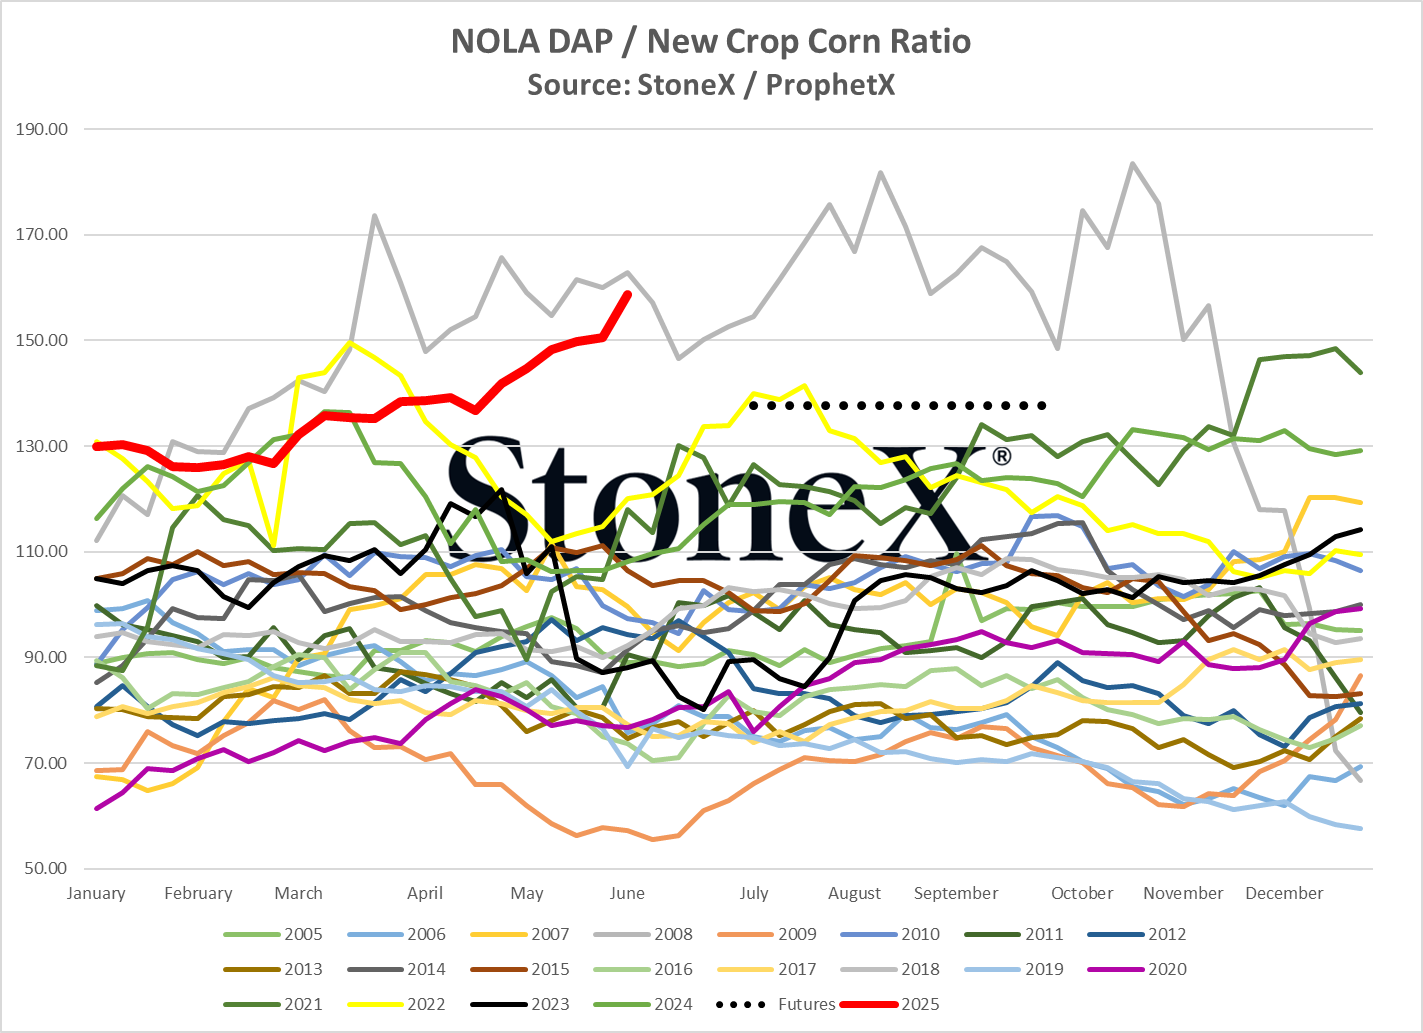
That puts the ratio relationship at approximately 152 bushels of corn to pay for 1 ton of DAP. As you can see below, that is the 2nd highest ratio relationship going back to 2005. It is actually the 2nd highest ratio relationship in history. But how do we shape up today to that period?
- 2008
- NOLA DAP - $992.50
- December 2008 corn - $6.09
- Ratio - 163
- 2025
- NOLA DAP - $700
- December 2025 corn - $4.39
- Ratio - 159
So today's ratio is slightly better than 2008, but with corn prices above $6, 2008 felt SIGNIFICANTLY better than today's situation. A $6 corn price brings in a lot more dollars for the farmer to help offset high input costs.
This takes us back to the question of what demand looks like. Frankly, we expect it to be lower. Some farmers will reduce their application rates. Some farmers will delay their applications in hopes of lower prices ahead. Some may have little choice and be forced to skip phosphate this year, regardless of yield destruction.
I also believe this answer will vary widely based on the territory. Those farmers in the core corn territories are much less likely to reduce their application rates. They may not like the price, but they also know they need to maximize yield potential and they raise enough bushels to justify it. As you get away from the corn regions, the yields fall off and it makes it harder to justify the costs. Rates should start to lower. As you move into tougher areas like the southern plains, it starts to get really hard. There is a reason all the country songs talk about hard living in red dirt states!!!! Here it is simply going to come down to math. Not enough income to justify it.
Don't get me started on wheat areas. You guys cannot catch a break.
All in all, these values are excessively high on their own and against grain values. The natural tendency will be to cut back, but a word of caution. Make application rate cuts based on solid math, not on emotion. The best decision may be to lower or skip this year. If the finances prove that, then that is the smart approach. My fear is some will make that decision out of anger. Farming is hard enough already...
Price comparisons
Vs 30 days ago - 8% or approximately $50 higher
Vs 90 days ago - 16% or approximately $95 higher
Vs 6 months ago - 22% or approximately $125 higher
Vs 1 year ago - 35% or approximately $180 higher
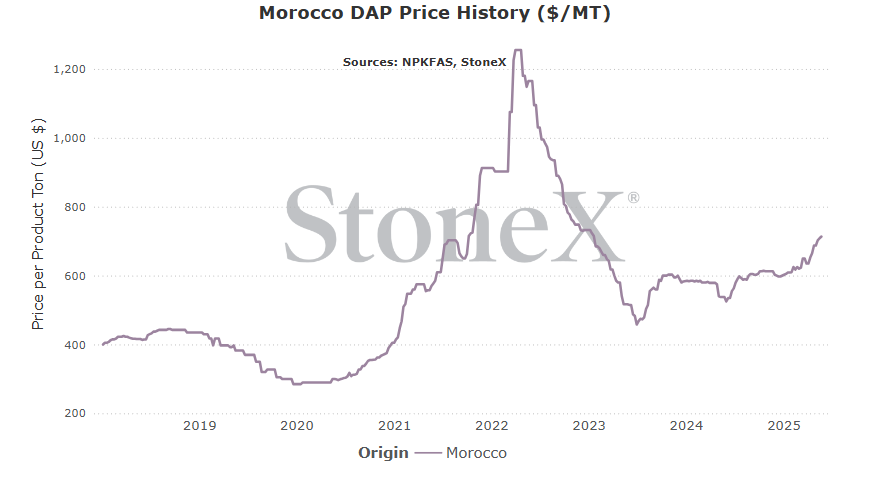
Morocco DAP price comparison
Number 1 global exporter in 2022
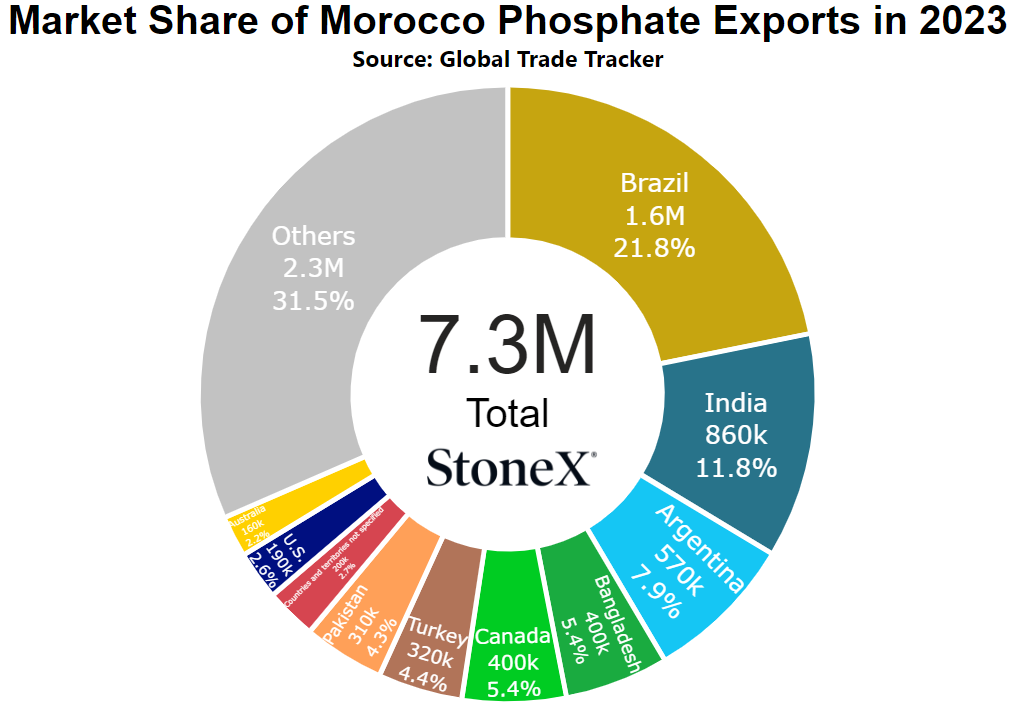
Price comparisons:
Vs 30 days ago - 4% or approximately $26 higher
Vs 90 days ago - 15% or approximately $94 higher
Vs 6 months ago - 16% or approximately $101 higher
Vs 1 year ago - 33% or approximately $176 higher
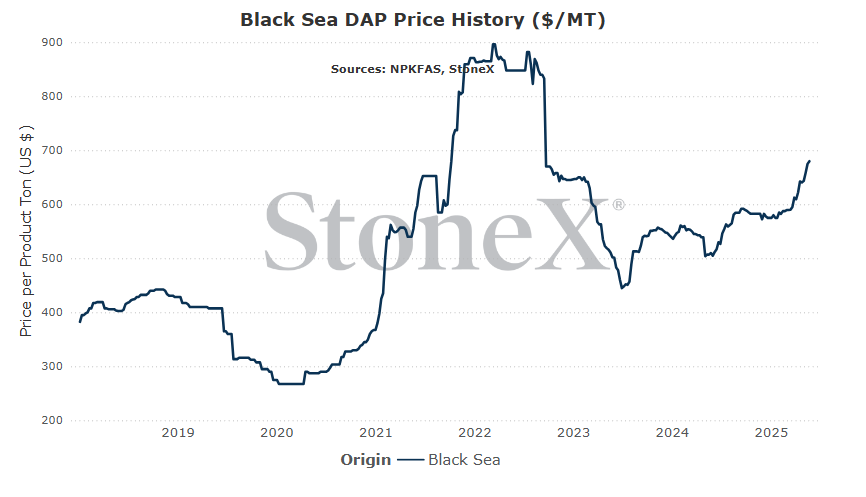
Black Sea DAP price comparison
Number 3 exporter of DAP/MAP in 2022
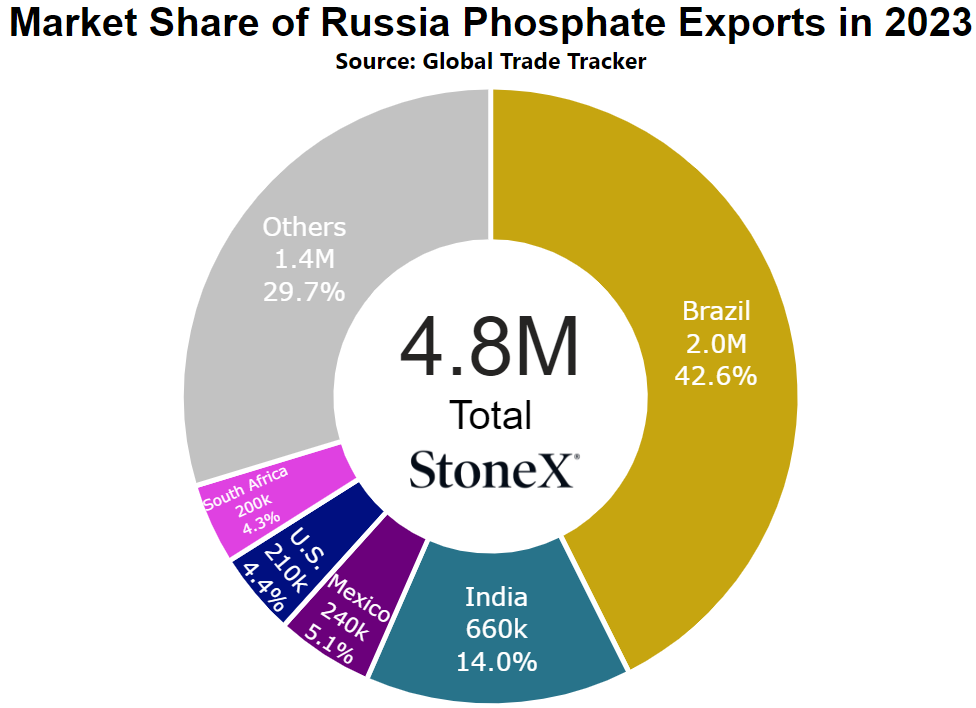
Price comparisons
Vs 30 days ago - 6% or approximately $40 higher
Vs 90 days ago - 15% or approximately $91 higher
Vs 6 months ago - 17% or approximately $98 higher
Vs 1 year ago - 33% or approximately $170 higher
China DAP price comparison
Number 2 global exporter in 2022
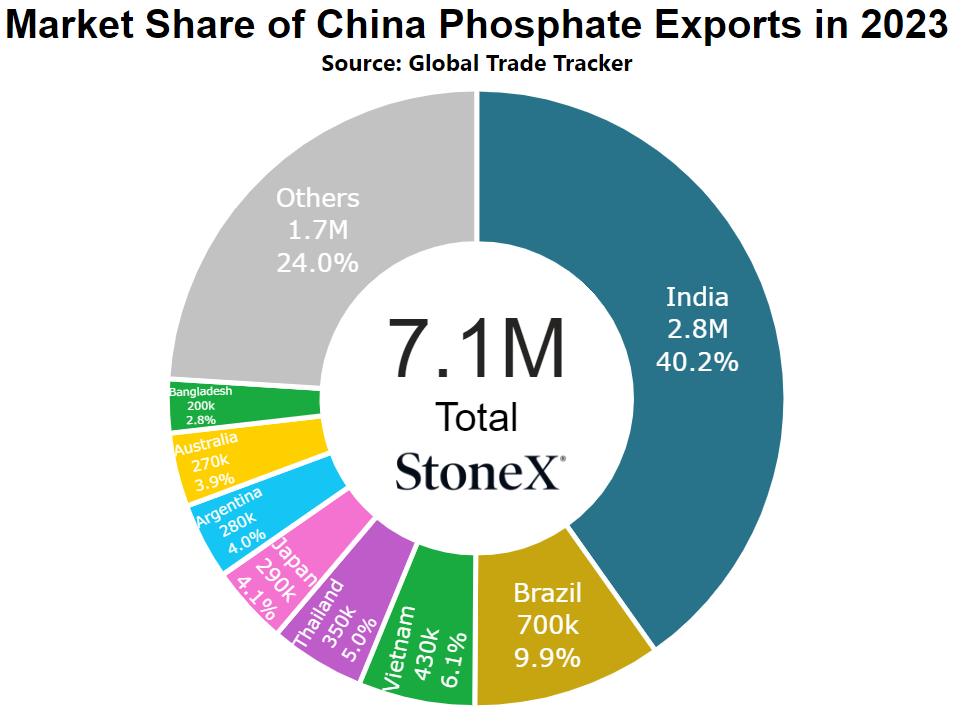
Price comparisons
Vs 30 days ago - 6% or approximately $38 higher
Vs 90 days ago - 12% or approximately $78 higher
Vs 6 months ago - 14% or approximately $88 higher
Vs 1 year ago - 39% or approximately $198 higher
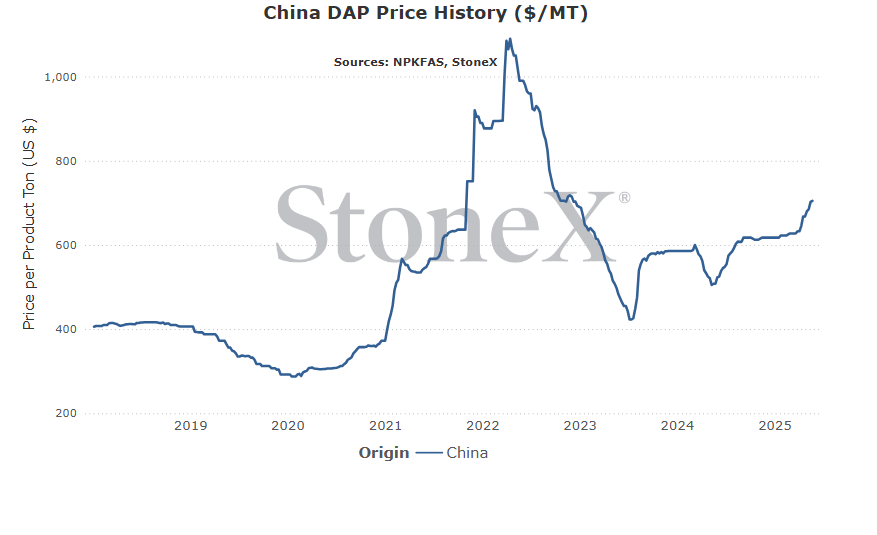
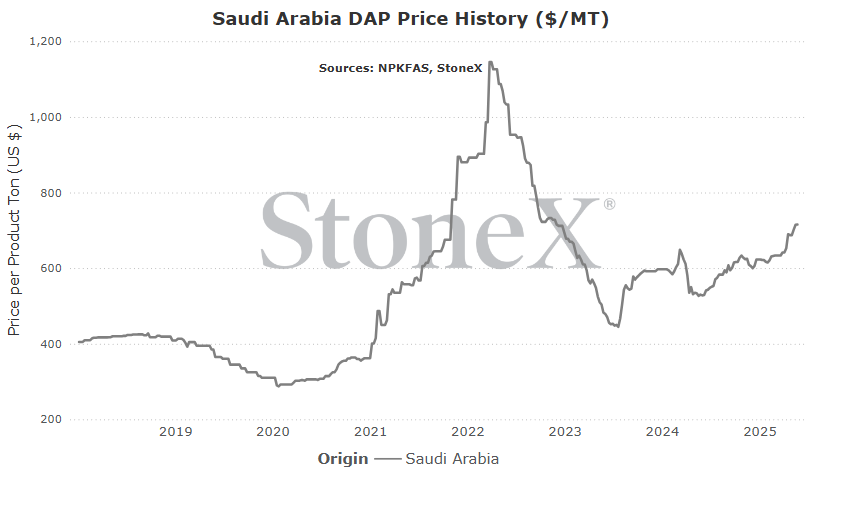
Saudi Arabia DAP price comparison
Number 4 global exporter in 2022
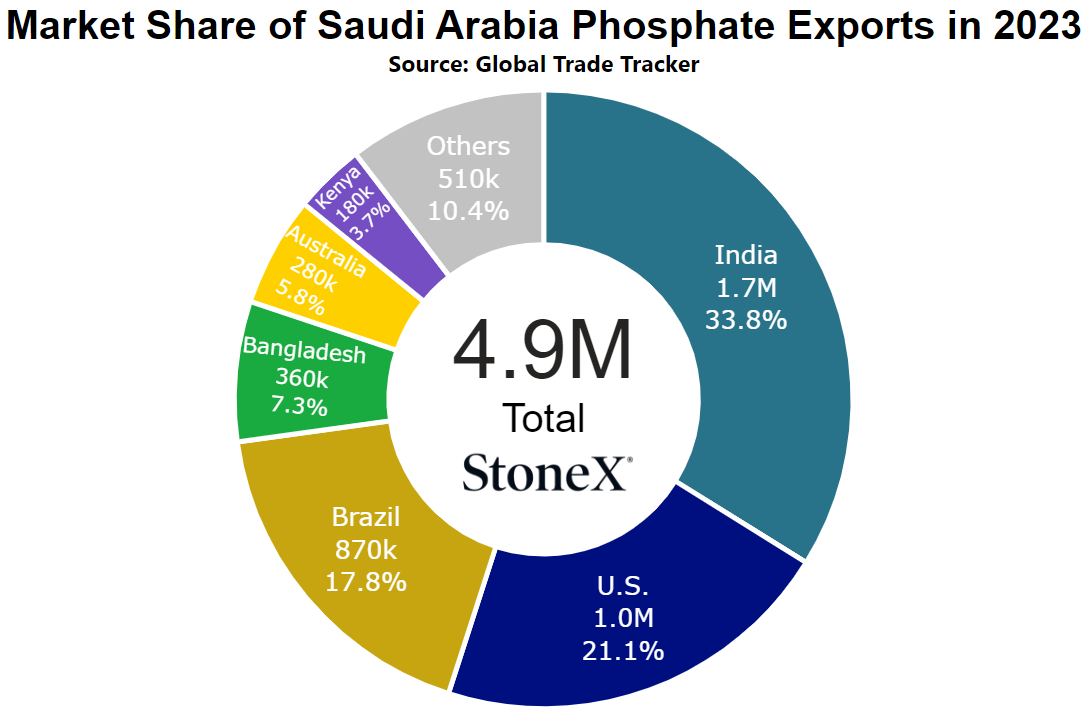
Price comparisons
Vs 30 days ago - 4% or approximately $28 higher
Vs 90 days ago - 13% or approximately $82 higher
Vs 6 months ago - 17% or approximately $107 higher
Vs 1 year ago - 35% or approximately $186 higher
- China starts exporting phosphate, domestic Chinese values start to rise, and the government puts a stop to exports – this is a very real fear in the marketplace today. As I write this, the expectation is that China will allow up to 4M tons of DAP/MAP exports. For reference, China normally exports 9 to 10M tons in a year and only exported 6.6M tons last year. Unfortunately, there is no guarantee that they hit the 4M ton mark. If the government sees domestic inventories getting to low or worse, start to see domestic Chinese phosphate values rise too much, they can hit the kill switch and stop exports well short of 4M tons. The world is already struggling with the hope of 4M. Less would be devastating.
- India continues to buy at this pace – while the lack of Chinese exports is causing the situation which is allowing global prices to rise, India's near constant buying pattern is proving it. India continues to work to rebuilt their stockpiles to ensure adequate supplies for their farmers who have a history of not being happy if stockpiles get too low. This has meant their being in the news buying blocks of DAP several times a week. Every time they buy, it is more proof that global values are still holding high. Each time they pay more for DAP, global suppliers point to it and effectively say "if they are buying it, you should to".
- Global buyers/importers start to worry more about supply availability rather than high price – a lot of the global demand attention has been paid to India given their constant buying patterns. However, Indian farmers do not see global price volatility. Their price is subsidized by the government so it is "easier" to buy. For the rest of the world, it is a hard decision. If importers around the world start to step in for next needs, it would only add fuel to the fire.
- China surprises the world and lifts the cap on export flows – let me start by saying this is a very low probability but very high impact factor. I am not expecting it to happen, but the chance isn't 0%. If China exports 4M tons and sees that domestic inventory levels are still more than sufficient for domestic demand and that domestic values have not reacted, they could decide to up their allowance. If the world suddenly hears that a total of 6 or 8M tons will be exported, that changes the market and will have long positions running for cover.
- Retailers/farmers largely reject any further purchases due to high price – unfortunately, it appears that retailers went ahead and locked in the first layer of summer fill which will give suppliers/manufacturers a sales book that will keep them comfortable for a time. I do not blame the retailer one bit here. Given the global phosphate market situation and some of the events of this spring, they likely fear a scenario where they cannot find physical resupply. They would rather have high priced tons for farmers than no tons at all. However, with this layer in place and a decent chance that farmers will reject the price ideas, that next layer may take a long time to happen. Long enough and prices could start to deteriorate to find sales.
- Actual demand destruction outpaces expectations – today, the global and domestic phosphate markets are trying to destroy demand. With India rebuilding supplies and China cutting back exports, the S&D is out of balance. The market looks at supplies and realizes that it cannot do much to change it near term. That leaves demand. To balance the S&D, demand needs to be destroyed...but can that be overdone? Absolutely. If we start to find that demand has been more destroyed than expected, you could see a knee jerk reaction with prices falling to bring that demand back.
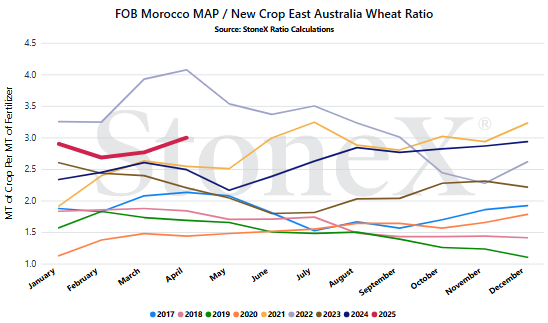
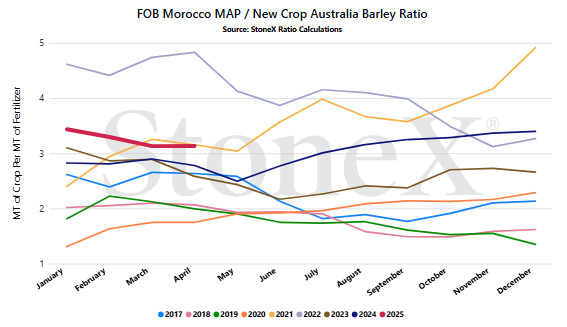
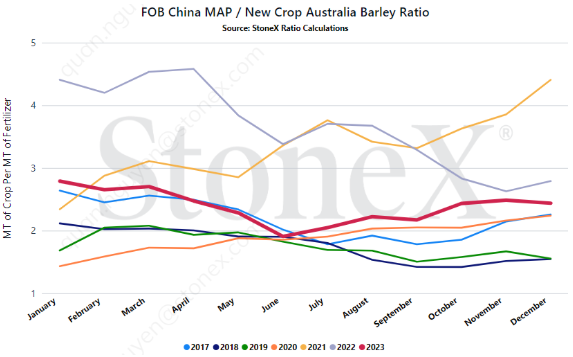
We believe that only looking at the flat price of either grains or fertilizer can be misleading:
-
Only selling grain can hurt you if fertilizer prices rise substantially
-
Only buying fertilizer can hurt you if grain prices fall
We look at the ratio "value" to get a better indication of where we are or how many bushels of X does it take to pay for 1 ton of fertilizer.
Would you rather:
-
Spend 4 ton of grain to pay for 1 ton of MAP
-
Spend 1.5 ton of grain to pay for 1 ton of MAP
When we compare the current ratio value against recent years, we start to see if we are high or low.
YOUR VALUES MAY LOOK DIFFERENT
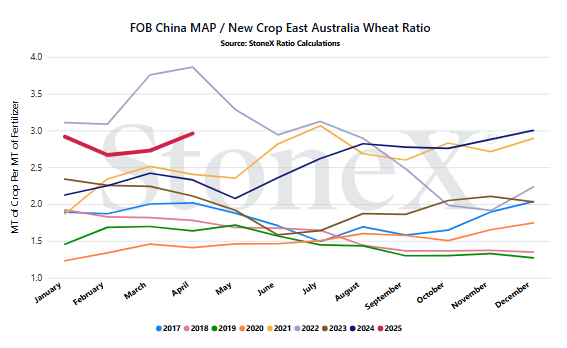
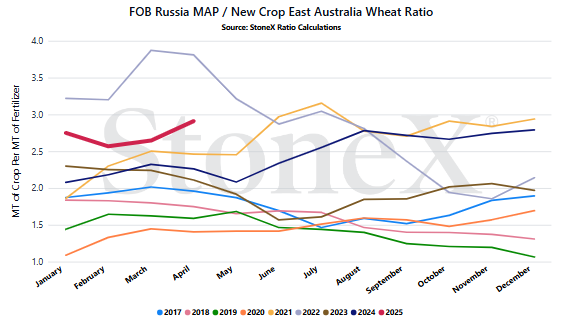
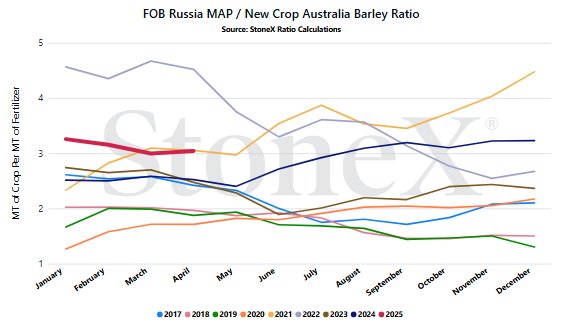
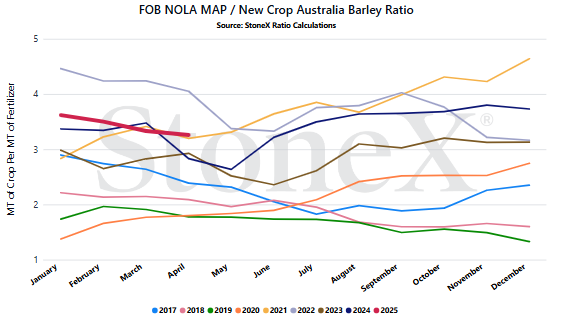
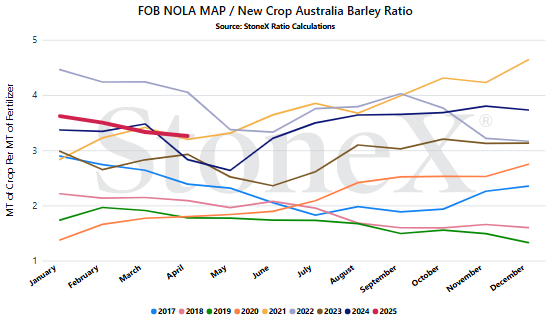
- Easily the biggest focal point is China's export program - everyone, I cannot understate how important China's export programs are for the world. Keep in mind, their normal flows are between 9 and 10M tons per year. 2024 saw them exporting a disappointing 6.6M tons. Market continue to believe this year will only see 4M tons. That is a far cry from normal flows. That is 5 - 6M tons missing from the global S&D. 4M tons may be the number on the mark. However, if they start exporting and domestic values rise too much/quickly, that number might be reduced which would hurt the world even more. On the flip side, if they export 4M tons, do not see any reaction from domestic values, and continue to be pressured by exporters, they could increase to 6 or 8M tons which would likely set the market on its butt. All eyes need to stay on China.
- Next in line is India's purchase pace - if China is causing the global phosphate situation, India is helping to prove it constantly. Everyone knows that their stockpiles had shrunk to very low levels that had to be rebuilt or face the wrath of their farmers. That has caused the current situation where India is buying blocks of tons a few times a week. Every time they purchase a layer at the same or higher price, that emboldens the rest of the market. Other suppliers/manufacturers can point to India and basically say "if India can buy it, so can you". It gives them a very powerful negotiation tool. If India would slow/stop their purchase rate, things could quiet and we could see pressure mount.
StoneX Ratio Calculation
The ratio calculation is derived from Bloomberg historical grains values as well as fertilizer values from StoneX, NPKFAS, and Argus.
The calculation is simply dividing the fertilizer price by each grain price.
All data was sourced from StoneX unless otherwise noted.




