I will say this now and will say it going forward to eternity: these are the flat price graphs for each individual location. Your price where you are is going to be different. There are logistics. There is the cost of storage/interest/insurance/etc. These graphs should not be taken as "it shows the price at $700, why isn't my price $700". These graphs should be used to give an appreciation for price movements.
All values are in metric tons and USD currency.
Global
For a while, global demand has felt "sufficient"...yet prices haven't really moved. So if we are in a pattern where decent global demand is causing prices to stay steady, what happens when that demand starts to dry up? We are quickly approaching that dry demand period of the year. On top of that, there continues to be signs that China is returning as a normal exporter. With that:
For the short term, values likely remain relatively flat but we should start to see values soft in the next 60 day period.
North America
Fortunately, there are several signals that are indicating that phosphate values in North America are set to be negative. Unfortunately, it doesn't appear that those price drops will come in time for spring application season.
As far as the reasons why it should drop:
- Chinese exports appear to be resuming which should cause global values to drop.
- Once N.A. spring demand is done, NOLA DAP should move back in line with the world vs the current large premium.
- Continues to be a chance that counter vailing duties against Morocco will be dropped.
- Demand will completely dry up once spring is over due to price correction fears / long summer period / high interest costs / etc.
All of those are great factors...for the summer. In the near term, we are fighting with a very short period between the end of fall and the start of summer as well as poor Q4 production and less than sufficient imports. Product is simply tight right now.
Over the next 60 days, phosphate is likely to push higher in the near term as the focus remains on tight supplies and large demand but will quickly transition to correcting lower once most of that demand dries up and the market fears carrying product to summer.
While the fertilizer futures market is far from as liquid as its grain counterparts, it is still active and gives us an insight into what the market is thinking.
Please note that the values below can and will change daily. This is merely a look at where they are as of writing:
|
Chinese exports are returning...we think!
Historically speaking, China is the world's largest producer and exporter of DAP and MAP. That is why the world reacted so bullishly when it started to hear that the Chinese government was putting rather strict export policies in place. While it didn't completely shut them out of the world stage, it did result in millions of tons being removed.
So if their disappearance means that the market becomes bullish, their return means that the market will be bearish...in theory...right?!
That is the expectation, at least. However, there are a few things to consider:
- Their return will take time - this should not be seen as an "immediate" change in approach. That isn't how China works. When I think about this situation, I see it more as a "summer reset" conversation rather than a "spring game changing" situation. If anything, it would have a large effect on nearby regions (Asia/Australia).
- This can change quickly - just because they are taking steps to return to exporting does not mean that they are here for the long haul. Of course, that is the hope. I really hope that they will return and stay engaged with the market long term. Unfortunately, recent history shows that is not the case. If the central government decides that exports are too heavy or domestic inventories too tight/high priced, then restrictions can be put in place in a very short order.
- Likely not going to help spring for most of the Northern Hemisphere - again, to reiterate part of the 1st point, I do not think this will help the spring season for most of the Northern Hemisphere. There isn't enough time. If anything, it might help the tail end of spring if the market is long and distributors decide to start a fire sale rather than risk carrying it to summer. Given the price risk that has been out there, hard to see many places that are uncomfortably long.
Otherwise, I also do not think we will see China in a catch up mode meaning we are not likely to see them increase their exports vs normal to hit their average annual exports. This is more likely to mean that from March/April and onwards, they will hit their monthly averages.
Regardless, this is a fantastic step toward normalcy which has been rather difficult to find in the last few years.
Red Sea attacks do impact western shipping phosphate vessels
Up until a couple weeks ago, when we discussed Houthi Rebel attacks in the Red Sea, it was always other products and not fertilizer. Then it happened. A vessel that had originated from Saudi Arabia and was destined for the west was hit. While I do not believe there were injuries, the crew was forced to abandon ship due to the damage done. This brought this situation home for fertilizer. I still have not seen or heard what type of fertilizer the vessel was carrying. It really doesn't matter.
This gives ship owners/crews even more reason to opt to go south around Africa going forward and will likely continue to do so until confidence in safe passage returns. Fortunately, the southern route exists so product is not completely cut off. However, it does take more time and higher freight rates to go that direction. Normally, that isn't a huge deal but for right now, it very much is.
North America wiped out phosphate inventories last fall and ran clear until mid-December. Then, we found that N.A. production in Q4 was substantially lower than normal. Now, we have had spring starting way earlier than normal (mid-February). 2 months is simply not enough time to refill the system. Adding an additional 2 weeks of sail time can mean the difference between making it in time for spring...and having those tons only be available for summer fill.
Early start to North American spring complicates matters (i.e. higher prices)
This was going to be a difficult spring for phosphate on normal terms.
- Fall run was large enough to empty the system
- Fall run continued to a late mid-December timeframe
If spring had started normally (mid-March for many), it was going to be hard to get refilled and prepared for the run. I think we even talked a bit about how an earlier start would make it worse. Never thought that would become reality.
Unfortunately, mother nature reminded us that she is always in control!
Many parts started much earlier than normal. Here north of Kansas City, there were spreaders in the fields during first half of February. Then, the forecast remained warm and dry for wide swaths of the Midwest. Eventually, more and more areas started to roll.
Today, that run continues and product remains insanely tight which is showing up in price form. Since January, NOLA DAP values have rallied around $50+ and are showing signs that more is coming. Sellers of physical product are hard to find and distributors/buyers are scrambling to make purchases to cover the early start. Suddenly, price has become the 2nd or 3rd thing discussed in negotiations.
Eventually, this will come to an end. It is just a matter of how much worse it gets before it gets better.
Recent phosphate rally/poor grain markets create terrible ratios
And here I thought the worst was behind us.
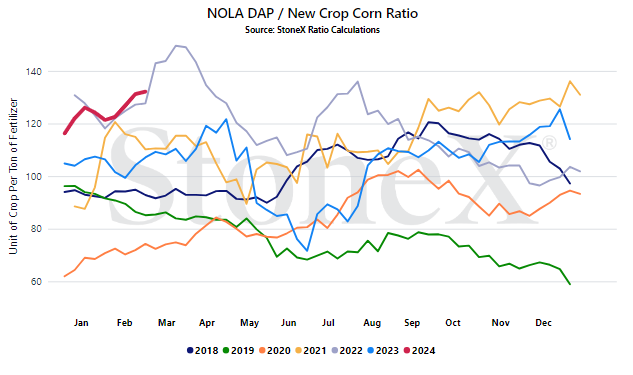
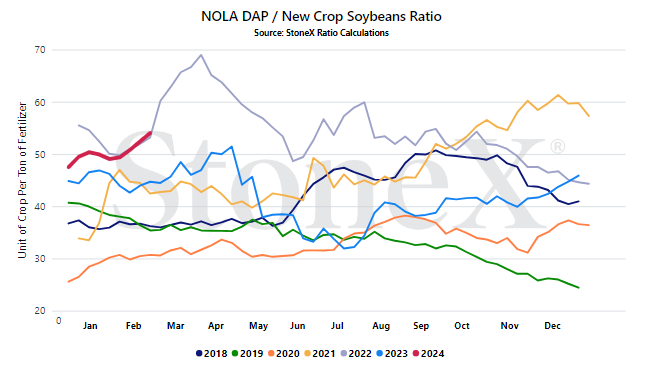
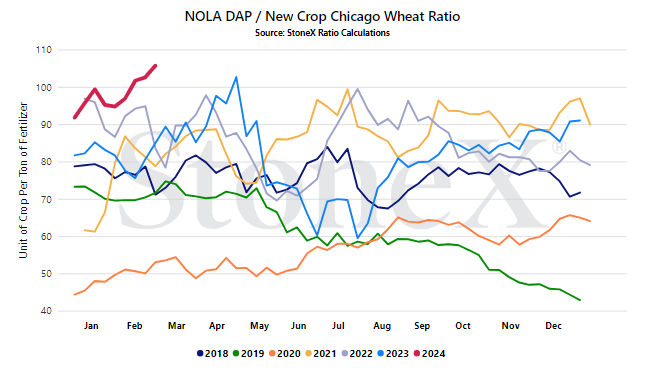
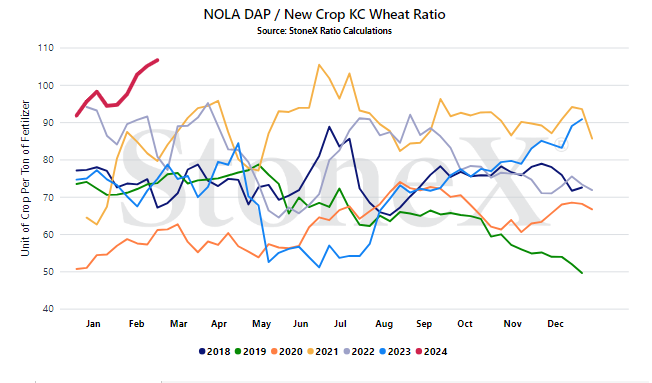
We have seen the perfect crap storm building for phosphate and grains. Here, I'm going to focus on corn but look below to check out the other ratios. They are nowhere near good...
For a while, we had watched December 2024 corn float in the $5.10 - $5.25 range. While phosphate value were high, the higher corn price helped to offset it. Then, the sell off occurred. I'll spare you the gory details but today, December 2024 corn is closer to a $4.45 - $4.60 range. To make matters worse, phosphate prices have risen significantly. This morning, I watched a 1st Half March NOLA DAP barge trade at $635. After the trade, higher bids were discussed but offers had pulled out of the market in hopes of higher prices still come Monday.
So where does that put the current ratio?
- December 2024 Corn - $4.56 (where it is as I write this)
- NOLA DAP - $635 (I'll use last done rather than the higher bids)
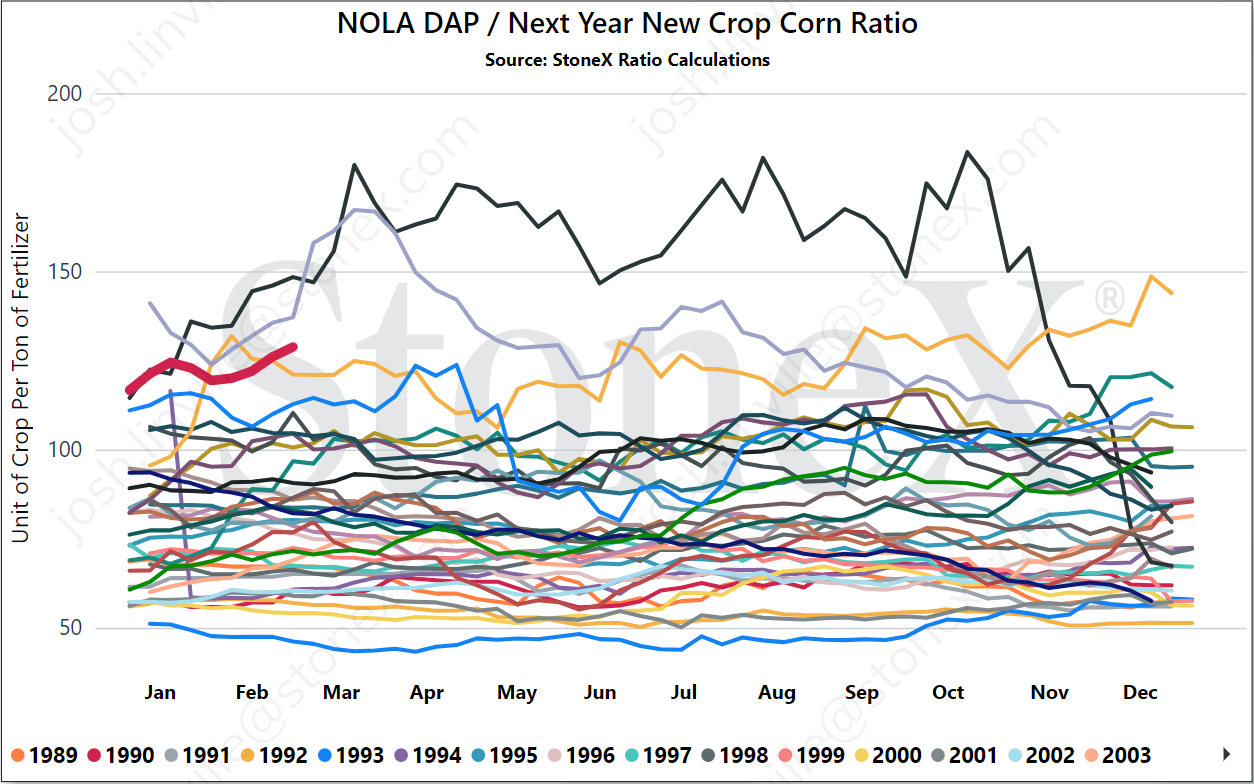
That puts the current ratio at 139+. How does that shape up?
Below is the historical DAP/corn graph going back to 1989. I know, that is a lot of lines. Unfortunately, current ratios are high enough to stand out from the masses. For this part of the calendar, this is right in line with the 2nd highest ratio going back literally decades. The only year that was worse was 2008.
One last point on this and please do not take this as me trying to say "I told you so". Frankly, last summer, I wasn't convinced we were as low as we were going to go. But this is a great learning lesson.
During June/July of last year, had we locked in Dec '24 corn (I know there are risks going that far forward) and locked in phosphate, we could have hit a low of 80 bushels per ton (your numbers likely look different, FYI). So back then it was 80. Today it is nearly 140. That means that at the valley/peak, we could have saved 60 bushels of corn for every ton of DAP we use. Regardless of the situation, that is real savings.
Again, this is more educational so that when the next opportunity pops up, we are more prepared.
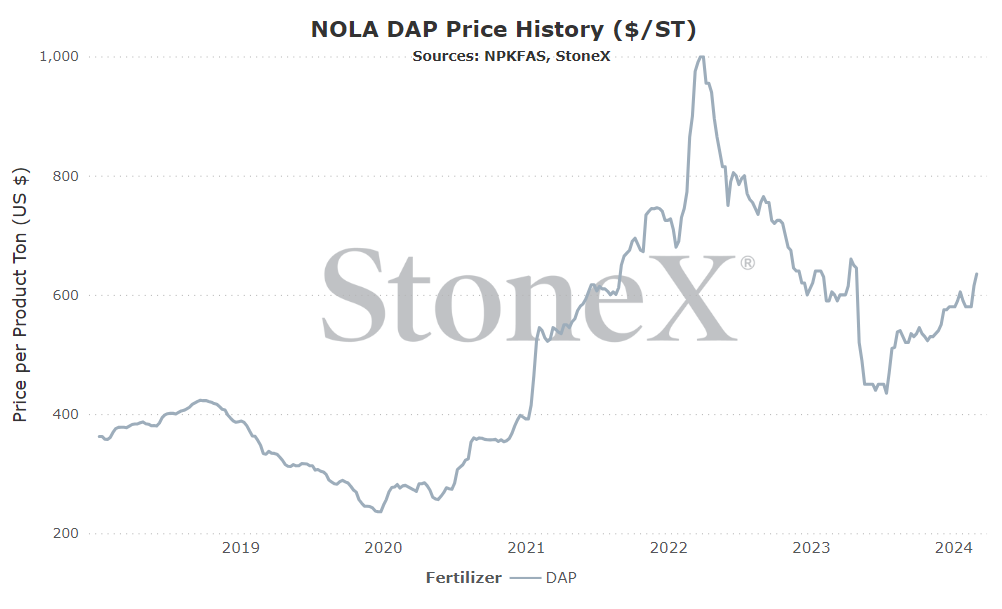
NOLA/New Orleans, Louisiana DAP price comparison
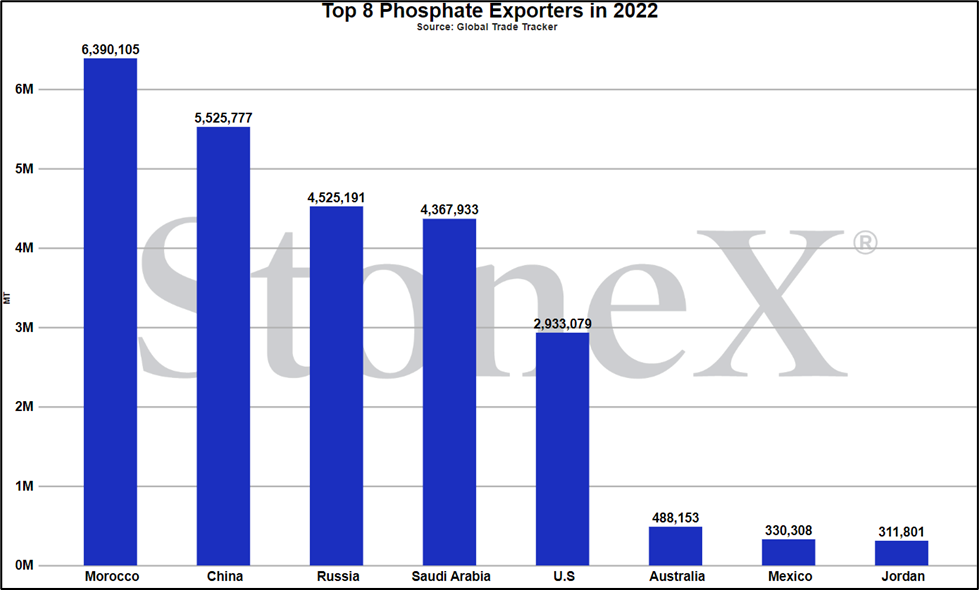
Number 5 global exporter in 2022
Price comparisons
Vs 30 days ago - +9% or approximately $55 higher
Vs 90 days ago - +18% or approximately $95 higher
Vs 6 months ago - +20% or approximately $105 higher
Vs 1 year ago - +6% or approximately $35 higher
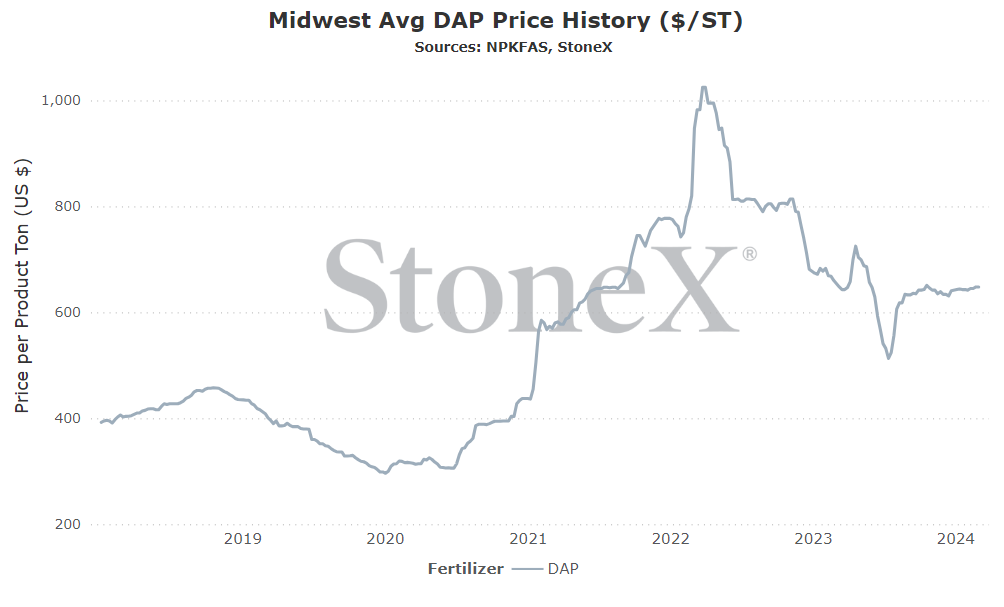
U.S. Midwest Average (using multiple points across Midwest) price comparison
Vs 30 days ago - +1% or approximately $6 higher
Vs 90 days ago - +1% or approximately $9 higher
Vs 6 months ago - +2% or approximately $14 higher
Vs 1 year ago - -1% or approximately $6 lower
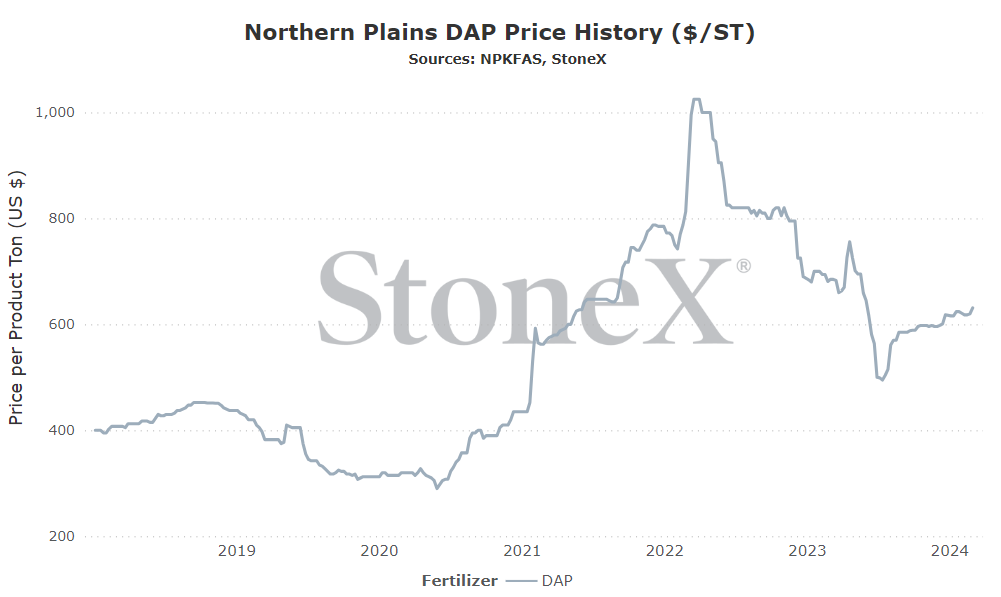
U.S. Northern Plains Average price comparison
Vs 30 days ago - +2% or approximately $10 higher
Vs 90 days ago - +6% or approximately $35 higher
Vs 6 months ago - +8% or approximately $46 higher
Vs 1 year ago - -8% or approximately $54 lower
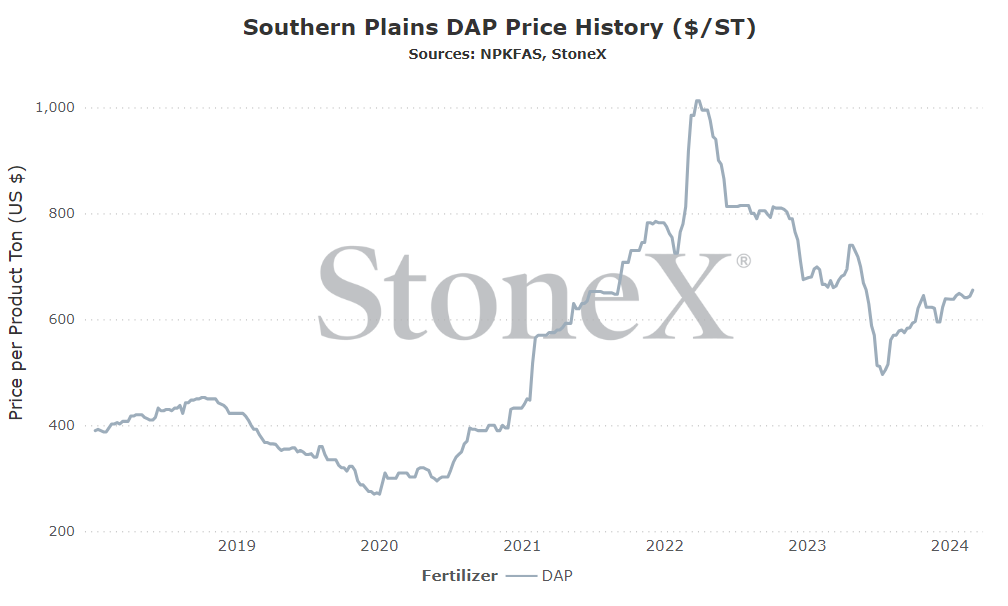
U.S. Southern Plains Average price comparison
Vs 30 days ago - +1% or approximately $9 higher
Vs 90 days ago - +5% or approximately $34 higher
Vs 6 months ago - +13% or approximately $78 higher
Vs 1 year ago - -3% or approximately $18 lower
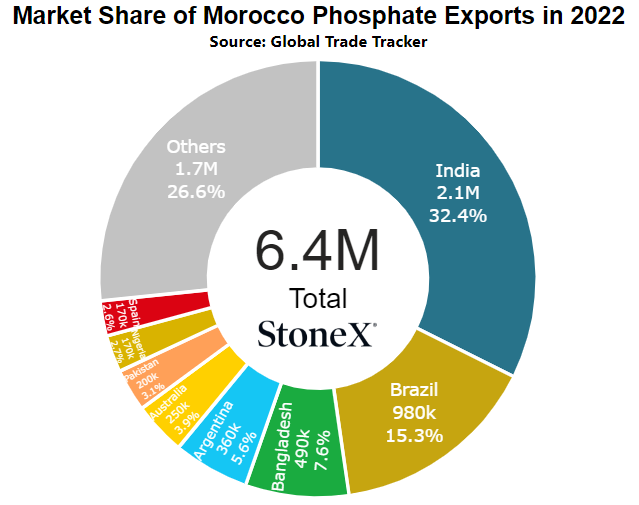
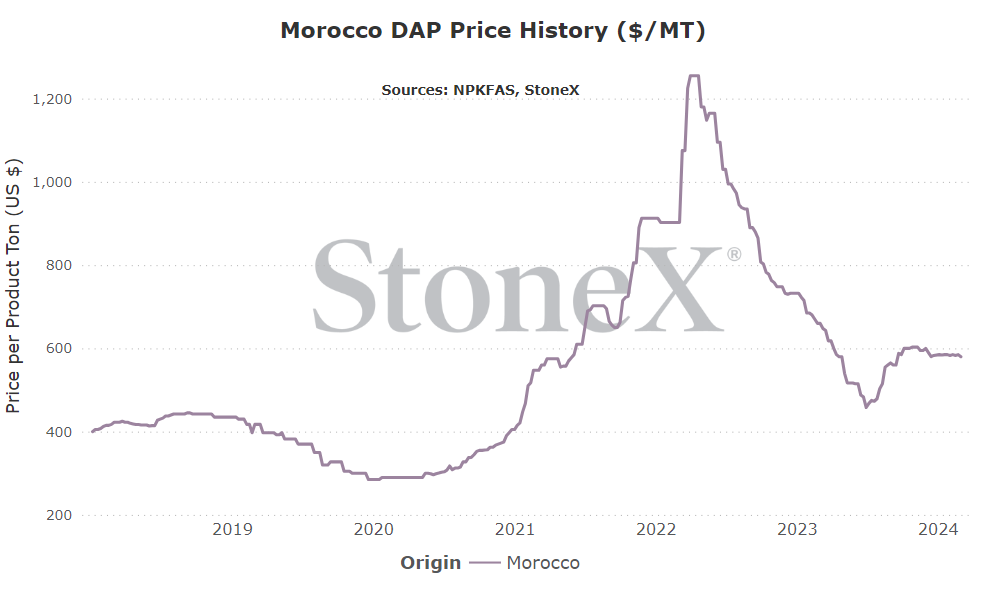
Morocco DAP price comparison
Number 1 global exporter in 2022
Price comparisons:
Vs 30 days ago - unchanged vs last month
Vs 90 days ago - -3% or approximately $17 lower
Vs 6 months ago - +4% or approximately $20 higher
Vs 1 year ago - -12% or approximately $80 lower
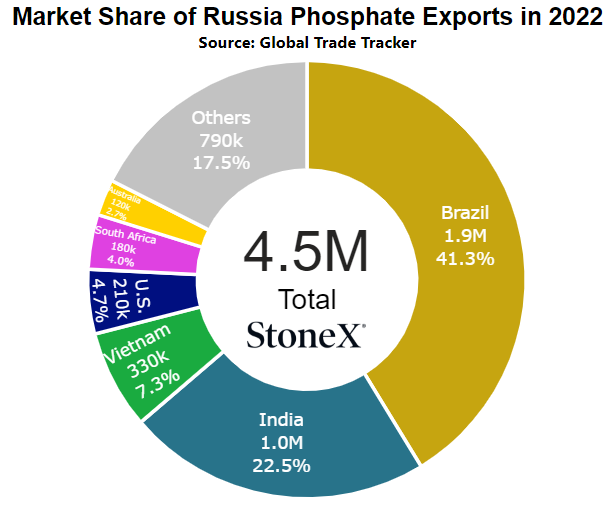
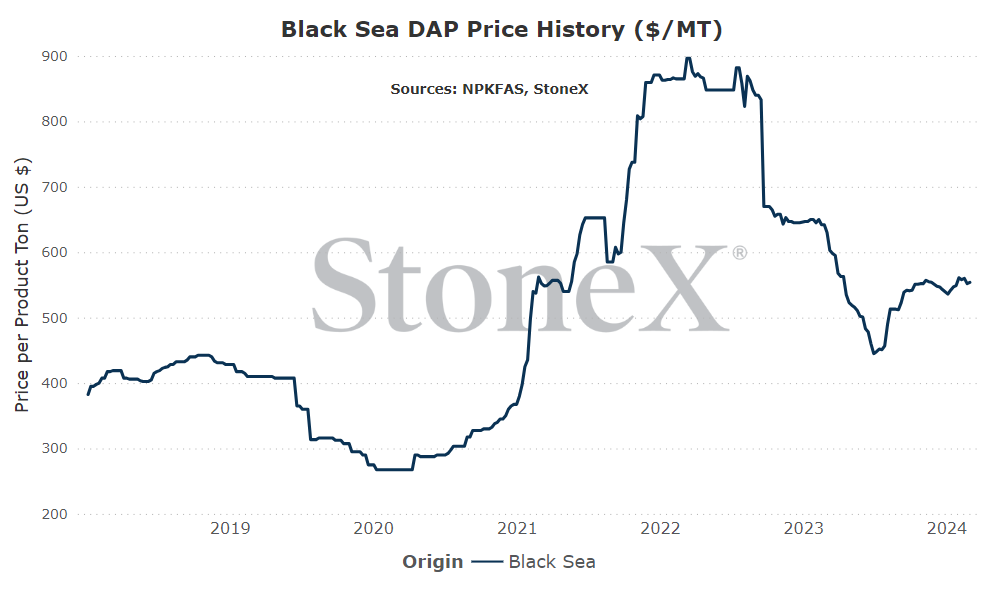
Black Sea DAP price comparison
Number 3 exporter of DAP/MAP in 2022
Price comparisons:
Vs 30 days ago - -1% or approximately $7 lower
Vs 90 days ago - unchanged vs 3 months ago
Vs 6 months ago - +8% or approximately $41 higher
Vs 1 year ago - -12% or approximately $76 lower
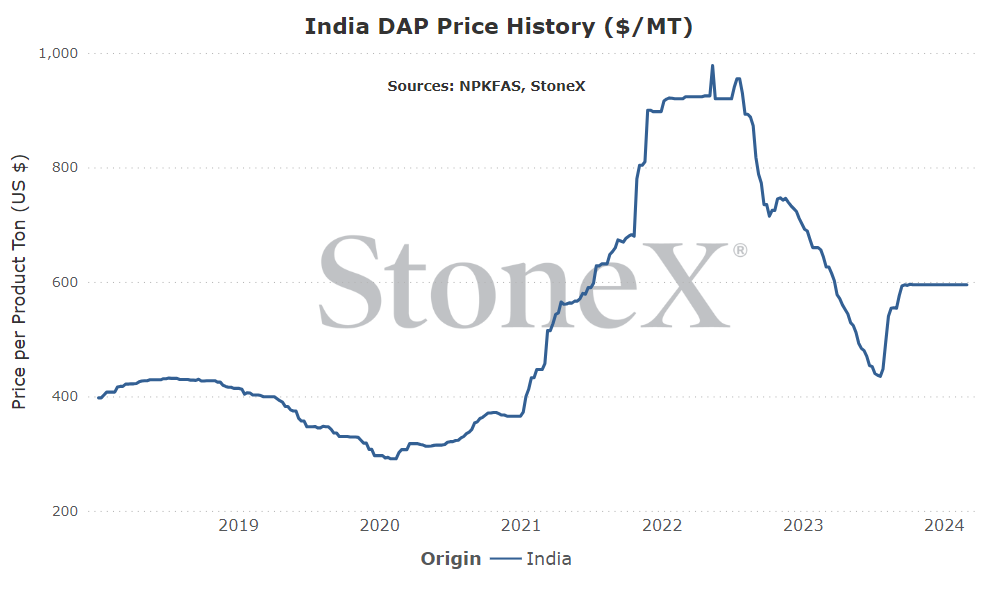
India DAP price comparison
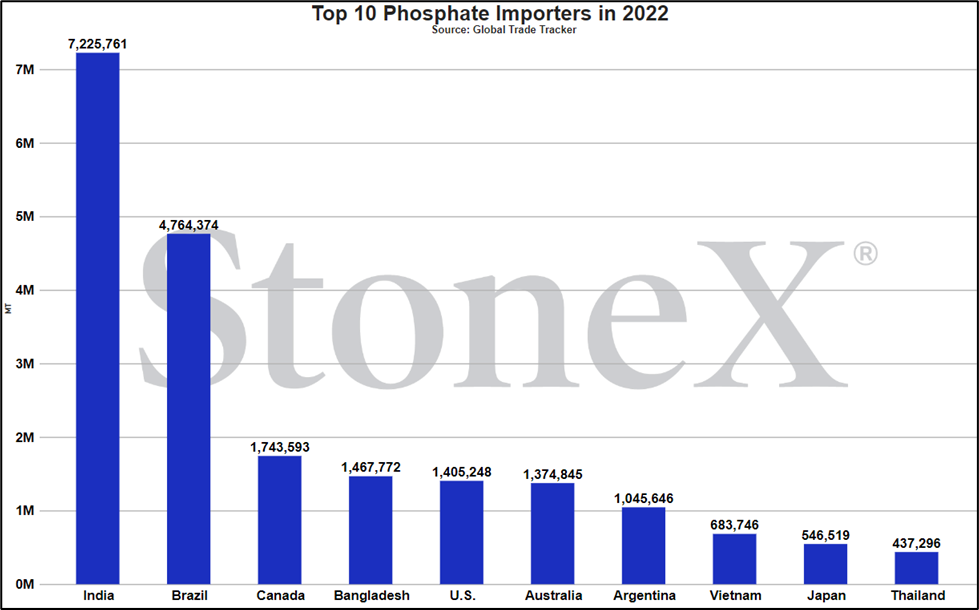
Number 1 global importer in 2022
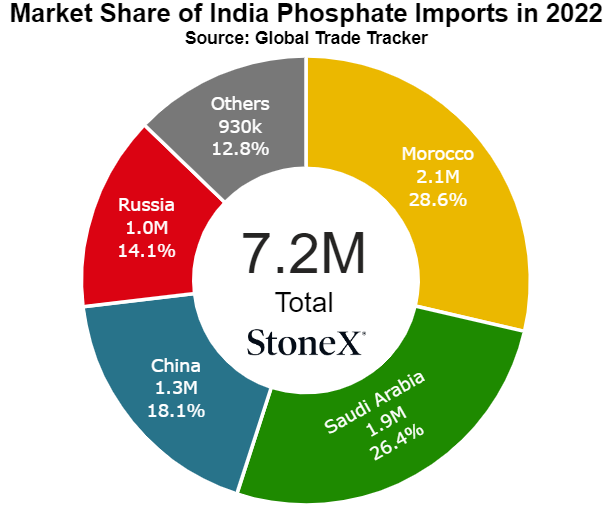
Price comparisons:
Vs 30 days ago - unchanged vs last month
Vs 90 days ago - unchanged vs 3 months ago
Vs 6 months ago - +7% or approximately $40 higher
Vs 1 year ago - -5% or approximately $31 lower
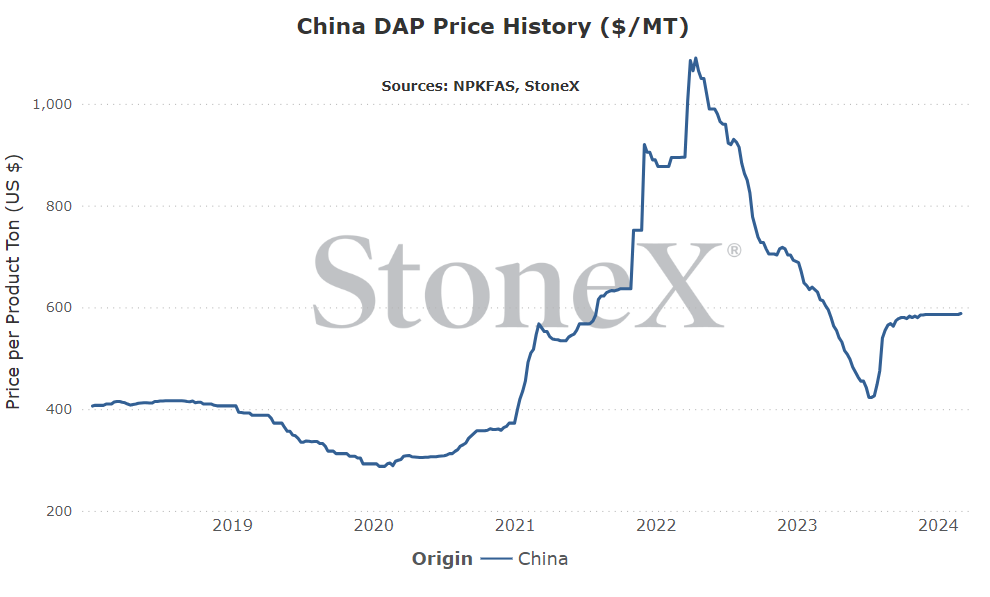
China DAP price comparison
Number 2 global exporter in 2022
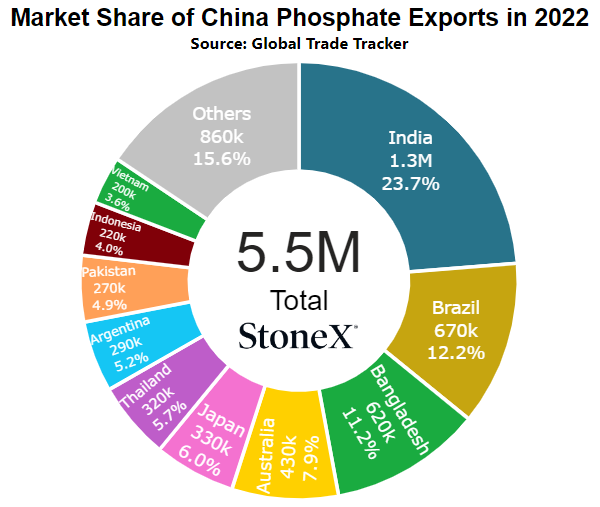
Price comparisons:
Vs 30 days ago - unchanged vs last month
Vs 90 days ago - unchanged vs 3 months ago
Vs 6 months ago - +4% or approximately $23 higher
Vs 1 year ago - -4% or approximately $28 lower
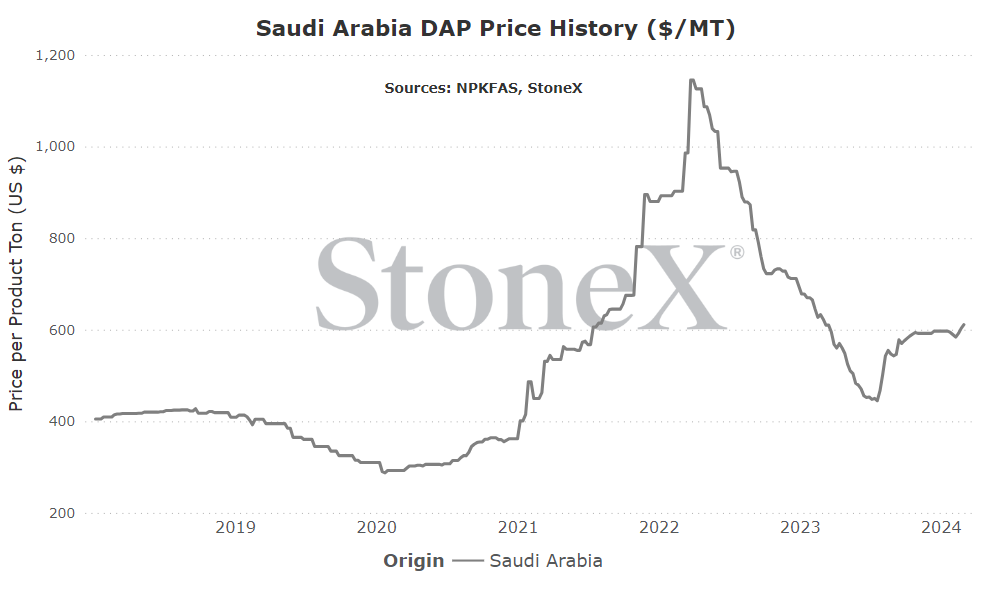
Saudi Arabia DAP price comparison
Number 4 global exporter in 2022
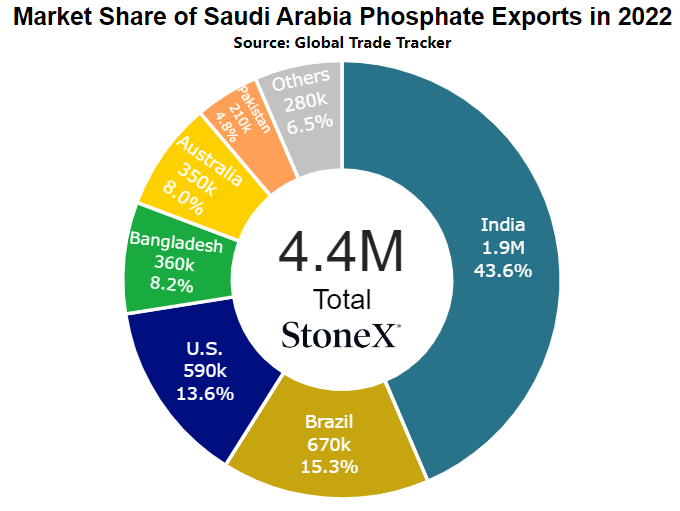
Price comparisons:
Vs 30 days ago - +4% or approximately $22 higher
Vs 90 days ago - +3% or approximately $19 higher
Vs 6 months ago - +12% or approximately $64 higher
Vs 1 year ago - -2% or approximately $12 lower
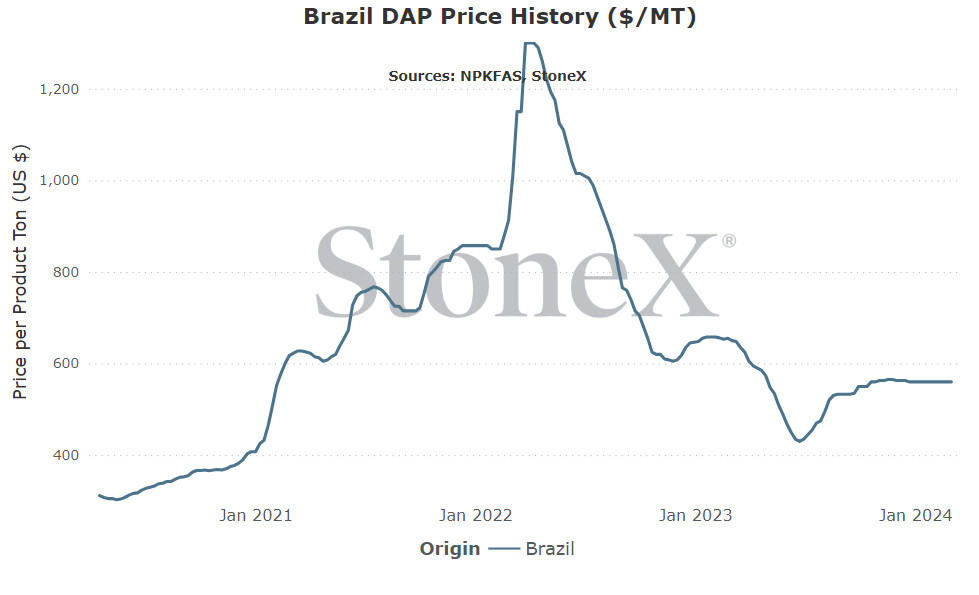
Brazil DAP price comparison
Number 2 global importer in 2022
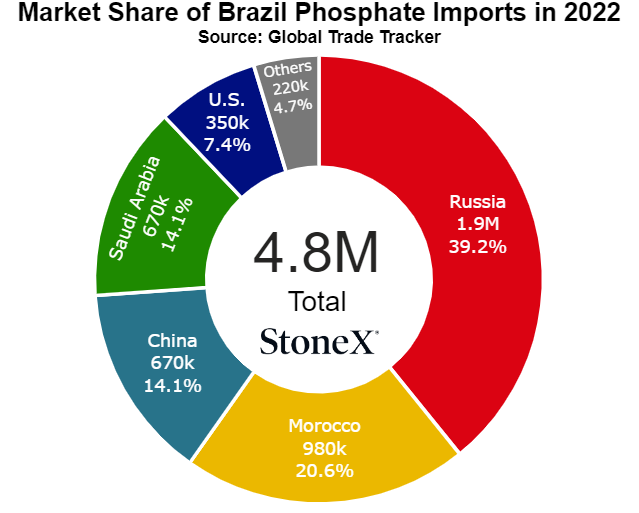
Price comparisons
Vs 30 days ago - unchanged vs last month
Vs 90 days ago - -1% or approximately $5 lower
Vs 6 months ago - +5% or approximately $28 higher
Vs 1 year ago - -14% or approximately $90 lower
- Russian sanctions including phosphate – Russia just cannot seem to keep itself out of international headlines. This time it was the assassination of a political opponent. While I see it as very unlikely that the world will sanction Russian fertilizer, the chance is not zero. If by some chance that does happen, it will disrupt the world of phosphate. Russia is far to large a player for it to be ignored.
- China slowing exports...again – right now, we are finally seeing positive signs that Chinese exports are set to resume...but this is China we are talking about. We have seen this before. As much progress has been made for their return, it only takes one announcement to remove them.
- Extreme tight supplies and early spring for N.A. – normally, the system gets a 3+ month period to refill in preparation for spring. This year is not normal. Inventories were nearly emptied and season ran until mid-December. Starting normally in mid-March would have been tough enough. Starting mid-February is darn near impossible. The market is going to be playing catch up, and that pushes price ideas higher.
- Phosphate is overpriced vs grain values – take a look at the ratio graphs below. Phosphate prices are WELL above normal. They are no longer just "high". They are now at or near record high. A correction must come or a demand reckoning will be next.
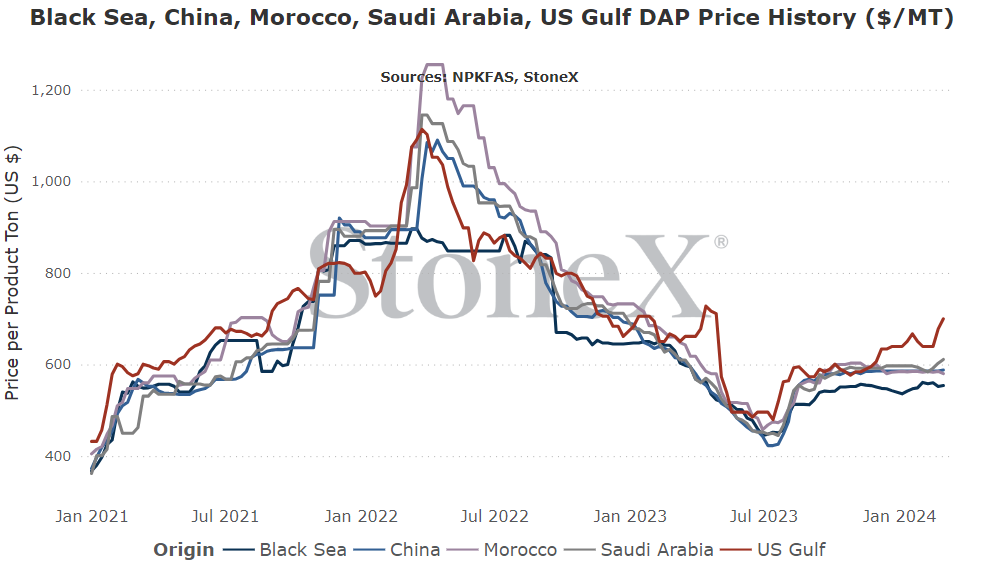
- N.A. values are well overvalued vs world pricing – go to the top of this newsletter and look at the international phosphate price chart. Before 2020, NOLA values stayed in line with international values. In fact, they spent most of their time either in the middle or the lower half. Right now, NOLA is setting the global high. That cannot last forever. The long summer period will likely bring NOLA back into line.
- China looks as though they are allowing exports to resume – this is the big one. China is normally the world's largest exporter but recent government intervention has caused them to drop. Now, we are seeing signs/reports that exports are being allowed to resume. Will they catch up and end the year at normal levels? Not likely. However, just the simple fact that they are returning to normal should have market participants expecting values to fall.
We believe that only looking at the flat price of either grains or fertilizer can be misleading:
-
Only selling grain can hurt you if fertilizer prices rise substantially
-
Only buying fertilizer can hurt you if grain prices fall
We look at the ratio "value" to get a better indication of where we are or how many bushels of X does it take to pay for 1 ton of fertilizer.
Would you rather:
-
Spend 150 bushels to pay for 1 ton of DAP
-
Spend 80 bushels to pay for 1 ton of DAP
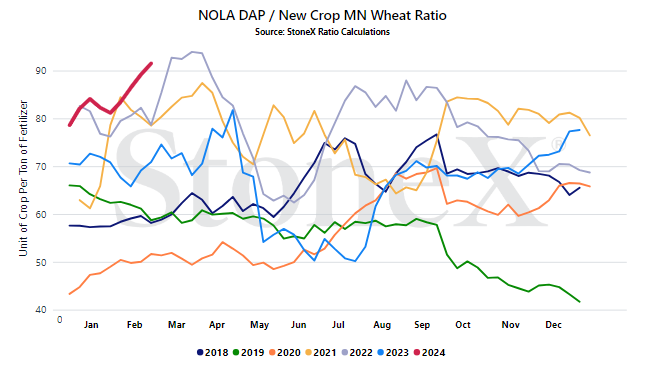
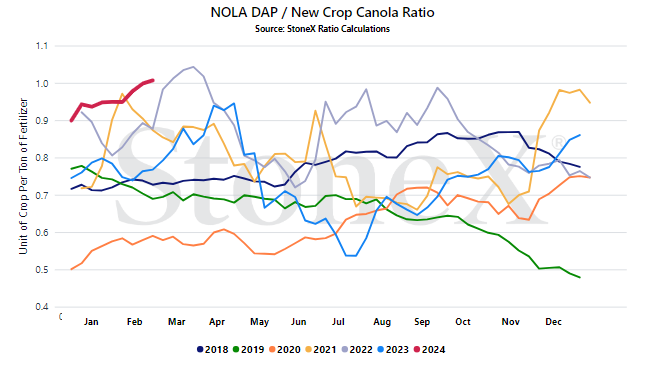
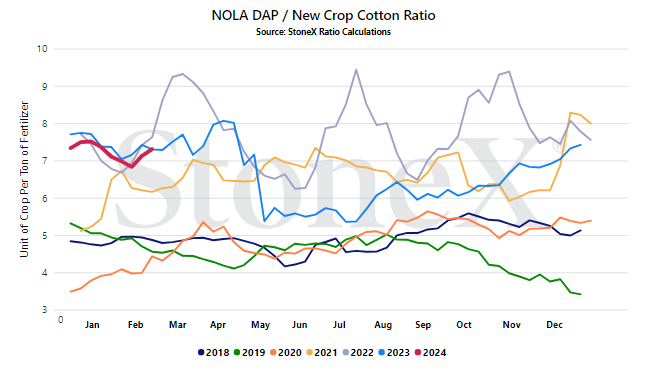
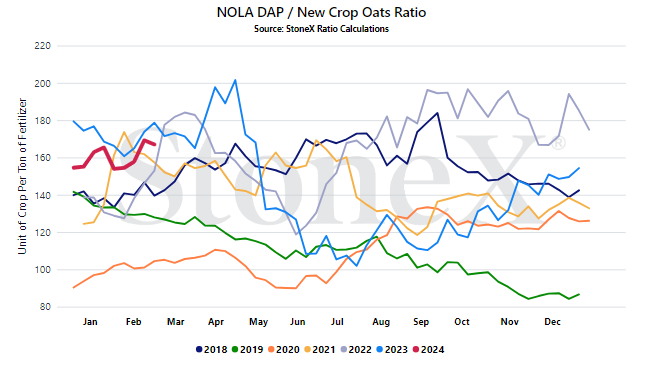
When we compare the current ratio value against recent years, we start to see if we are high or low.
YOUR VALUES MAY LOOK DIFFERENT
This graph looks at the NOLA DAP price vs the flat grain price. There are no logistics on either product. Your location will look different due to fertilizer logistical costs, grain basis, etc.
- China - when the global leader in phosphate exports restricts their programs, the world takes notice and values rise. When the global leader in phosphate exports loosens those same restrictions, we should see the opposite. While I doubt we see them try to "catch up" to their typical annual export numbers, simply returning to normal tonnage on a monthly basis is enough to send shockwaves thru the market.
- Grain values - not only have we seen some global phosphate values strengthen, we have also see grain values falling. That means that phosphate, which was already high priced when compared against many other fertilizer price resets, is in much worse condition. In fact, today the corn/DAP ratio is about as high as it has ever been. If grains continue to fall, it just makes phosphate look that much worse.
- Early spring start after large fall run - at the conclusion of the fall run, I spoke a lot about how we emptied the system and how difficult it would be to reload in time for a normal spring start. Even alluded to how an earlier start would hurt that much more. Never in my wildest dreams did I think we would see a start in the first half/middle of February. That means there was only 2 months to refill. Phosphate is going to be playing catch up for a lot of the rest of spring.
- Summer reset price ideas - how high/low the price reset belief is will reflect just how badly a company wants to dump their inventories. Sure, there is upside potential right now but hold that position too long and pay the price. I am in the camp that NOLA DAP values should fall to the mid to low $400's (currently low $600's) which means in my mind, there is $200+ worth of correction coming. If others agree (some are), it makes it very easy to want to dump tons earlier and cause the market to move lower than expected.
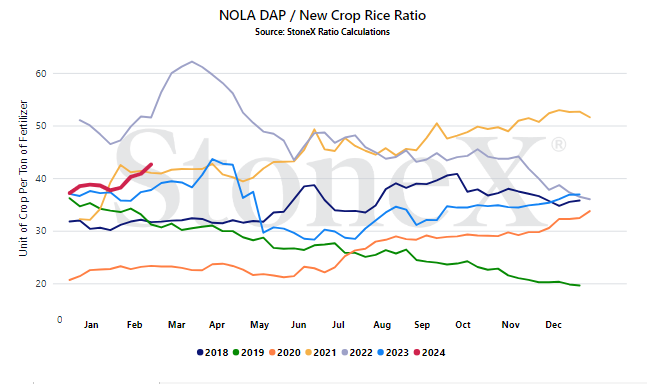
StoneX Ratio Calculation
The ratio calculation is derived from Bloomberg historical grains values as well as fertilizer values from StoneX, NPKFAS, and Argus.
The calculation is simply dividing the fertilizer price by each grain price.
All data was sourced from StoneX unless otherwise noted.