

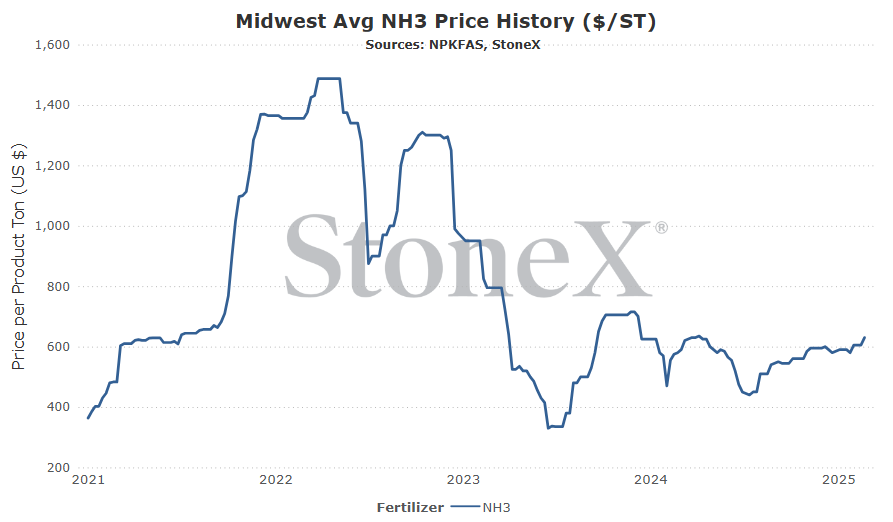
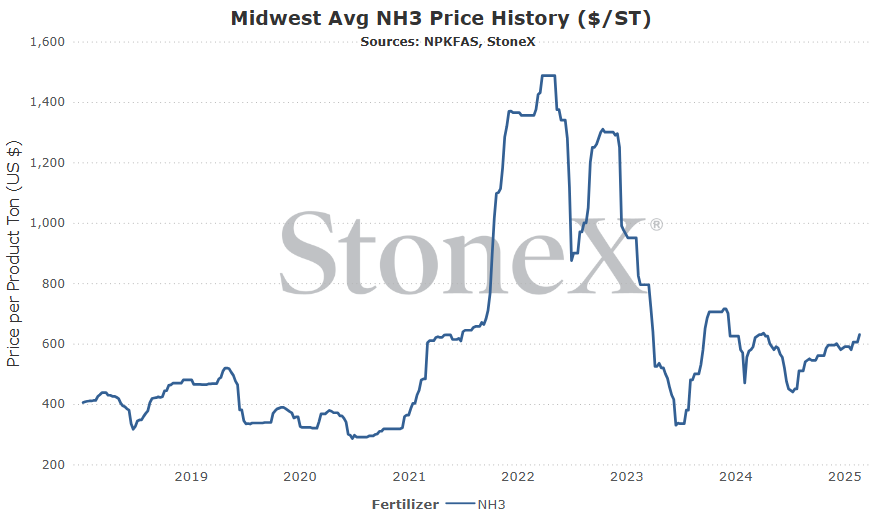
The first graph is the AVERAGE of the entire Midwest U.S. region. That means your local value WILL be different than what the graph reflects. Please do not take this into your retailer and say "why isn't my price the same as here". That is comparing apples to oranges. You might be on the cheaper or more expensive side of this graph. This doesn't take into account logistics/storage/interest/insurance/shrink/etc.
This graph looks at the price from a short ton and USD currency POV.
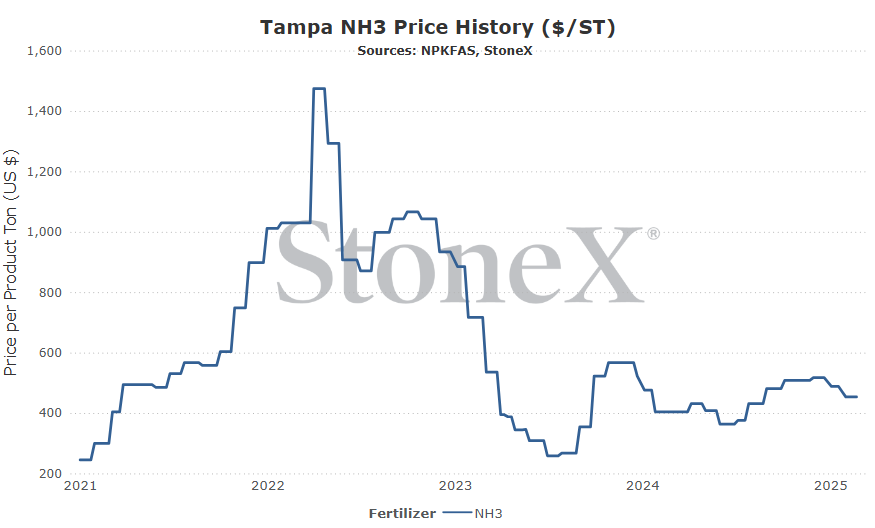
This second graph looks at the price set for Tampa NH3. This value does not have a high correlation to Midwest values. It is a talking point used when prices are rallying...yet somehow gets skipped on the way down. This price is more an indication of the global price. This price is set by two parties (purchaser - phosphate producer in Florida / seller - international producer providing NH3 to FL phosphate production).
This graph CAN be used as an indication of global market price direction/trends. This graph SHOULD NOT be used to determine a Midwest value. Tonnage is listed in short ton and currency in USD.
There just hasn’t been much changing in the way of global NH3 markets. We continue to watch for Russia’s return…but haven’t seen it. We got worried we would lose more European based nitrogen production due to rising gas values…but then gas values dropped again. It seems global production is chugging along with no real production outages heard. Demand continues to look relatively stable.
Prices should stay flat but if I had to choose a side, I would choose bearish. Only because Russia’s return story is still a possibility, and a somewhat quiet period is looming.
North America
Spring is upon us!! Around Kansas City, temps are back into the 50’s and 60’s. The frost is quickly being drawn out of the ground. If we could get a decent rain, that would help settle the soil and set us on our way to application!!!
Now, we must consider the supply and demand side.
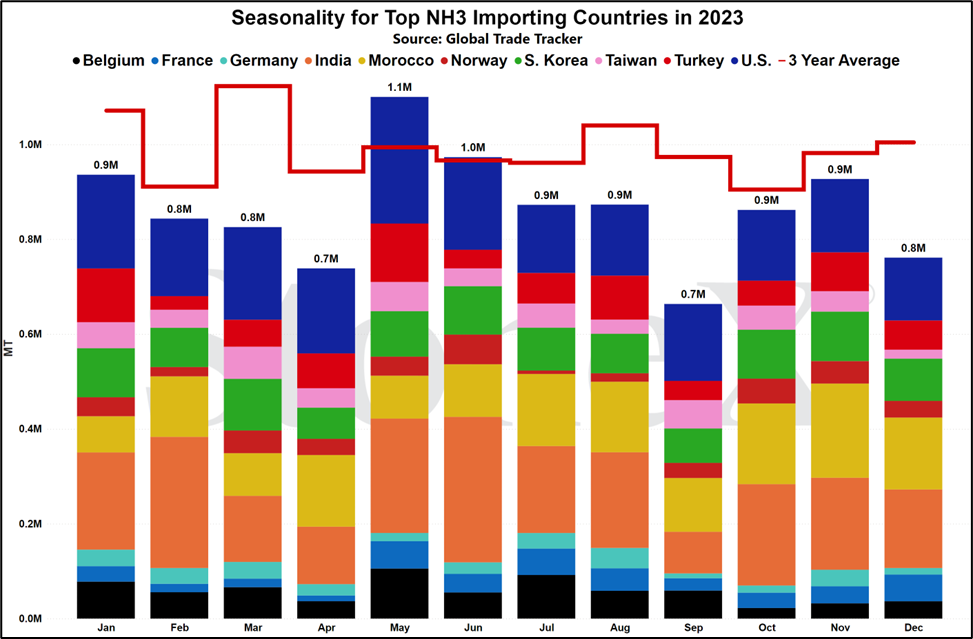
The fall season, while far from normal, was solid. We had forecasted a 2.15M ton fall run and came close at our current number of 1.9M tons. Even that little shortfall adds some tons to the spring. Then the timing. It was a late run that saw a lot of the Midwest going until nearly Christmas. That means inventories were empty very late into 2024, leaving a relatively short period to fill. The market knows this…
Then there is rising demand. We continue to push our corn acreage forecast higher. We started 2025 at 92M. We are currently at 93.5M with a nod to higher more likely. Many are forecasting 94 – 96M. All these acres require nitrogen and first on deck is NH3.
The only surprise of the last month is that Midwest values have not risen more in relation to urea and UAN price strength. However, it makes sense when you consider it from the manufacturing POV. The last thing they want to do is carry tons over past spring. Better to keep the price where it is and wait for either sales or shipments to pick up. Once either of those happen, more bullishness should be seen.
With all that said, I’m expecting Midwest NH3 values to rise over the next month barring a horrible weather situation. Once we get past preplant and start focusing on planting and sidedress applications, values “should” start to soften as everyone rushes the remaining demand in hopes of getting empty.
No Russia export change, but peace could help even more?
When talking about possible peace between Russia and Ukraine, both urea and UAN should see some empathetic bearishness as war time premiums get removed from the market. It also helps that the market will gain hope that normal European gas supplies return and bring with it normal European gas pricing which is desperately needed to bring production back to full.
However, there could be a MUCH more direct impact for NH3.
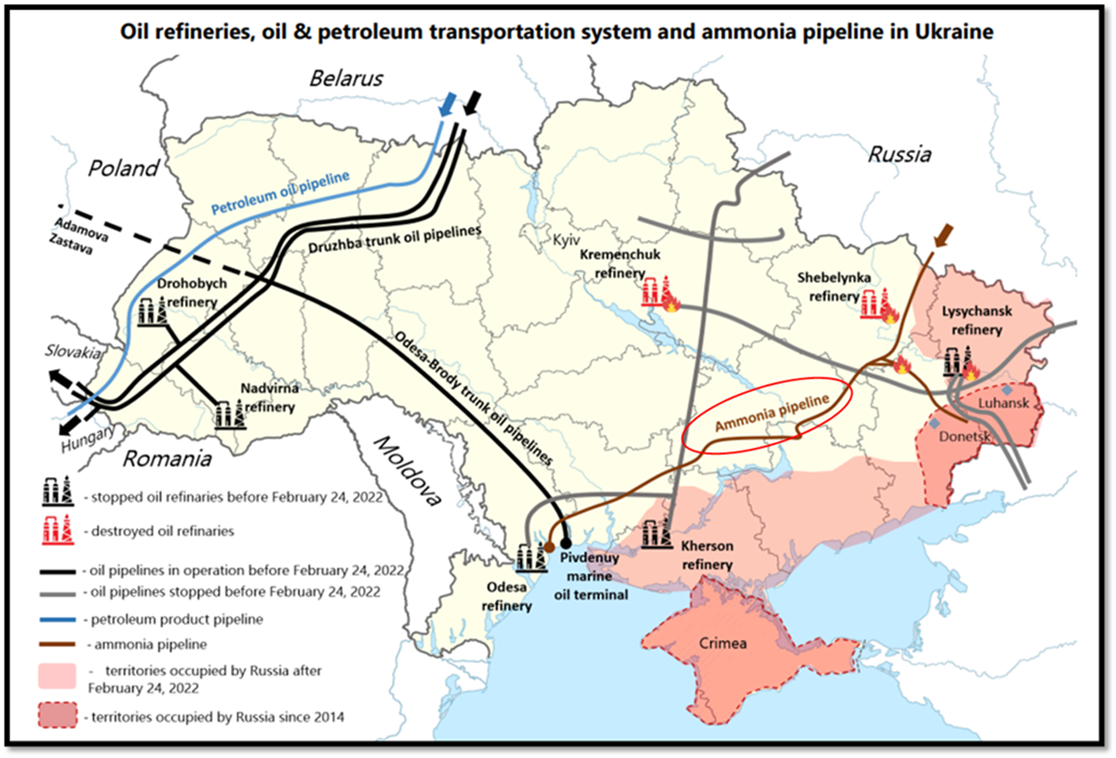
As you can see on the map below (source: USDA), Russia has historically produced NH3 within her borders, shipped it thru a long pipeline that traversed the east/south of Ukraine, ended around Odessa and then loaded ships to sail off into the seas. Not surprising, flows stopped once the invasion began. To make matters worse, there has been reported damage to the pipeline. Whether it was maliciously attacked or was just damaged during fighting, the reason doesn't matter. Repairs are needed.
But, repairs on a pipeline sitting above or just under the dirt is going to be much easier than repairs to a gas pipeline running under the sea.
Now, it is important to note that just because fighting stops between the two countries does not mean that this pipeline will be functional again. There is going to be a lot of hurt feelings between the two countries. Russia has been hard at work building new facilities in Ust-Luga and Teman to bypass Ukraine.
However, under the right circumstances, repairs COULD be made and normal shipments COULD return.
If that were to happen, we could see Russian supplies return to normal much quicker than many expect and the return of the world's largest exporter should have a major bearish effect on the marketplace.
It is all speculation but I'm happy that enough progress is being made to have this conversation.
 What does this mean for farmers?
This could mean global NH3 markets returning to normal!
That seems like a stretch, but there has been enough progress that the conversation can be had.
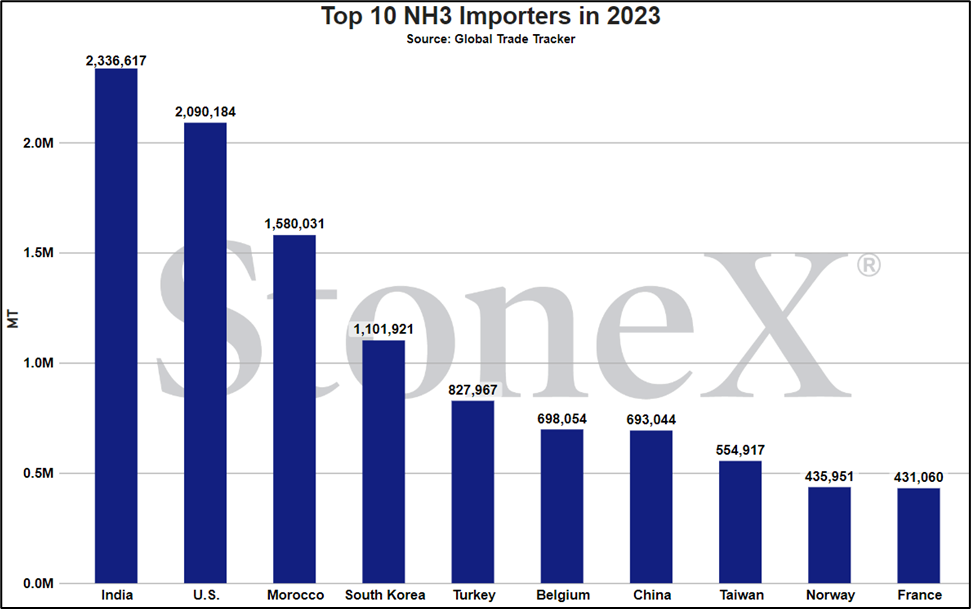
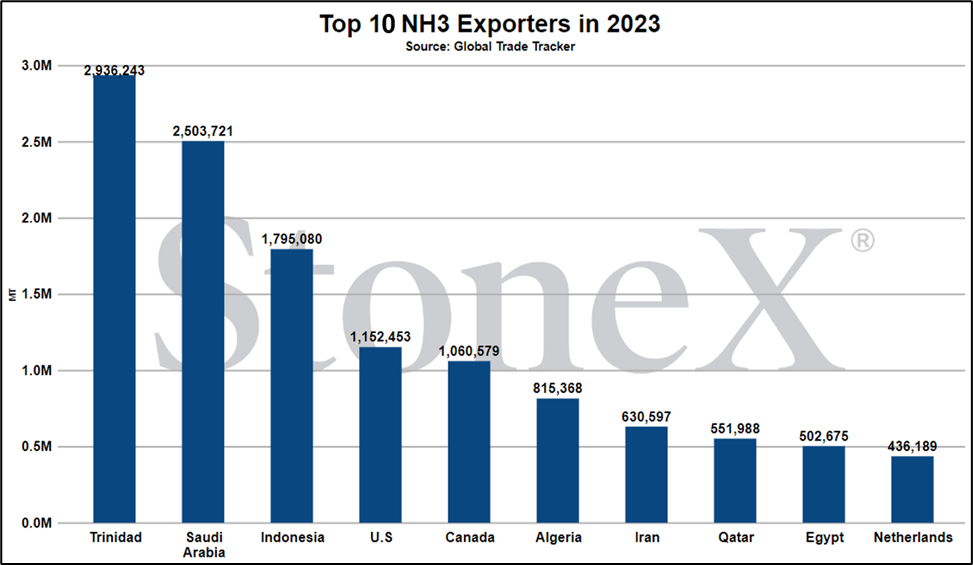
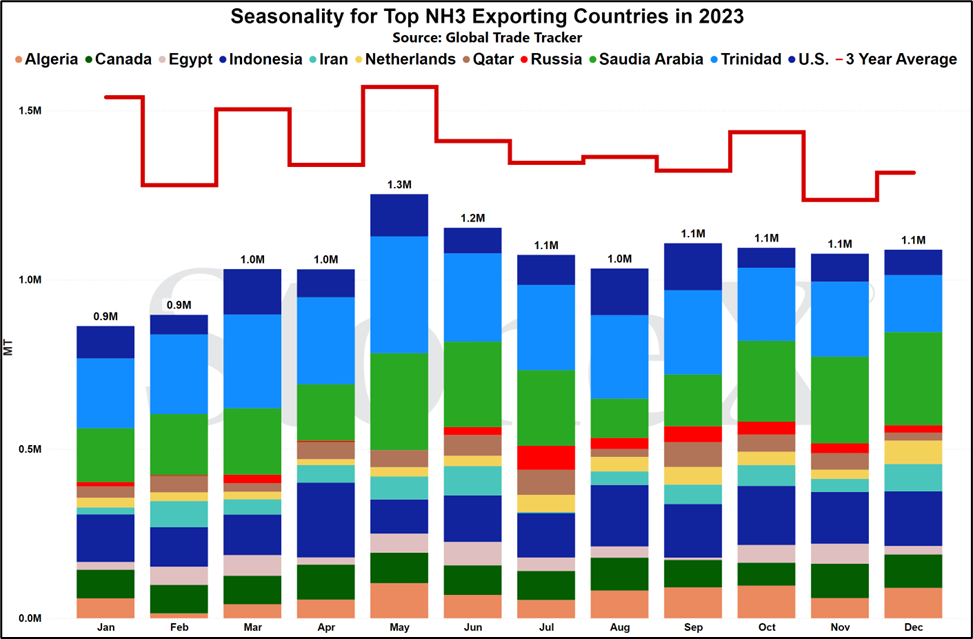
If Russian exports were to return to normal, that is the return of the world's largest supplier or just over 4M tons per year. This would be a huge boost to global supplies.
Lower supplies + constant demand = should mean lower values...if/when it happens
Midwest prepares for spring application
Spring is just around the corner for the North American marketplace. At home around Kansas City, temperatures have risen and rain in the forecast for Tuesday should pull any remaining frost out of the ground.
It will be prime time for NH3 application.
With season coming fast, there are a lot of factors that are supporting market price ideas.
Other nitrogen values are rising - urea and UAN continue to see price ideas rise for a litany of reasons. The reasons do not matter as much as the overarching pattern. Higher urea/UAN prices help support NH3 prices.
Solid fall emptied the system - it didn't look possible at first. November was wet and cold. It looked like it was going to be a failure. Then mother nature relented and provided a wide open window for farmers. The result was getting significantly closer to forecast than we believed possible. That resulted in emptying storage as we moved into 2025.
Late fall run shrunk winter fill period - speaking of the late November/December run, that worked against resupply efforts. Because the market was so late to run, a run that went until nearly Christmas, it diminished the ability of the market to refill. By running until Christmas, it took a large chunk of December off the books to resupply. Now, we only have Jan/Feb/part of March.
Rising corn acres equates to higher NH3 demand - we started 2025 at 92M acres. We quickly raised it to 92.5M acres. Not long after, another jump to 93.5M (our current estimate). Some are forecasting between 94 to 96M acres and honestly, it is hard to argue. It is a compelling case. Every additional corn acre equate to additional nitrogen demand with very little time to prepare...and NH3 application is first up.
Honestly, my biggest surprise is that Midwest NH3 values have not gone up more. When you compare it against urea and UAN prices, NH3 is very well priced. However, it makes sense from the manufacturing POV. Their worst fear is a lack of spring season that creates huge unsold inventory positions as they move into summer. NH3 storage is finite and if they cannot find a home for NH3, they have to consider shutting down the entire plant. Better to approach spring cautiously than to "get cute with pricing", miss demand and have to answer very hard questions by management.
Ultimately, the next 30 days comes down to weather. Aside from that, the stage is set for a major spring run.
What does this mean for farmers?
I think it will mean NH3 prices that continue to run up until planting begins.
There is plenty of demand out there. The market just needs weather to shape up and allow farmers and retailers to do what they do best. If that happens, do not be surprised to see prices up again next month.
U.S. Midwest Wholesale price average
Vs 30 days ago - 9% or approximately $50 higher
Vs 90 days ago - 6% or approximately $35 higher
Vs 6 months ago - 24% or approximately $120 higher
Vs 1 year ago - 9% or approximately $50 higher
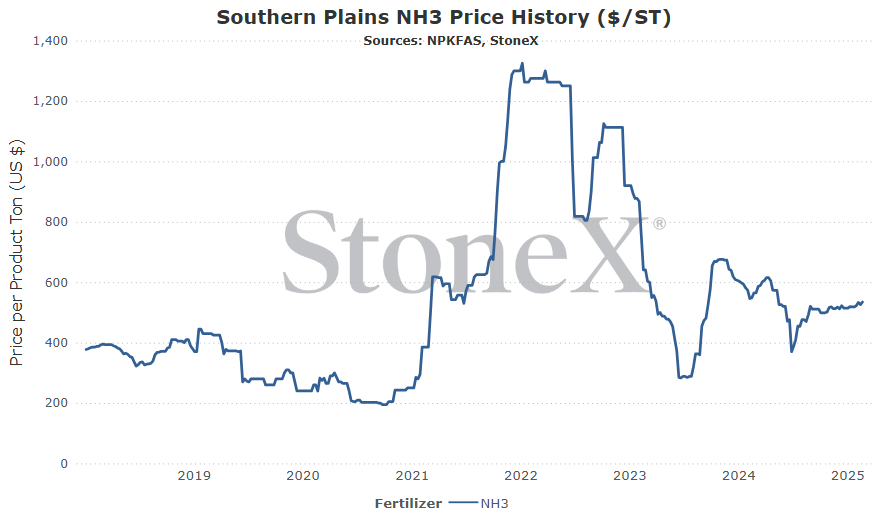
U.S. Southern Plains price average
Vs 30 days ago - 3% or approximately $16 higher
Vs 90 days ago - 4% or approximately $22 higher
Vs 6 months ago - 14% or approximately $65 higher
Vs 1 year ago - -5% or approximately $31 lower
- Russia continues to be absent with little to no explanation - this has been the story since Russia first invaded Ukraine. Their pipeline access and vessel loading capabilities in the Odessa region were cutoff and as a result, the world's largest NH3 provider went missing. Russian manufacturers are not taking this lying down. They will return...eventually. It is bad that they are still missing after all this time. It is worse that there is little to no explanation for when they return. It leaves a solid amount of uncertainty in the market and uncertainty in this case results in higher prices.
- European gas markets skyrocket again, resulting in more production going offline - for a few days, the Dutch TTF market rallied into the $17MMbtu range and there was serious fear that more European based nitrogen production would shut down as a result. Fortunately, no plants were heard idling production and gas values dropped. That doesn't mean we are out of the woods. Values could easily spike again. It doesn't look likely, but never say never.
- Wide open N.A. weather window - the setup is there for a major spring season. The fall was good, but it fell short of our forecast (1.9M vs forecasted 2.15M). Some of that demand will be lingering in the spring. Then we have been raising our overall N demand with higher corn acres. We have jumped from 92M to 93.5M. Others have been saying 95 - 96M is possible. Every additional acre is additional N demand in some form. If the weather is right, NH3 will be first up.
- Russia finally returns - it has to happen eventually...probably...I think! There has been enough smoke surrounding the Russian NH3 export return that there must be fire somewhere. When that day finally comes, it should instill a lot of fear in global long positions. Why be long product if the biggest bully is back? Heck, even manufacturers will take more of a sales first, price second approach.
- N.A. weather stays poor for next 45 days, keeping farmers out of fields - I often say in my presentations that "NH3 could be free, but if it is cold and wet enough to keep tractors out of the field, it doesn't matter". That is just as important for this spring as it has been for every season before. The demand is there. The supplies are ready to go. Unfortunately, it still depends on the weather window.
- Farmers opt to skip NH3 application in hopes of lower urea/UAN values - as soon as you drop that toolbar in the ground and start pulling, you are committed to the crop. This year, that could be a problem. Most I have spoken with continue to say that there isn't a crop that leads to a guaranteed profit (or as close to one that is possible). In these conditions, it makes sense that farmers would want to wait as long as possible before committing. The longer you wait, the more of a chance you have for a path to open. Could this be the spring that farmers drag their feet on spring NH3 in hopes of improvement, thinking they can catch up with another N form? Doubtful...but possible.
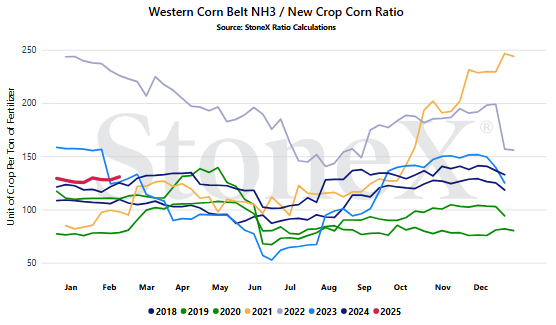
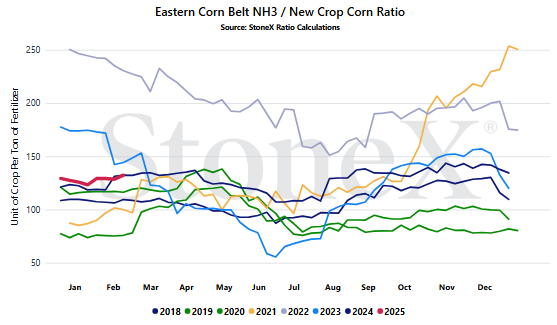
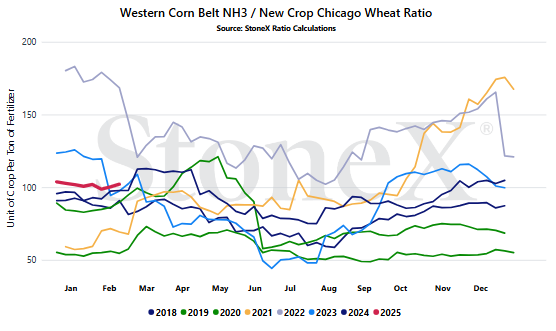
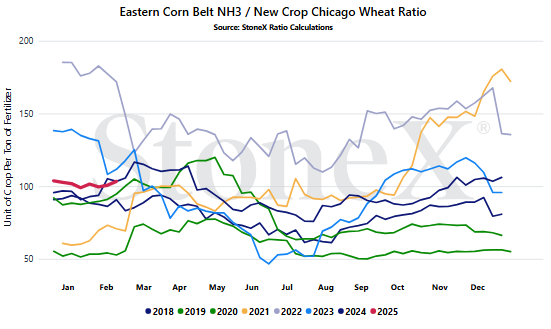
Where are the current NH3/grain ratio values today
We believe that only looking at the flat price of either grains or fertilizer can be misleading:
-
Only selling grain can hurt you if fertilizer prices rise substantially
-
Only buying fertilizer can hurt you if grain prices fall
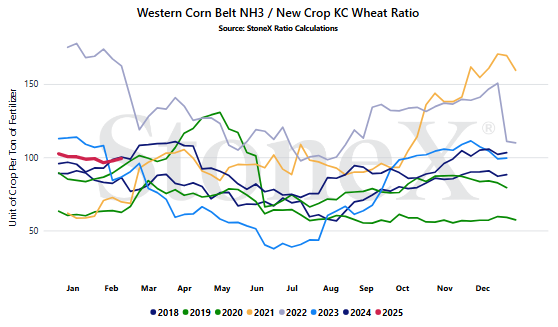
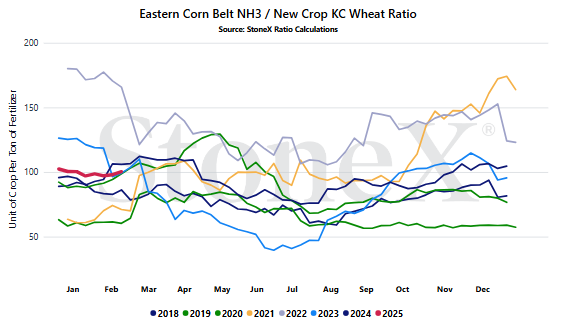
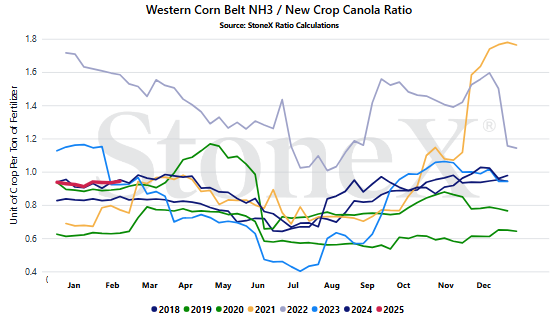
We look at the ratio "value" to get a better indication of where we are or how many bushels of X does it take to pay for 1 ton of fertilizer.
Would you rather:
-
Spend 150 bushels to pay for 1 ton of potash
-
Spend 100 bushels to pay for 1 ton of NH3
When we compare the current ratio value against recent years, we start to see if we are high or low.
YOUR VALUES MAY LOOK DIFFERENT
This graph looks at the NOLA NH3 price vs the flat grain price. There are no logistics on either product. Your location will look different due to fertilizer logistical costs, grain basis, etc.
- Russia's return, or lack of, for the global market - if Russia were to return to exporting NH3, it would usher in the world's largest supplier back to the market after years of absence. Even if exporting at a rate less than 4M tons per year, similar to if China were to return to exporting urea, no doubt it would create an air of bearishness around the globe. However, the longer they are removed from the export market, the tighter the global S&D and the more price support seen. That would not mean prices cannot fall. It just means it wouldn't fall as much as it would if Russia were back. What they do or do not do matters.
- European nat gas markets - fortunately, European natural gas markets have calmed and backed away from their high's. There were a few days where I was coming to terms with having to describe how we lost more European based nitrogen manufacturers. That didn't happen...but it doesn't mean it still cannot happen. As the Dutch TTF market goes, so to does production rates. If w lose anymore, it would create an even more bullish outlook.
- N.A. weather patterns / demand growth - the time for preparing for spring application is basically done. The tons that are in place or on the move are what we are getting. Weather will play an incredibly important role over the next 30 - 45 days. If it is wide open, we can expect a huge run which is buoyed by growing corn acres that will empty storage. If weather stays cold and wet, it wouldn't matter if the NH3 was free. Doesn't help if we cannot pull toolbars thru the fields. I hate this period because all the forecasting and outlooks mean nothing. Now, it is up to mother nature to provide a window for application.
StoneX Ratio Calculation
The ratio calculation is derived from Bloomberg historical grains values as well as fertilizer values from StoneX, NPKFAS, and Argus.
The calculation is simply dividing the fertilizer price by each grain price.
All data was sourced from StoneX unless otherwise noted.




